Fear & Greed Index
Source: Alternative
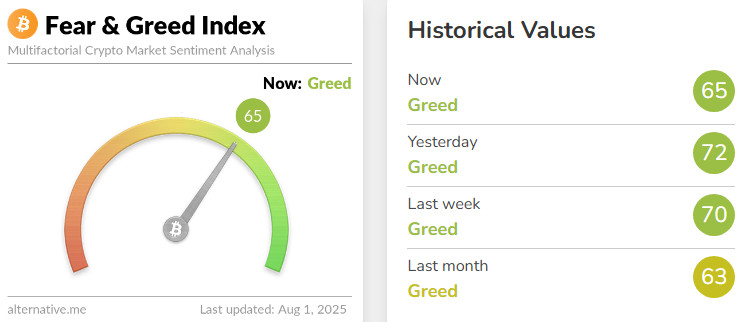
- Change in Fear and Greed Value: -5
- Last Week Level: 70 (Greed)
- This Week’s Level: 65 (Greed)
The Fear and Greed Index fell from 70 to 65 this week, indicating a slight weakening in investor sentiment. At the start of the week, markets were expecting the Fed to hold rates steady at its July meeting, while continuing to price in a possible rate cut in September. In mid-week, the Fed kept interest rates unchanged as expected, but data showing that inflation continued to hover above the target and the labor market remained strong curbed market optimism by dampening expectations for a rate cut in the near term. In the same period, the US’ preparations to impose new tariffs on some of its trading partners increased global uncertainty and suppressed risk appetite. Financial results from major technology companies had a mixed impact on the overall picture. While the strong balance sheets of Microsoft and Meta supported risk appetite in the first half of the week, the cautious attitude of investors after the results of Amazon and Apple, Amazon shares lost value despite the profit announcement exceeding expectations, limiting the rise in the markets. In the cryptocurrency market, MicroStrategy’s announcement that it plans to buy more Bitcoin with a new share issuance of approximately $ 4.2 billion signaled continued institutional interest, but despite this strong step, Bitcoin’s inability to persist above the $ 120,000 threshold prevented a significant recovery in crypto sentiment. As a result, both macroeconomic uncertainty in traditional markets and the lack of new regulatory catalysts on the crypto side continued to weigh on investor sentiment this week.
Fund Flows
Source: Coin Shares
Overview
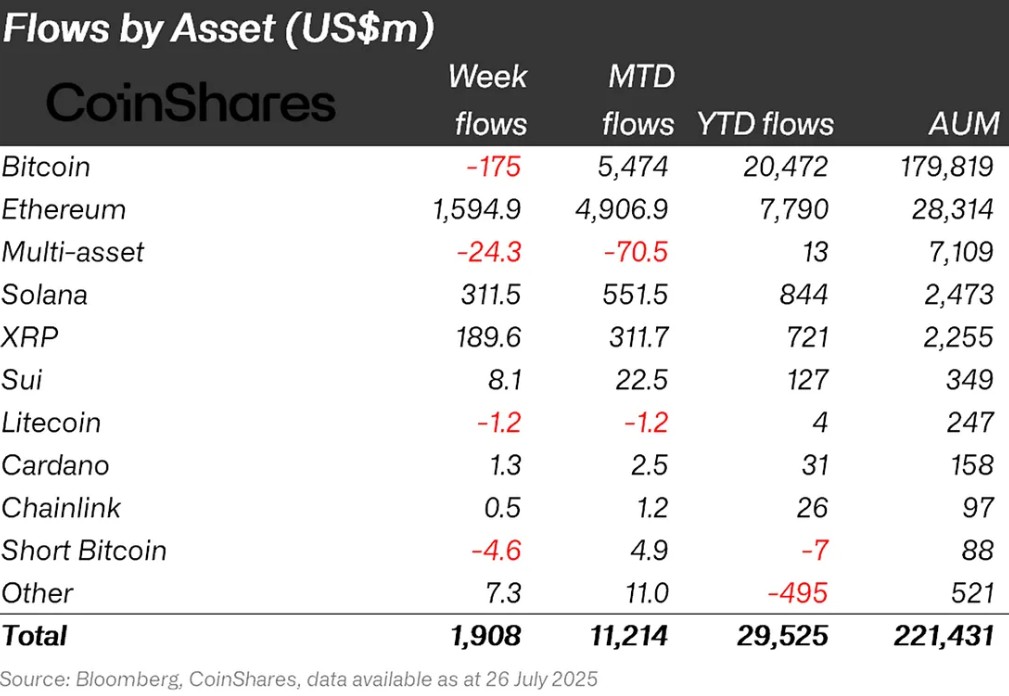
The US President’s rhetoric on interest rate cuts and Powell’s call for an immediate rate cut, together with the new tariffs announced on August 1, created a negative atmosphere in the market. These developments shook the confidence of some countries, leading to a decline in fund inflows and thus a slowdown in the upward movement of prices. This negative sentiment has dampened interest not only in Bitcoin but also in the altcoin market in general.
Fund Inflows:
Ethereum (ETH): Spot ETH continued to perform strongly on the back of institutional interest and fund inflows. This week, $1,594.9 million flowed into Ethereum.
Ripple (XRP): The approval and launch of the ProShares Ultra XRP ETF (UXRP) opened up access to XRP for institutional investors. Fund inflows in Xrp this week totaled $189.6 million.
Solana (SOL): Recent ETF news continued at Solana. Solana saw inflows of $311.5 million.
Cardano (ADA): The Cardano Foundation continues to launch enterprise-grade auditable products. This week Cardano saw $1.3 million in inflows.
SUI (SUI): SUI has been attracting interest from institutional investors recently. Mill City Ventures, a non-bank lender, recently announced a $450 million private placement to build a crypto treasury strategy for the Sui blockchain. Sui has seen inflows of $8.1 million this week.
Chainlink (LINK): Chainlink Labs’ participation in the US Securities and Exchange Commission’s (SEC) crypto task force is considered an important development that boosted the LINK price. Upon notification of these updates, Link saw an inflow of 0.5 million dollars this week.
Other: Altcoins saw sectoral and project-based rises. These attacks led to an inflow of $7.3 million in fund flow data.
Fund Outflows:
Bitcoin (BTC): Outflows from Bitcoin-focused funds reached $175 million this week.
Short Bitcoin: Outflows to short bitcoin positions totaled $4.6 million.
Litecoin (LTC): Outflows from the LTC coin totaled $1.2 million.
Multi-asset: Despite ETF data, outflows were observed in the multi-asset group.
Total MarketCap
Source: Tradingview
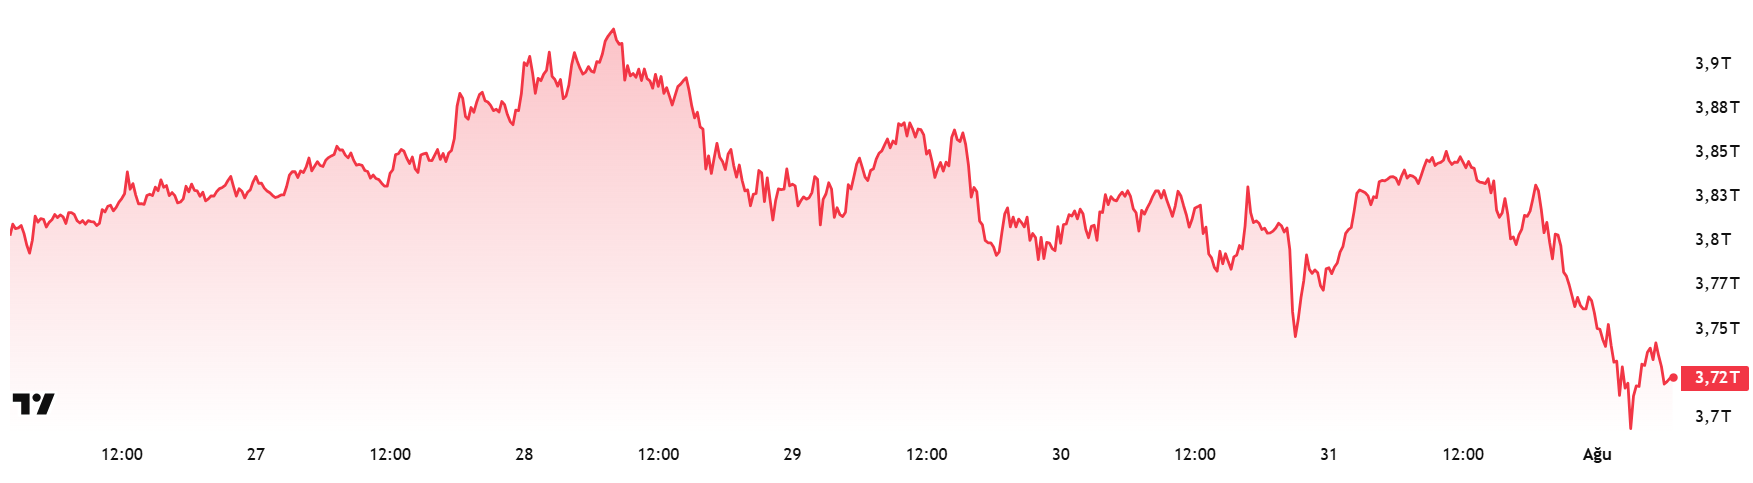
- Last Week Market Capitalization: 89 trillion Dollars
- Market Capitalization This Week: 72 trillion Dollars
The cryptocurrency market recorded a 4.4% decline in total market capitalization with capital outflows of approximately $172 billion this week. With this decline, the total market capitalization fell to $3.72 trillion. During the week, the market capitalization rose to $3.93 trillion, attempting a new peak, but this attempt failed. This development suggests that the positive trend of the last 5 weeks is over and the market may have entered a correction.
Total 2
The Total 2 index started the week with a market capitalization of $1.52 trillion. However, the 6.25% decline during the week led to a loss of approximately 94 billion dollars, bringing the market capitalization down to 1.42 trillion dollars. Thus, the uninterrupted upward movement that had been going on for 5 weeks came to an end. Despite this decline, there remains a gap of around $300 billion between the current level of the index and its all-time high . This means that, technically, it is still possible to break records in the event of a new market momentum.
Total 3
The Total 3 index entered the week with a market capitalization of $1.05 trillion. However, the capital outflow of approximately 72 billion dollars during the week caused a 6.8% decline, pulling the index to 977 billion dollars. With this development, the Total 3 index also ended its 5-week uptrend.
In this week when all indices were negative, Bitcoin showed the strongest stance. In negative market conditions, altcoins usually lose value against Bitcoin; this week was no exception. In this context, Bitcoin maintained its dominance and maintained its relative strength in the market.
Altcoin Season Index
Source : Coinmarketcap
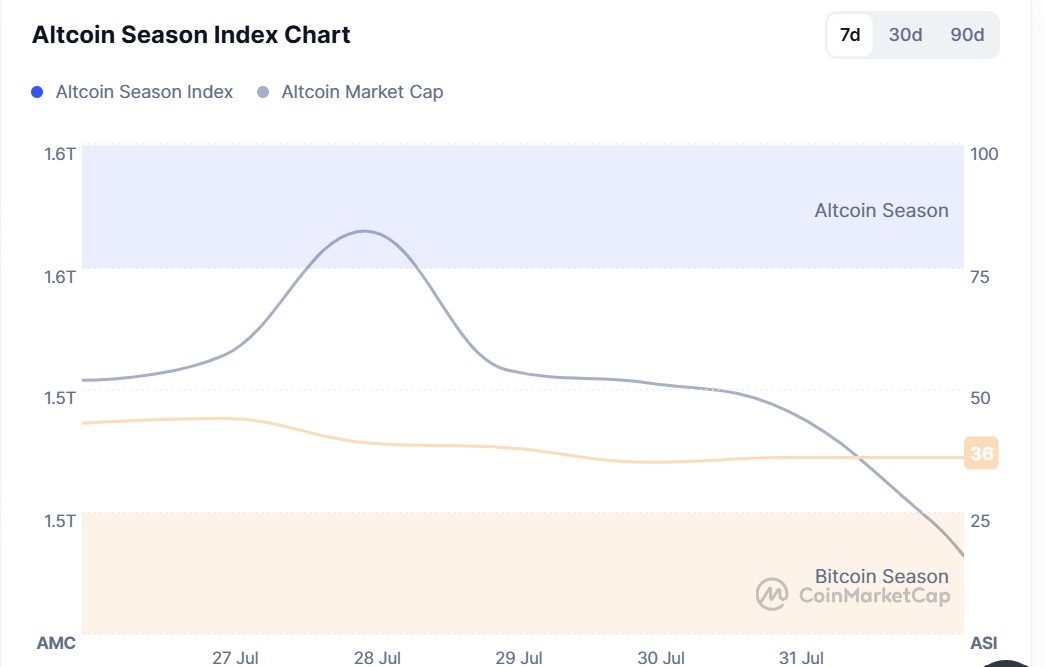
- Last Week Index Value: 44 / 100
- Index Value This Week: 35 / 100
Between July 26 and August 1, 2025, the correlation between the market capitalization of altcoins (Altcoin Market Cap) and the Altcoin Season Index showed a decline. The chart shows that this week, the index peaked at 44 between July 27-28, with the Altcoin Market Cap reaching 1.59T. This indicates a temporary increase in the market dominance of altcoins. The index entered a downtrend from 39 to 36 on July 28. This move suggests that the altcoin season has weakened after a brief potential revival and that the total market capitalization of altcoins has experienced a relative decline compared to Bitcoin.
Bitcoin Dominance
Source: Tradingview
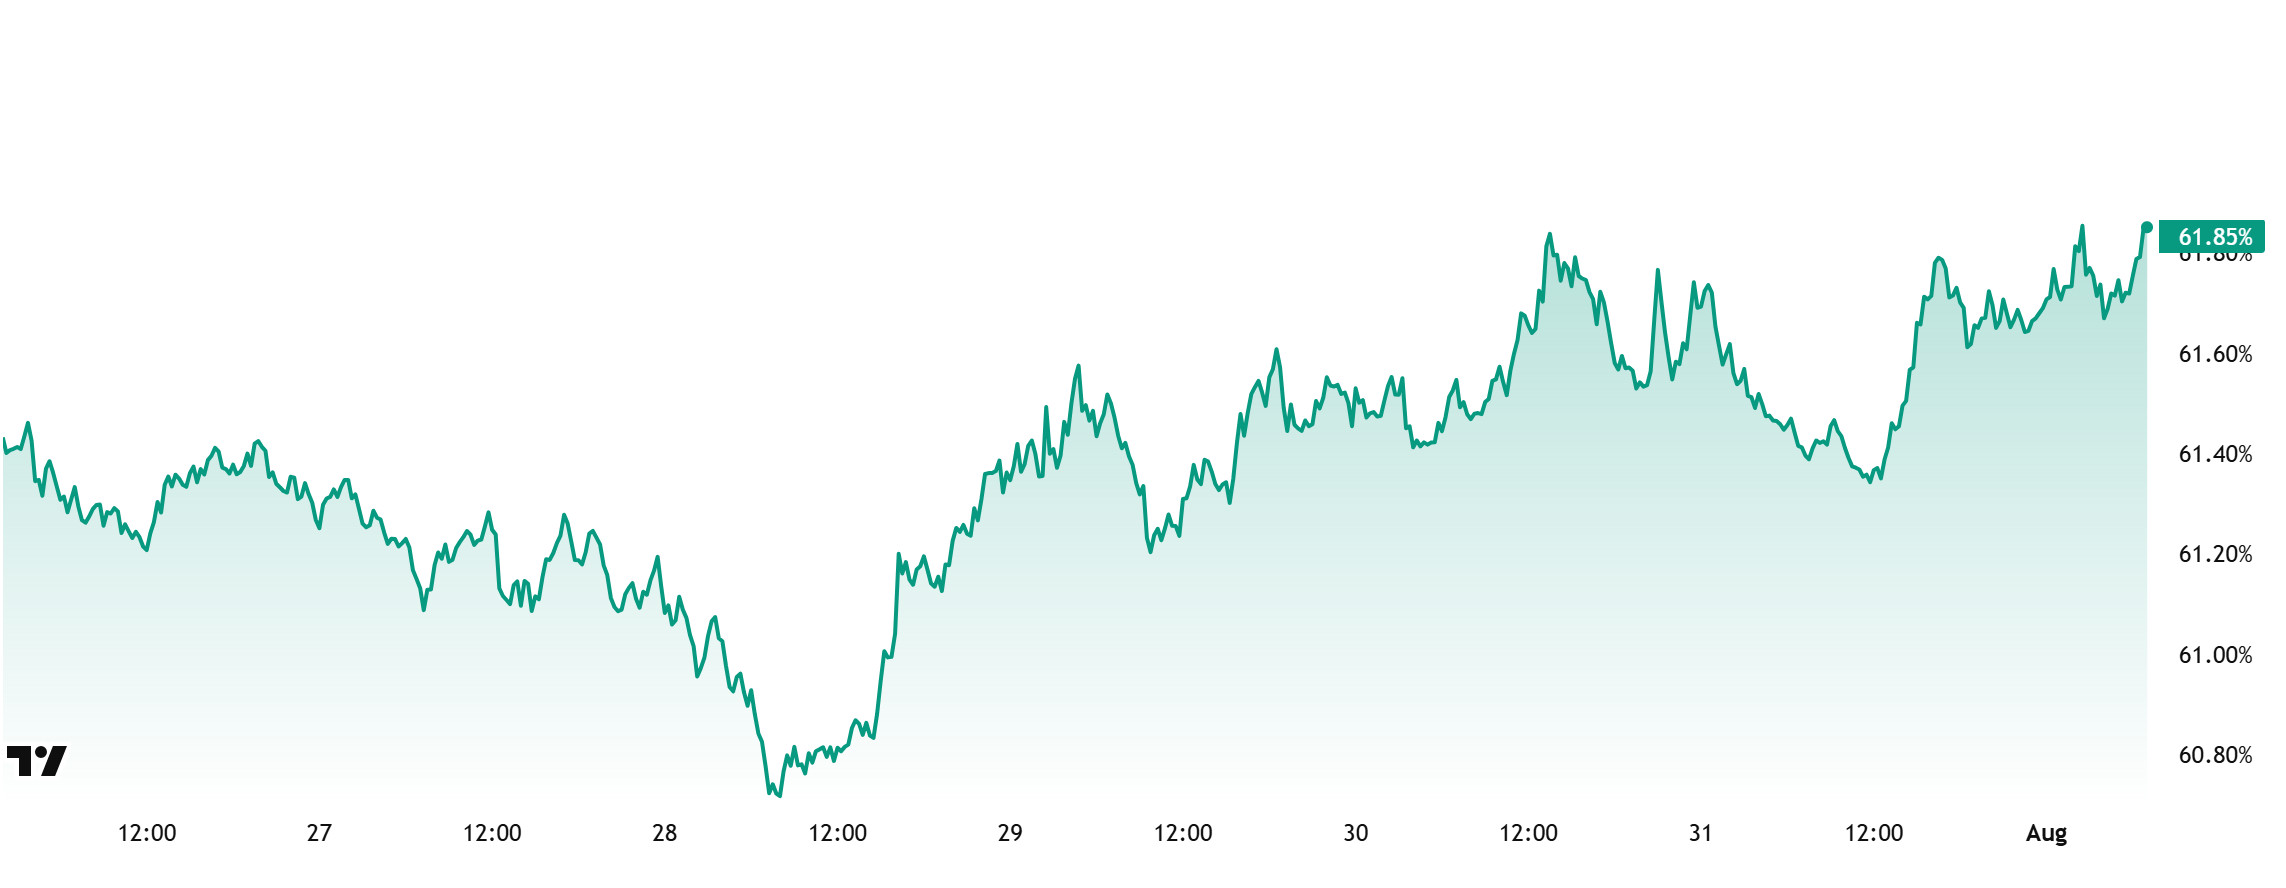
Bitcoin Dominance
Bitcoin dominance, which started the week at 61.04%, declined towards the middle of the week and fell to 60.43%. It rallied towards the end of the week and is currently at 61.85%.
This week, Strategy bought 21,021 Bitcoin, Metaplanet bought 780 Bitcoin, Sequans bought 755 Bitcoin and The Blockchain Group, Europe’s first Bitcoin treasury, bought 58 Bitcoin.
Data on Bitcoin spot ETFs show a total net inflow of $169.2 million to date.
While tariff negotiations are still ongoing, Trump continues to announce tariffs on a country-by-country basis. Most recently, it was announced that tariffs on Canada were raised from 25% to 35%. The current environment of uncertainty has led to a decrease in risk appetite, especially among retail investors, and to sell trades in spot ETFs. On the other hand, inflows continued on the institutional investor front.
The recent volatility has led to capital outflows not only from Bitcoin, but also from Ethereum and other altcoins. If Ethereum and other altcoins outperform Bitcoin in this process, we can expect Bitcoin’s market dominance to decline. Depending on these developments, Bitcoin dominance can be expected to consolidate in the 59% – 62% band next week.
Ethereum Dominance
Source: Tradingview
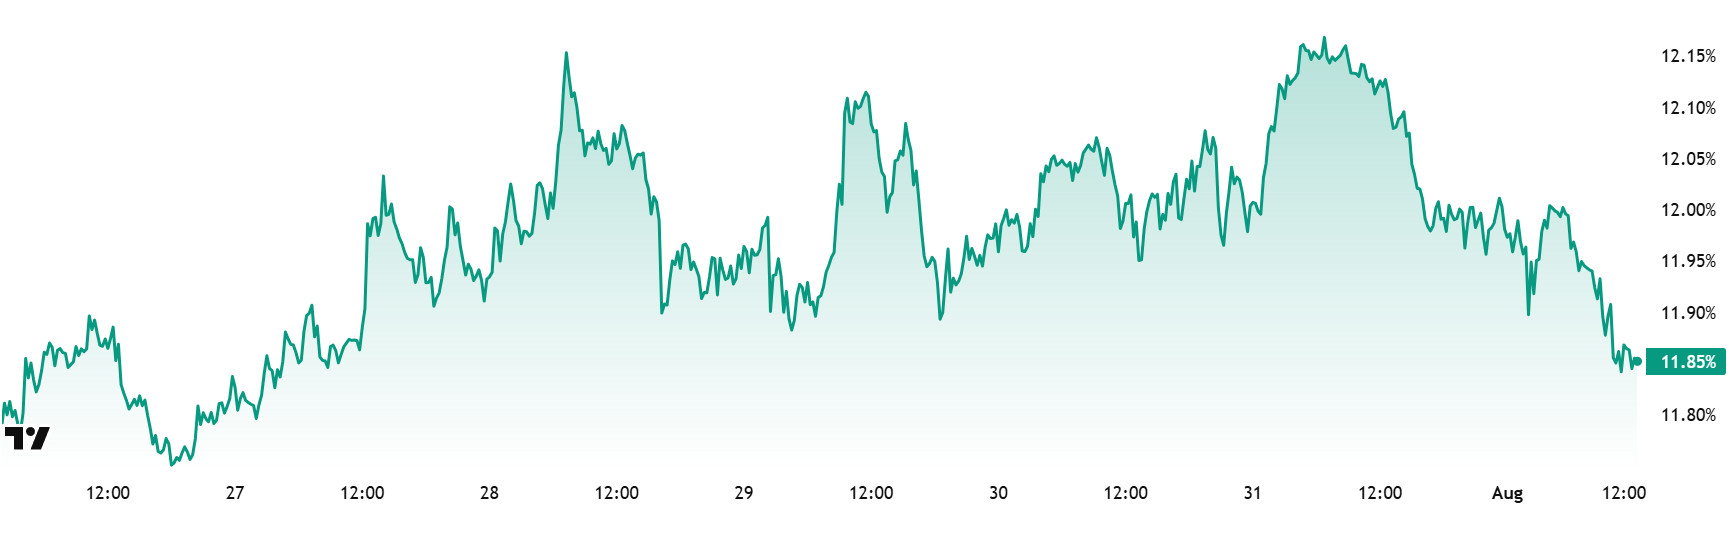
Weekly Change
- Last Week’s Level: 12.01%
- This Week’s Level: 11.85%
Ethereum dominance, which rose as high as 10% as of the second week of June, failed to cross this critical threshold and retreated to 8.60%. However, the dominance, which found support at these levels, regained a positive momentum and displayed a steady upward trend in the last five weeks and reached 12%.
However, some pressure is observed in Ethereum dominance in the current week. Accordingly, while Ethereum dominance ended last week at 12.01%, it is trading at around 11.85% as of current data.
In the same period, Bitcoin dominance, unlike Ethereum, followed a positive trend and showed an upward momentum.
Looking at the fundamental developments affecting Ethereum dominance, open interest in Ethereum futures hit an all-time record of $60.48 billion, according to Coinglass data. Nasdaq-listed blockchain firm BTCS Inc. recently announced the purchase of 14,240 more ETH, bringing its total holdings to 70,028 ETH. Likewise, Nasdaq-listed SharpLink purchased 77,210 ETH during the week of July 21-27, bringing its total Ethereum holdings to approximately 438,190 ETH. Glassnode data shows that Ethereum’s open interest in the futures market is approaching 40%, the highest since April 2023. On the other hand, Ethereum Layer 2 network Linea announced important plans ahead of the official LINEA token launch. The network’s roadmap includes local staking returns for the bridged ETH, an ETH burning mechanism, and a deflationary token economy.
Bitcoin Spot ETF
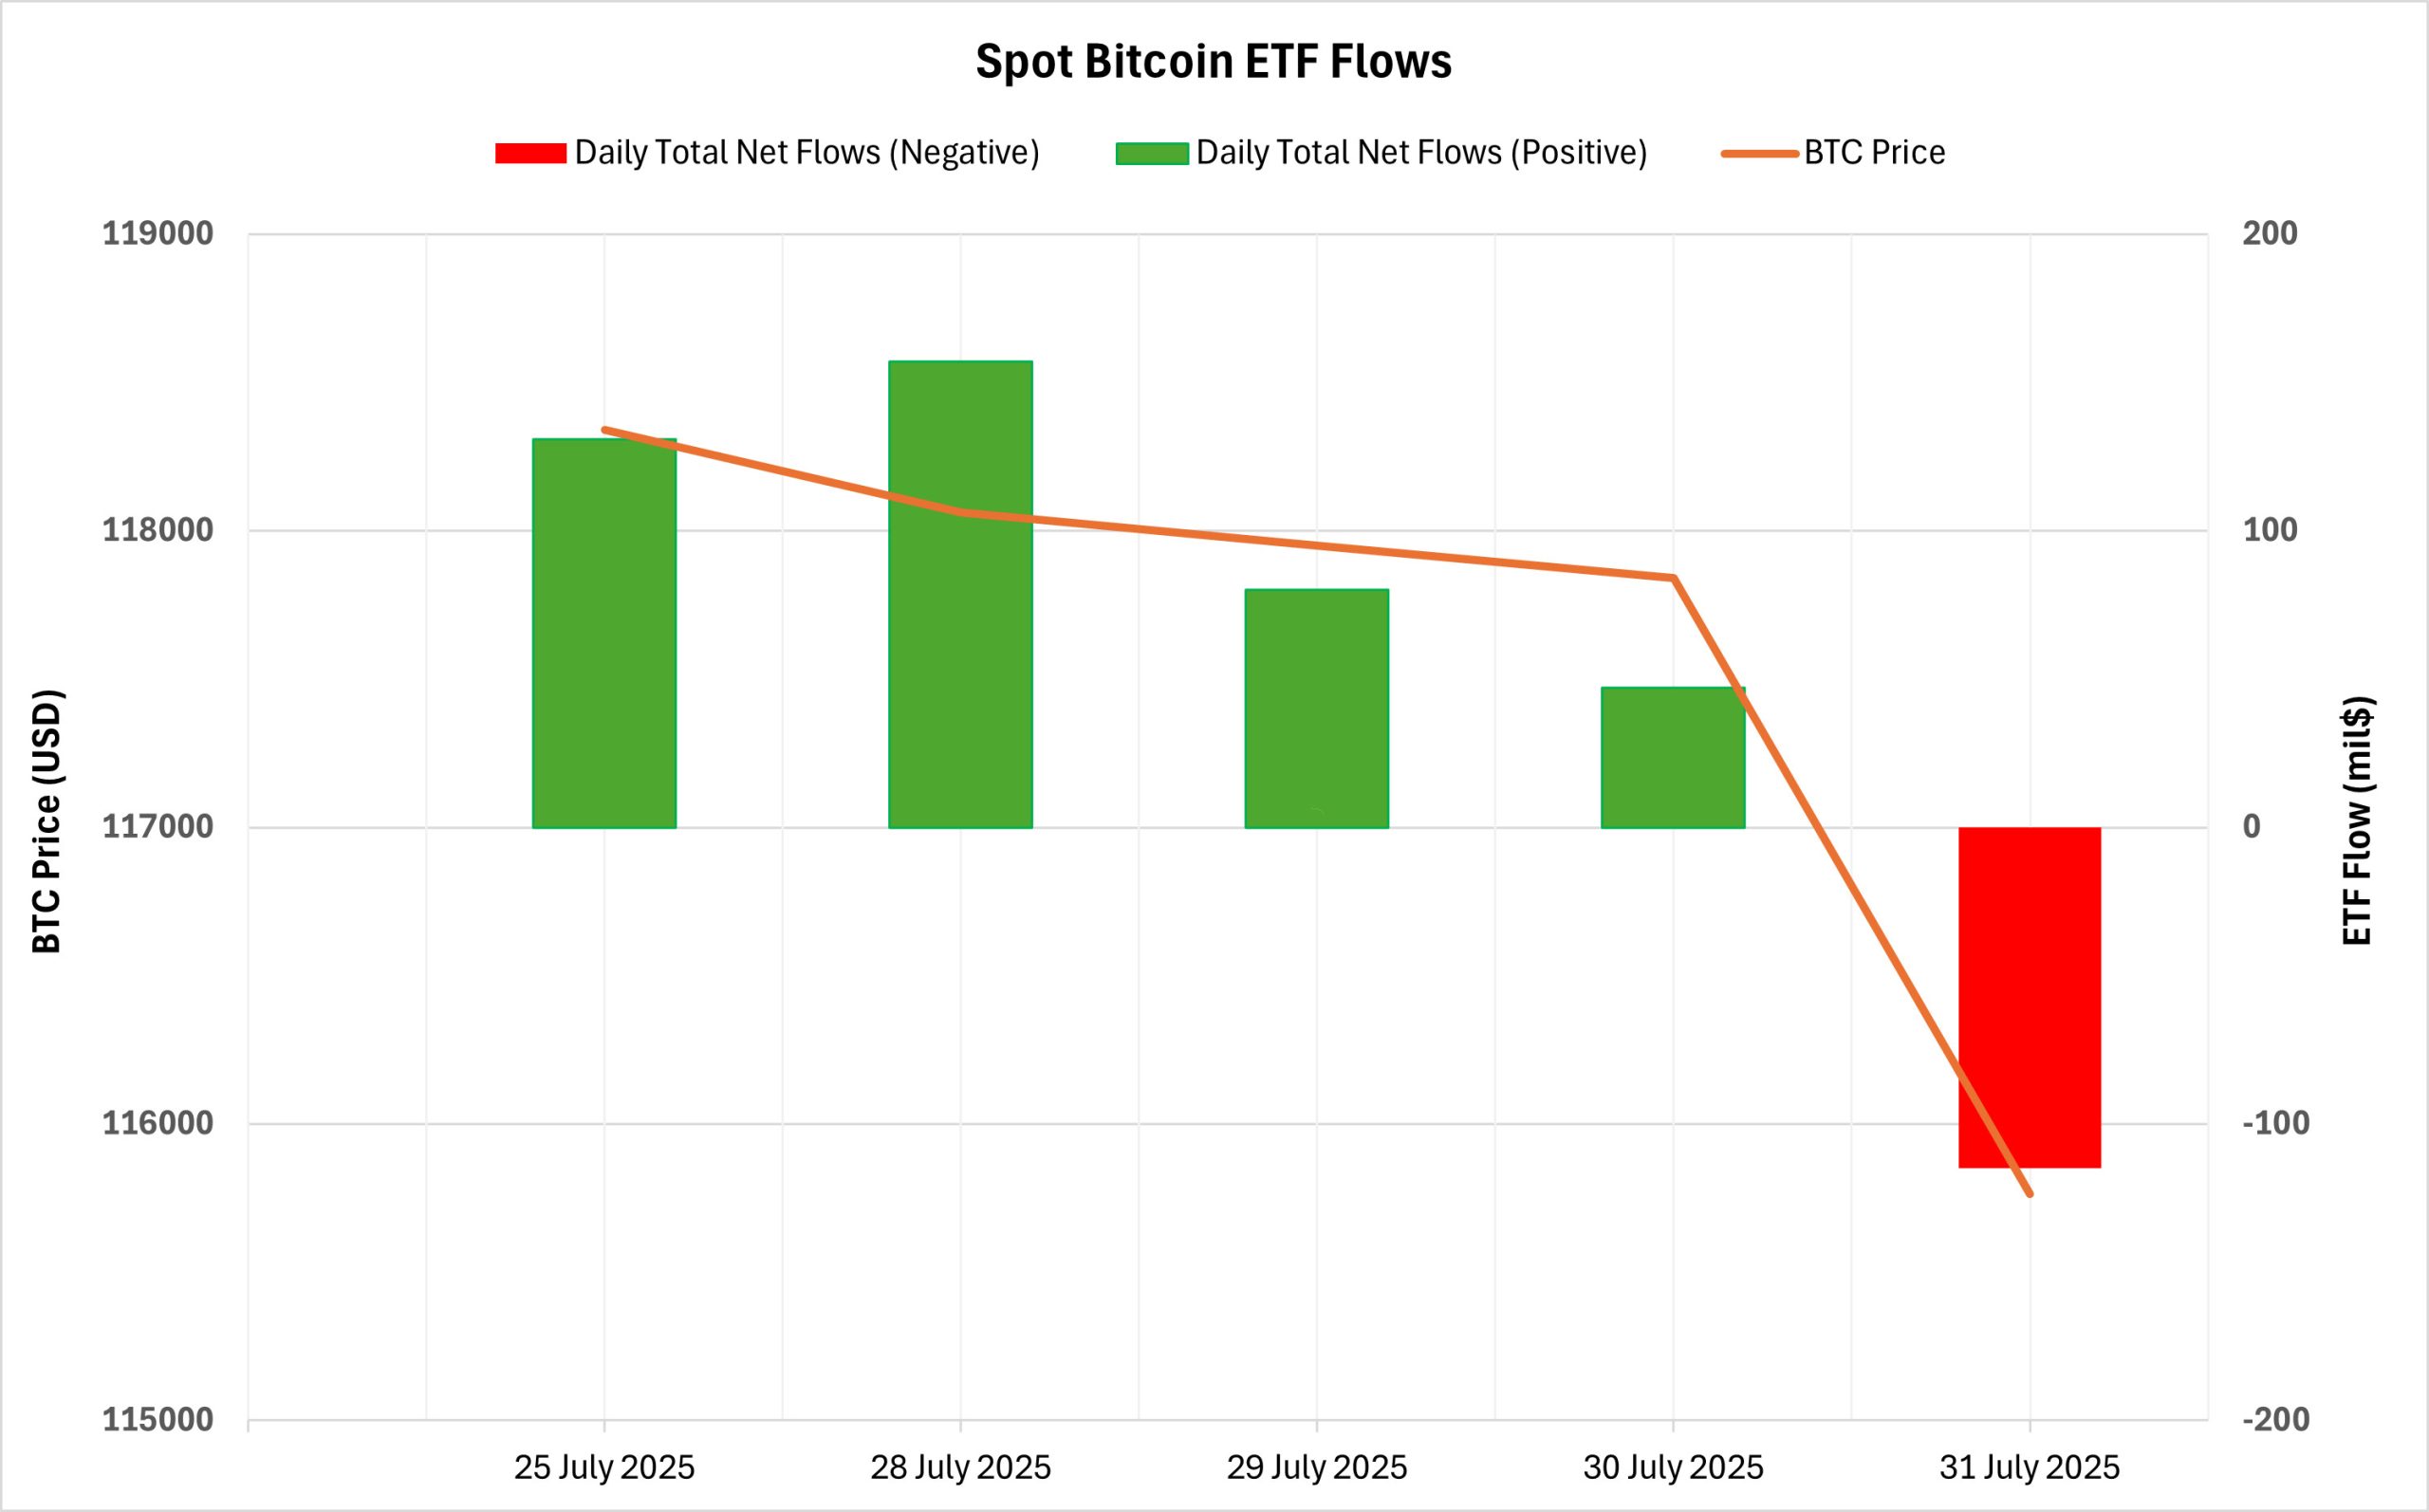
NetFlow Status: Spot Bitcoin ETFs saw a total net inflow of $300.2 million between July 25-31, 2025. The strongest daily net inflow of the week was recorded on July 28 with $157.1 million. During this period, BlackRock’s IBIT ETF led the way with inflows of $450.8 million, while Ark (ARKB) and Grayscale (GBTC) funds experienced significant outflows.
Bitcoin Price: Starting at $118,340 on July 25, Bitcoin closed at $115,764 on July 31, losing 2.18% in the process. Although the Bitcoin price rose to $119,800 in this process, it was seen that it could not be permanent, and the recent outflows put pressure on the price.
Cumulative Net Inflows: At the end of the 389th trading day of spot Bitcoin ETFs, total cumulative net inflows rose to $54.97 billion. This shows that institutional investors are still strongly positioned in the market in the medium term.
| Date | Coin | Price Open | Price Close | Change % | ETF Flow (mil$) |
|---|---|---|---|---|---|
| 25-Jul-25 | BTC | 118,340 | 117,614 | -0.61% | 130.8 |
| 28-Jul-25 | BTC | 119,415 | 118,062 | -1.13% | 157.1 |
| 29-Jul-25 | BTC | 118,062 | 117,950 | -0.09% | 80.0 |
| 30-Jul-25 | BTC | 117,950 | 117,840 | -0.09% | 47.1 |
| 31-Jul-25 | BTC | 117,840 | 115,764 | -1.76% | -114.8 |
| Total for 25 – 31 Jul 25 | -2.18% | 300.2 | |||
The five-day streak of positive net flows between July 25-31, 2025 ended with a net outflow on July 31. This suggests that short-term volatility is still in effect. However, continued demand for BlackRock’s IBIT fund suggests that institutional investor interest remains strong. In the coming period, if inflows to Spot Bitcoin ETFs regain momentum, an upward support in the Bitcoin price can be expected. Strong institutional demand may have a positive impact on the price in the medium term. Moreover, the fact that cumulative net inflows are close to $55 billion suggests that the institutional base in the ETF market is solidifying and that possible new inflows could have a more pronounced impact on the price.
Ethereum spot ETF
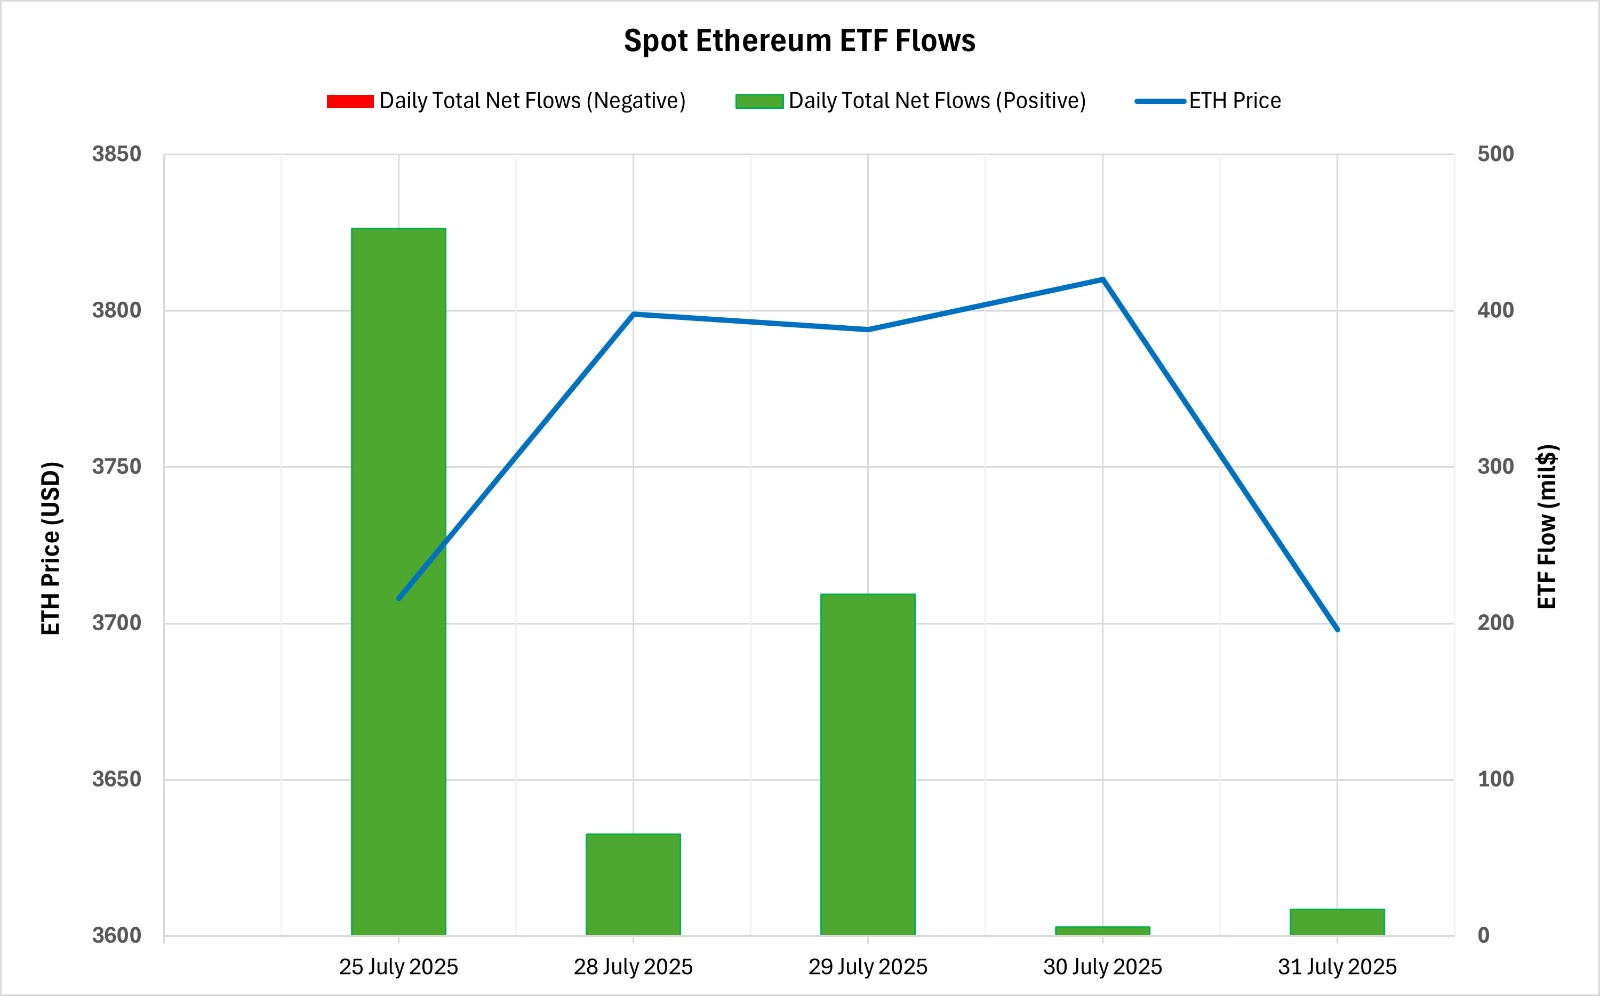
Between July 25-31, 2025, Spot Ethereum ETFs saw a total net inflow of $759.4 million. The strongest daily inflow was $452.8 million on July 25. BlackRock’s ETHA ETF stood out with weekly inflows of $834.3 million. With net inflows every day during this period, the positive net flow streak extended to 20 days, while the total cumulative net inflows of Spot Ethereum ETFs at the end of the 257th trading day reached $9.66 billion. This shows that institutional investor interest continues to be strong.
| Date | Coin | Price Open | Price Close | Change % | ETF Flow (mil$) |
|---|---|---|---|---|---|
| 25-Jul-25 | ETH | 3,708 | 3,725 | 0.46% | 452.8 |
| 28-Jul-25 | ETH | 3,872 | 3,799 | -1.89% | 65.2 |
| 29-Jul-25 | ETH | 3,799 | 3,794 | -0.13% | 218.6 |
| 30-Jul-25 | ETH | 3,794 | 3,810 | 0.42% | 5.8 |
| 31-Jul-25 | ETH | 3,810 | 3,698 | -2.94% | 17.0 |
| Total for 25 – 31 Jul 25 | -0.27% | 759.4 | |||
Ethereum price opened at $3,707 on July 25, 2025, and closed at $3,698 on July 31, 2025. During this period, Ethereum price declined by 0.27%, exhibiting a flat performance. The fact that ETF inflows remained positive despite the weak course of the price reveals that institutional investors maintain their medium-term confidence. Overall, the Spot Ethereum ETF market remained stable and positive this week. Continued institutional demand may contribute to the Ethereum price finding support in the coming period.
Bitcoin Options Distribution
Source: Laevitas
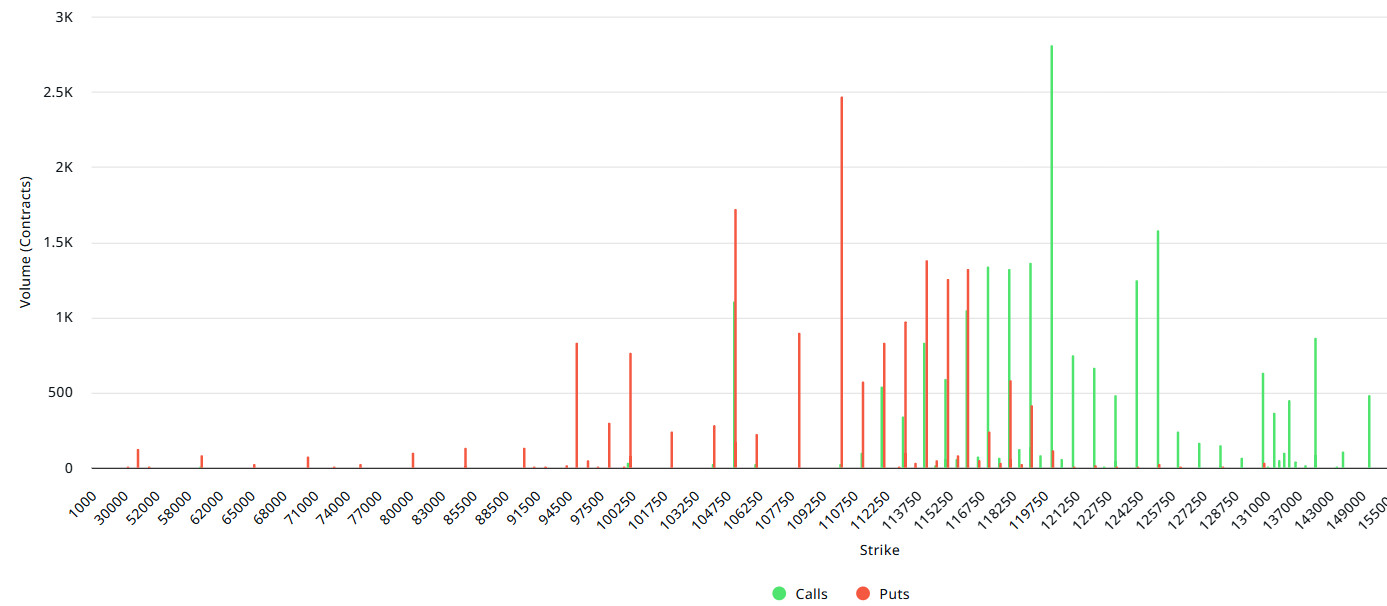
BTC: Notional: $5.72B | Put/Call: 0.74 | Max Pain: $116K
Deribit Data: Deribit data shows that BTC options contracts with a notional value of approximately $5.72 billion expired today. At the same time, according to the data in the last 24 hours, if we look at the risk conversion in the next 1-week period, put options are the dominant side in hedging more than call options. This indicates that the expectation that there may be pullbacks is increasing. When we look at the expected volatility, it is above the realized volatility. This shows that put option fees are cheap. On the other hand, the positive spread value shows that investors are acting appetite. Skew values are highly bearish today and next week.
Laevitas Data: When we examine the chart, it is seen that put options are concentrated in the band of 105,000 – 115,000 dollars. Call options are concentrated between $ 116,000 – $ 125,000 and the concentration decreases towards the upper levels. At the same time, the level of approximately 110,000 dollars is seen as support and 120,000 dollars as resistance. On the other hand, there are 2.76K put options at the $110,000 level, where there is a peak and there is a decrease in put volume after this level. However, it is seen that 2.93K call option contracts peaked at the $120,000 level. When we look at the options market, we see that put contracts are dominant on a daily and weekly basis.
Option Maturity:
Put/Call Ratio and Maximum Pain Point: In the last 7 days of data from Laevitas, the number of call options decreased by about 2% compared to last week to 122.93K. In contrast, the number of put options was 101.18K, up 16% from last week. The put/call ratio for options was set at 0.74. This indicates that call options are much more in demand among traders than put options. Bitcoin’s maximum pain point is seen at $116,000. It can be predicted that BTC is priced at $114,700 and if it does not break the pain point of $116,000 upwards, the declines will continue. Looking ahead, there are 3.73K call and 2.87K put options at the time of writing
Ethereum Options Distribution
Source: Laevitas
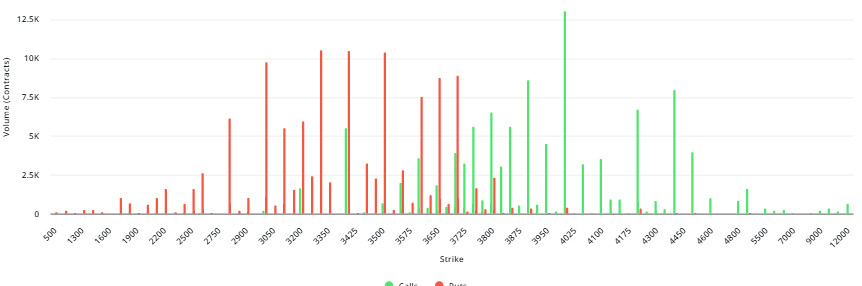
ETH: $1.35B notional | Put/Call: 0.97 | Max Pain: $3,500
Laevitas Data: Looking at the data on the chart, we see that put options are particularly concentrated at the price levels between $3,300 and $3,500. The highest put volume is at $3,400 with around 10.5K contracts and this level can be considered as a possible support zone. On the other hand, call options are concentrated between $4,000 and $4,200. Especially the $4,025 level stands out with a high call volume of about 13K contracts. This level can be considered as an important resistance zone in the market.
Deribit Data: On August 2, we see that the interest in options on August 2 has increased tremendously. In just one day, about 125 million dollars of new positions were opened in this maturity and the total open interest reached 153 million dollars. This is a very high increase of 441% on a daily basis. Such a strong surge shows that a significant amount of new money has entered the market and that interest in Ethereum options has increased significantly. The volume of put options is higher than that of call options. For the August 2 expiration, the put volume is around $88 million, while the call volume is around $61 million. We can say that this shows that market actors are buying downward price movements in the short term. There is also a significant increase in volatility. The expected volatility rate increased by 14.85% to 70.71. This shows that sharp price movements are expected in the market. In general, both volatility expectations have increased and a significant amount of new positions have been opened. So investors are currently expecting a sharp move in Ethereum.
Option Expiry
Ethereum options with a nominal value of $1.35 billion expire on August 1. The Max Pain level is calculated at $3,500, while the put/call ratio is 0.97.
Legal Notice
The investment information, comments and recommendations contained in this document do not constitute investment advisory services. Investment advisory services are provided by authorized institutions on a personal basis, taking into account the risk and return preferences of individuals. The comments and recommendations contained in this document are of a general type. These recommendations may not be suitable for your financial situation and risk and return preferences. Therefore, making an investment decision based solely on the information contained in this document may not result in results that are in line with your expectations.