Haftalık Ethereum Onchain Raporu
Aktif Adresler
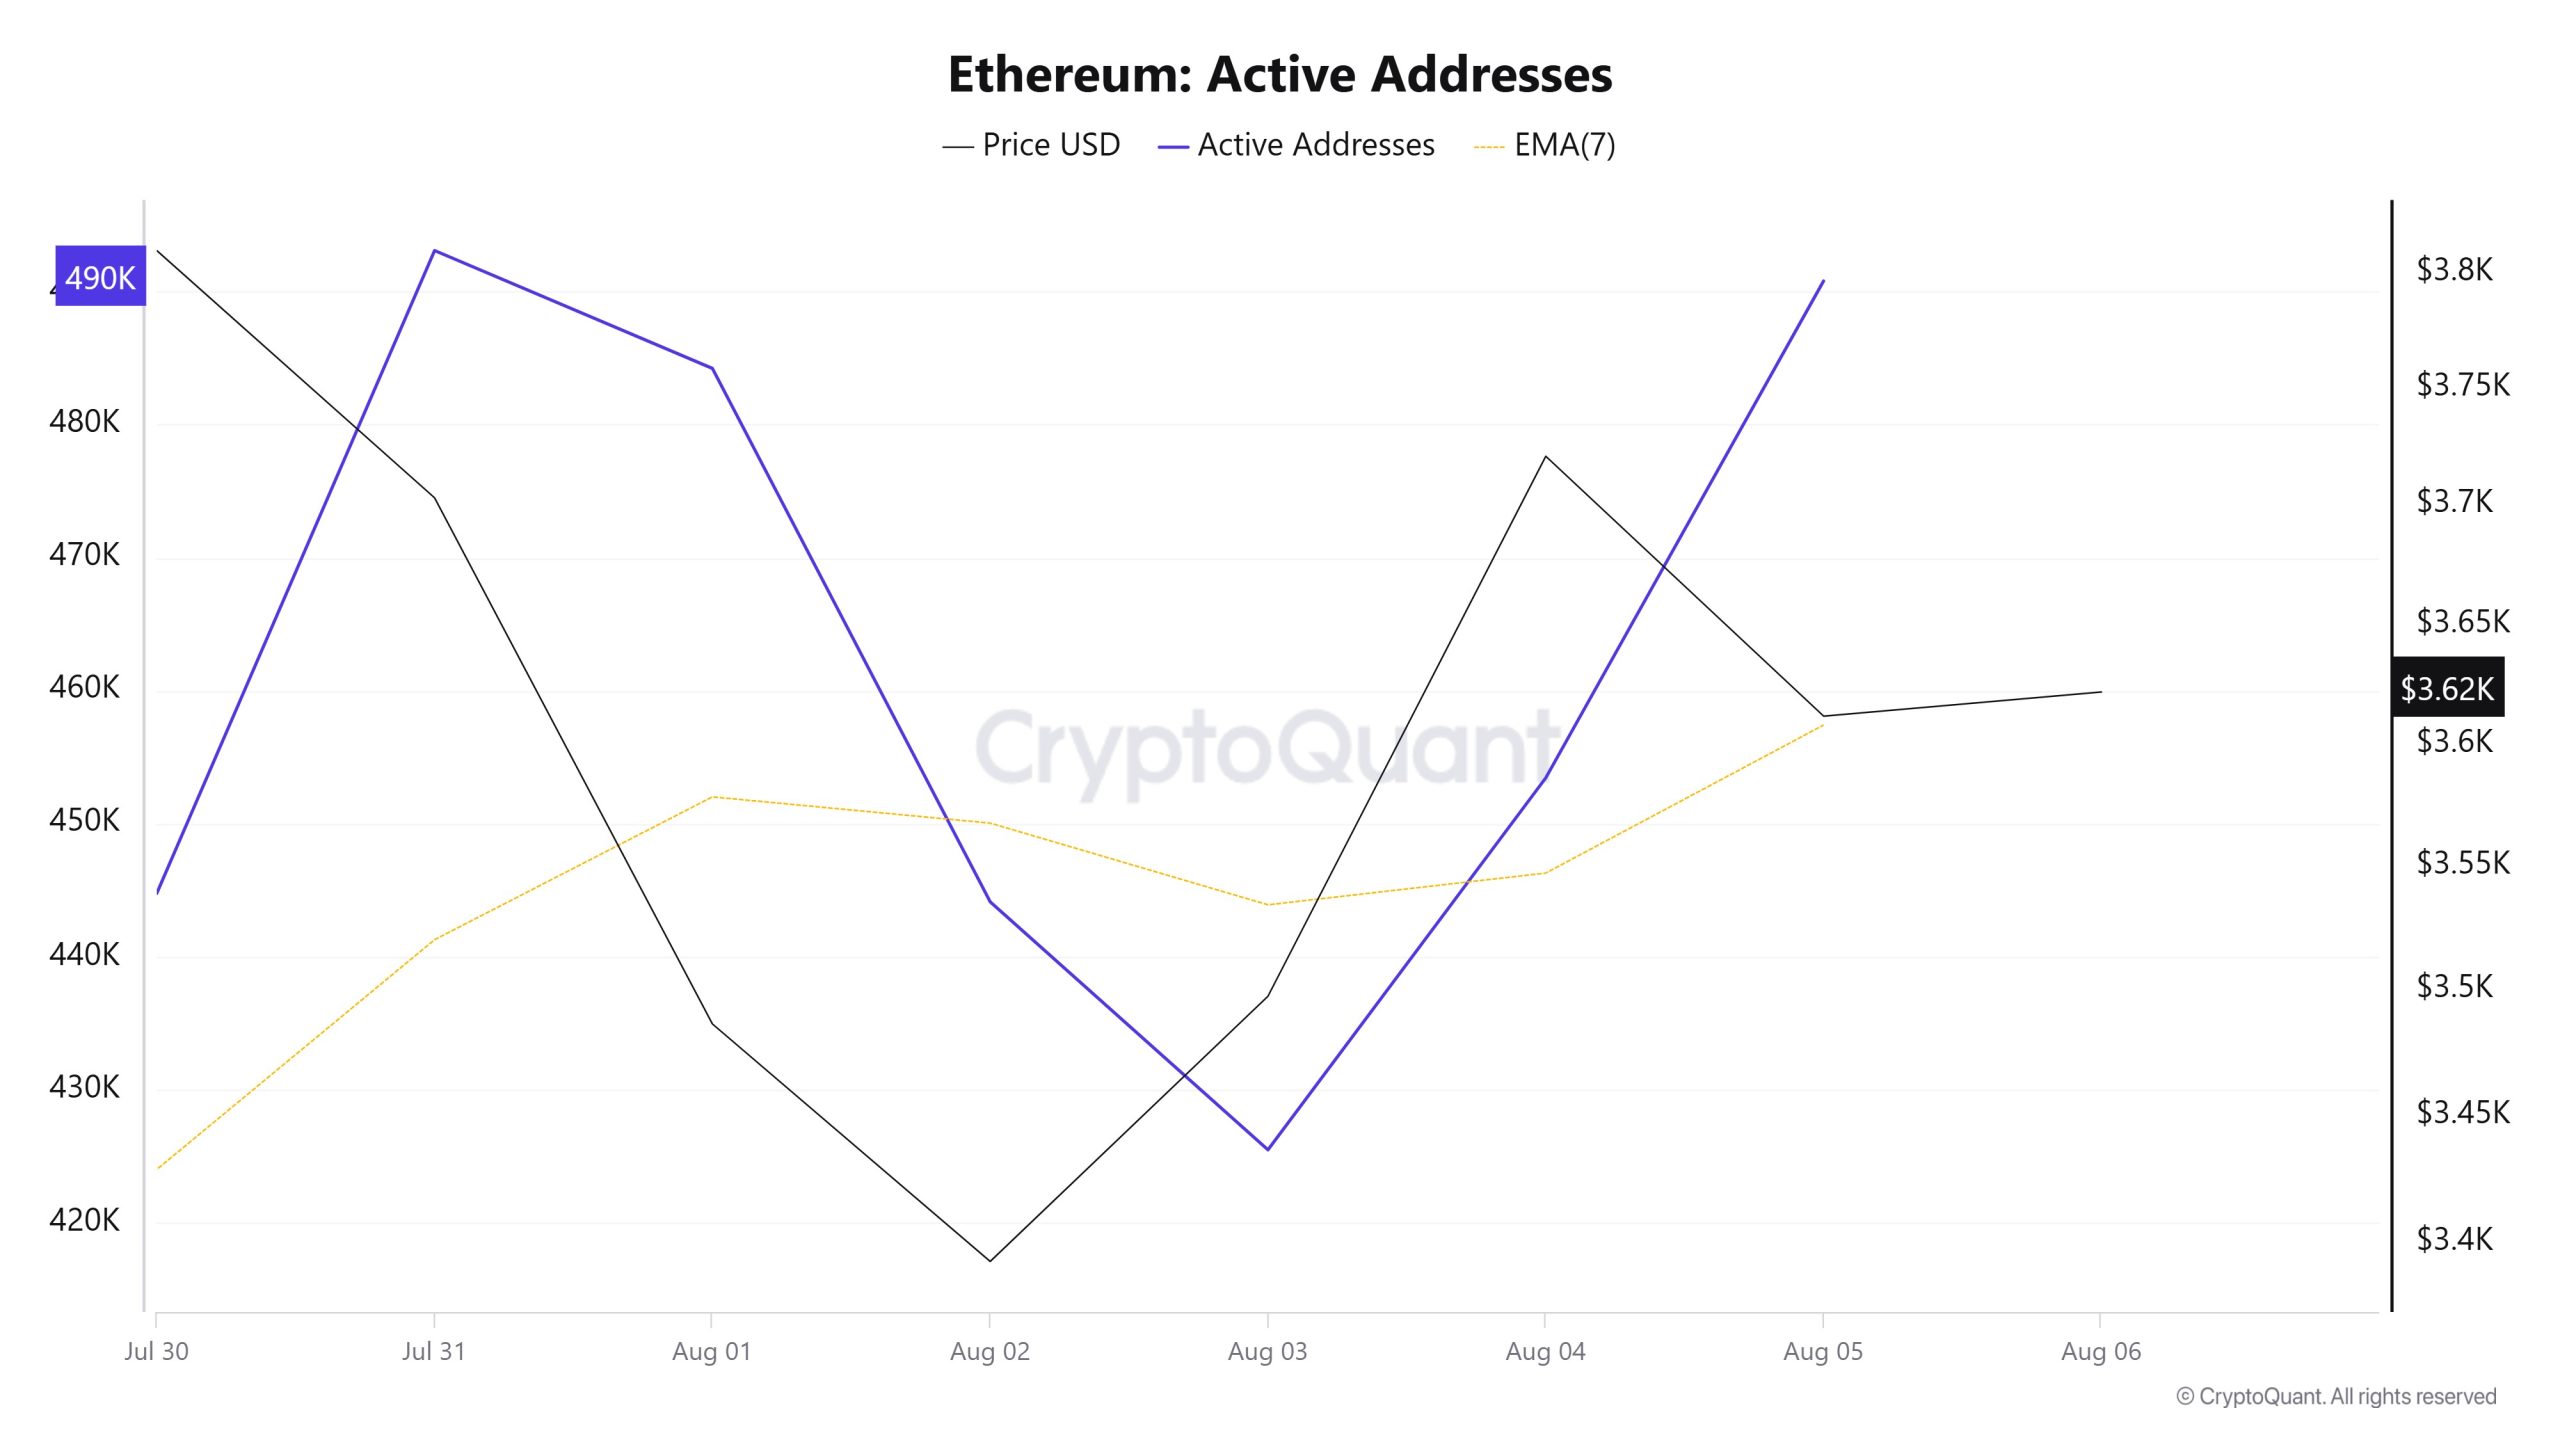
30 Temmuz ve 6 Ağustos tarihleri arasında Ethereum ağına toplam 493.077 aktif adres girmiştir. Bu süre zarfında Ethereum fiyatı 3.497 dolardan 3.703 dolara yükseldi. Özellikle 31 Temmuz'da fiyat ve aktif adres sayısının kesiştiği noktada, fiyat yükselmeye devam ederken aktif adres sayısında önemli bir düşüş yaşandı. Bu durum, ilerleyen günlerde fiyat artışına rağmen kısa vadeli katılımın azaldığını ve muhtemelen mevcut yatırımcılar arasındaki trades baskın olduğunu göstermektedir. 7 günlük basit hareketli ortalama (SMA) incelendiğinde Ethereum fiyatında genel bir yükseliş eğiliminin hakim olduğu görülüyor.
Aktif Gönderme Adresleri
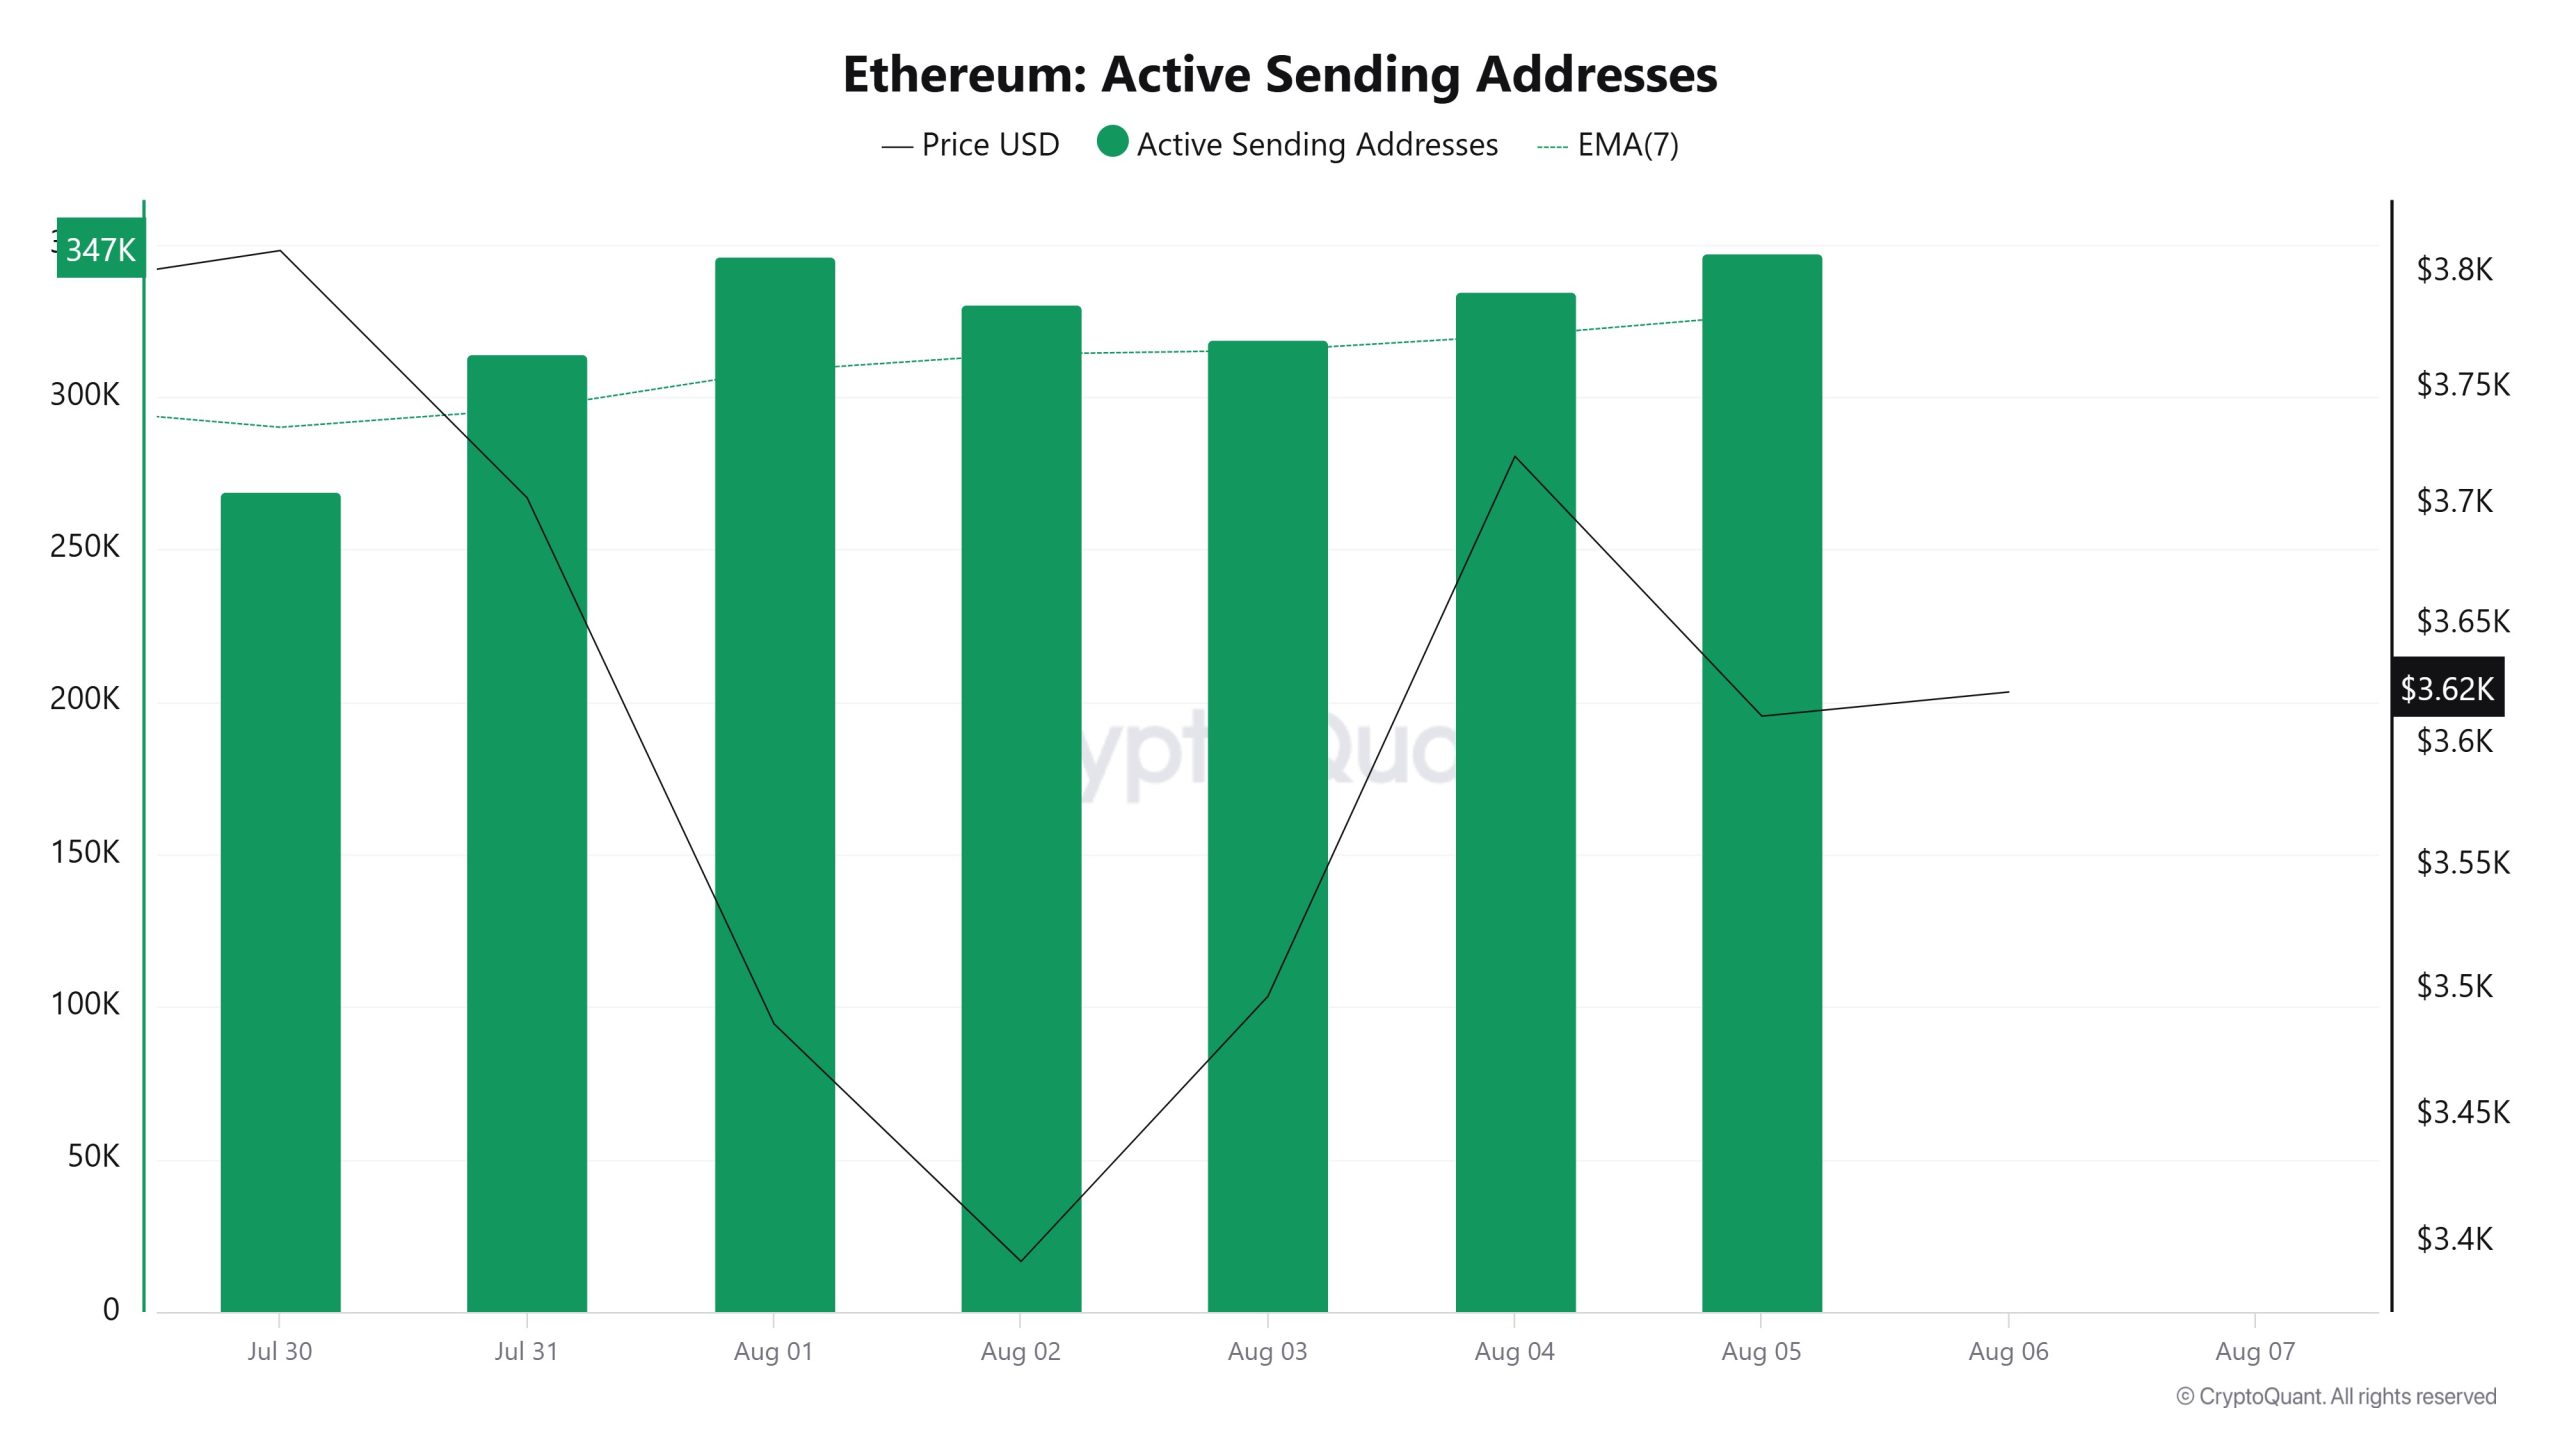
30 Temmuz ve 6 Ağustos tarihleri arasında aktif gönderim adreslerinde Siyah Çizgi (fiyat çizgisi) ile yukarı yönlü bir hareket yaşandı. Fiyatın haftanın en yüksek seviyesine ulaştığı gün, aktif gönderim adresleri 346.230'a yükseldi.
Aktif Alıcı Adresleri
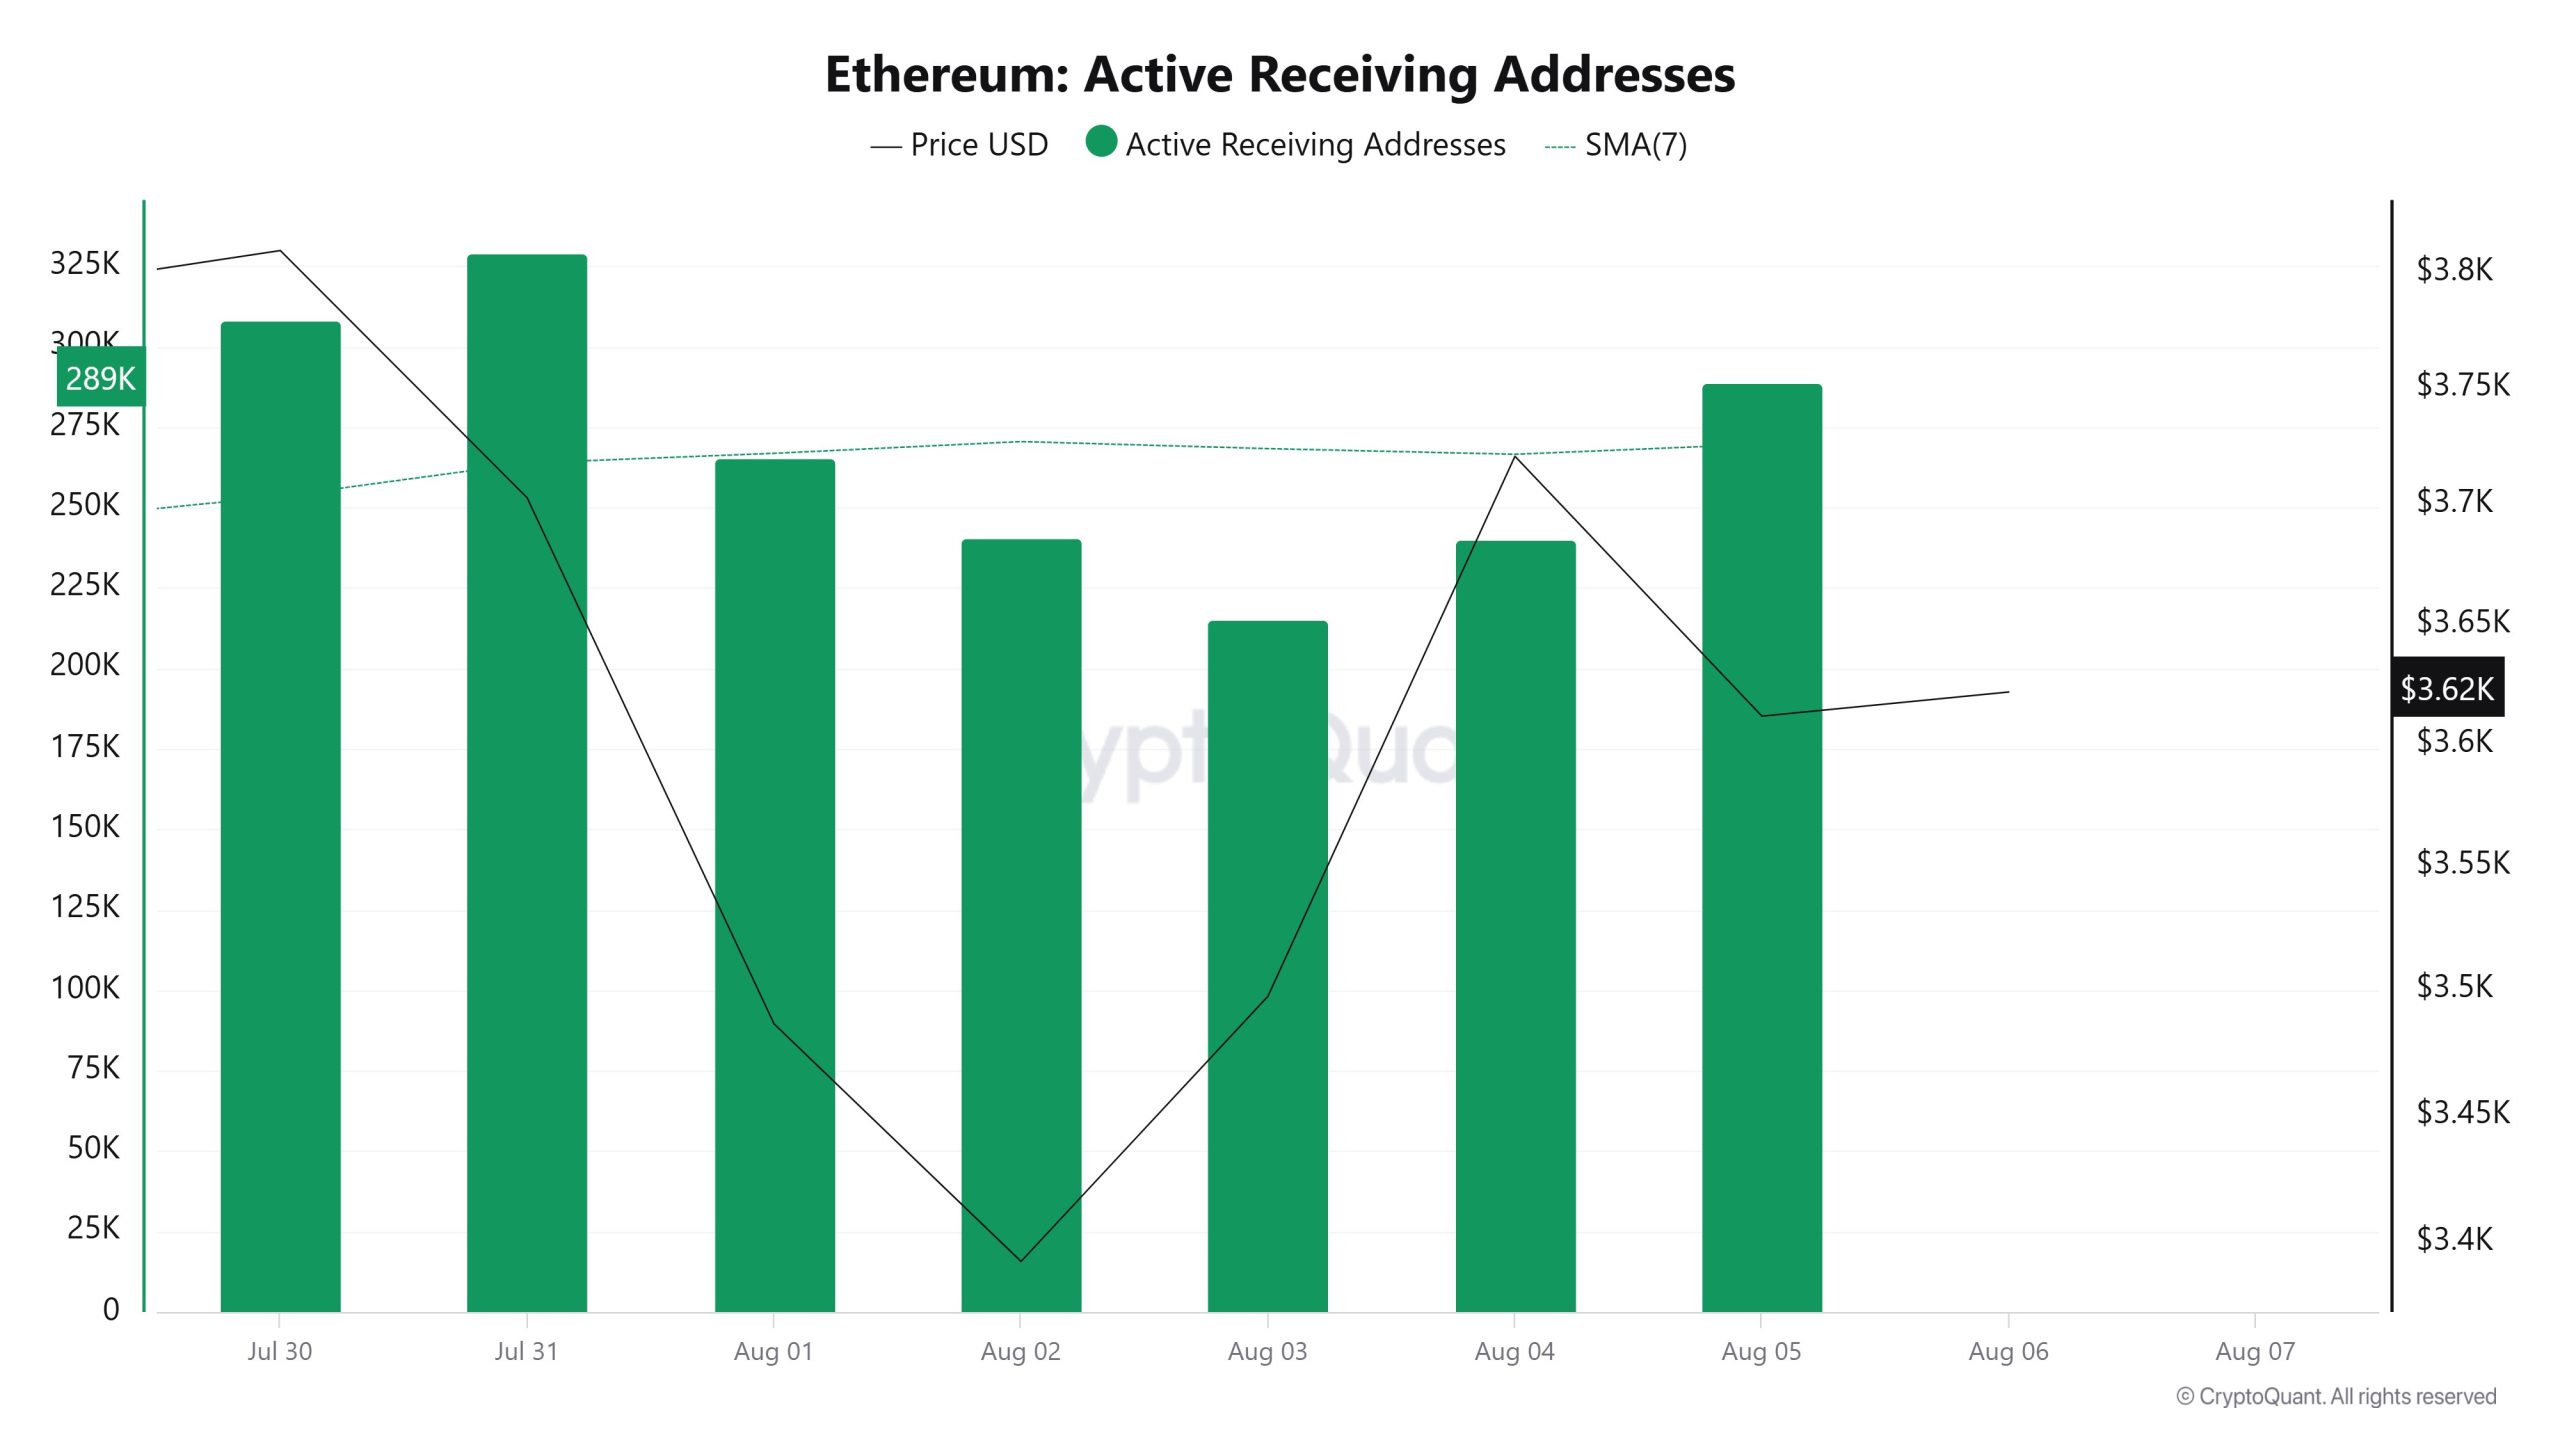
30 Temmuz ve 6 Ağustos tarihleri arasında aktif alım adreslerinde yukarı yönlü bir konsolidasyon ve buna paralel olarak fiyatta da yukarı yönlü bir konsolidasyon yaşandı. Fiyatın en yüksek olduğu gün, aktif alım adresleri 229.093'e düşerek alımların yavaşladığını gösterdi.
Toplam Bahis Değeri
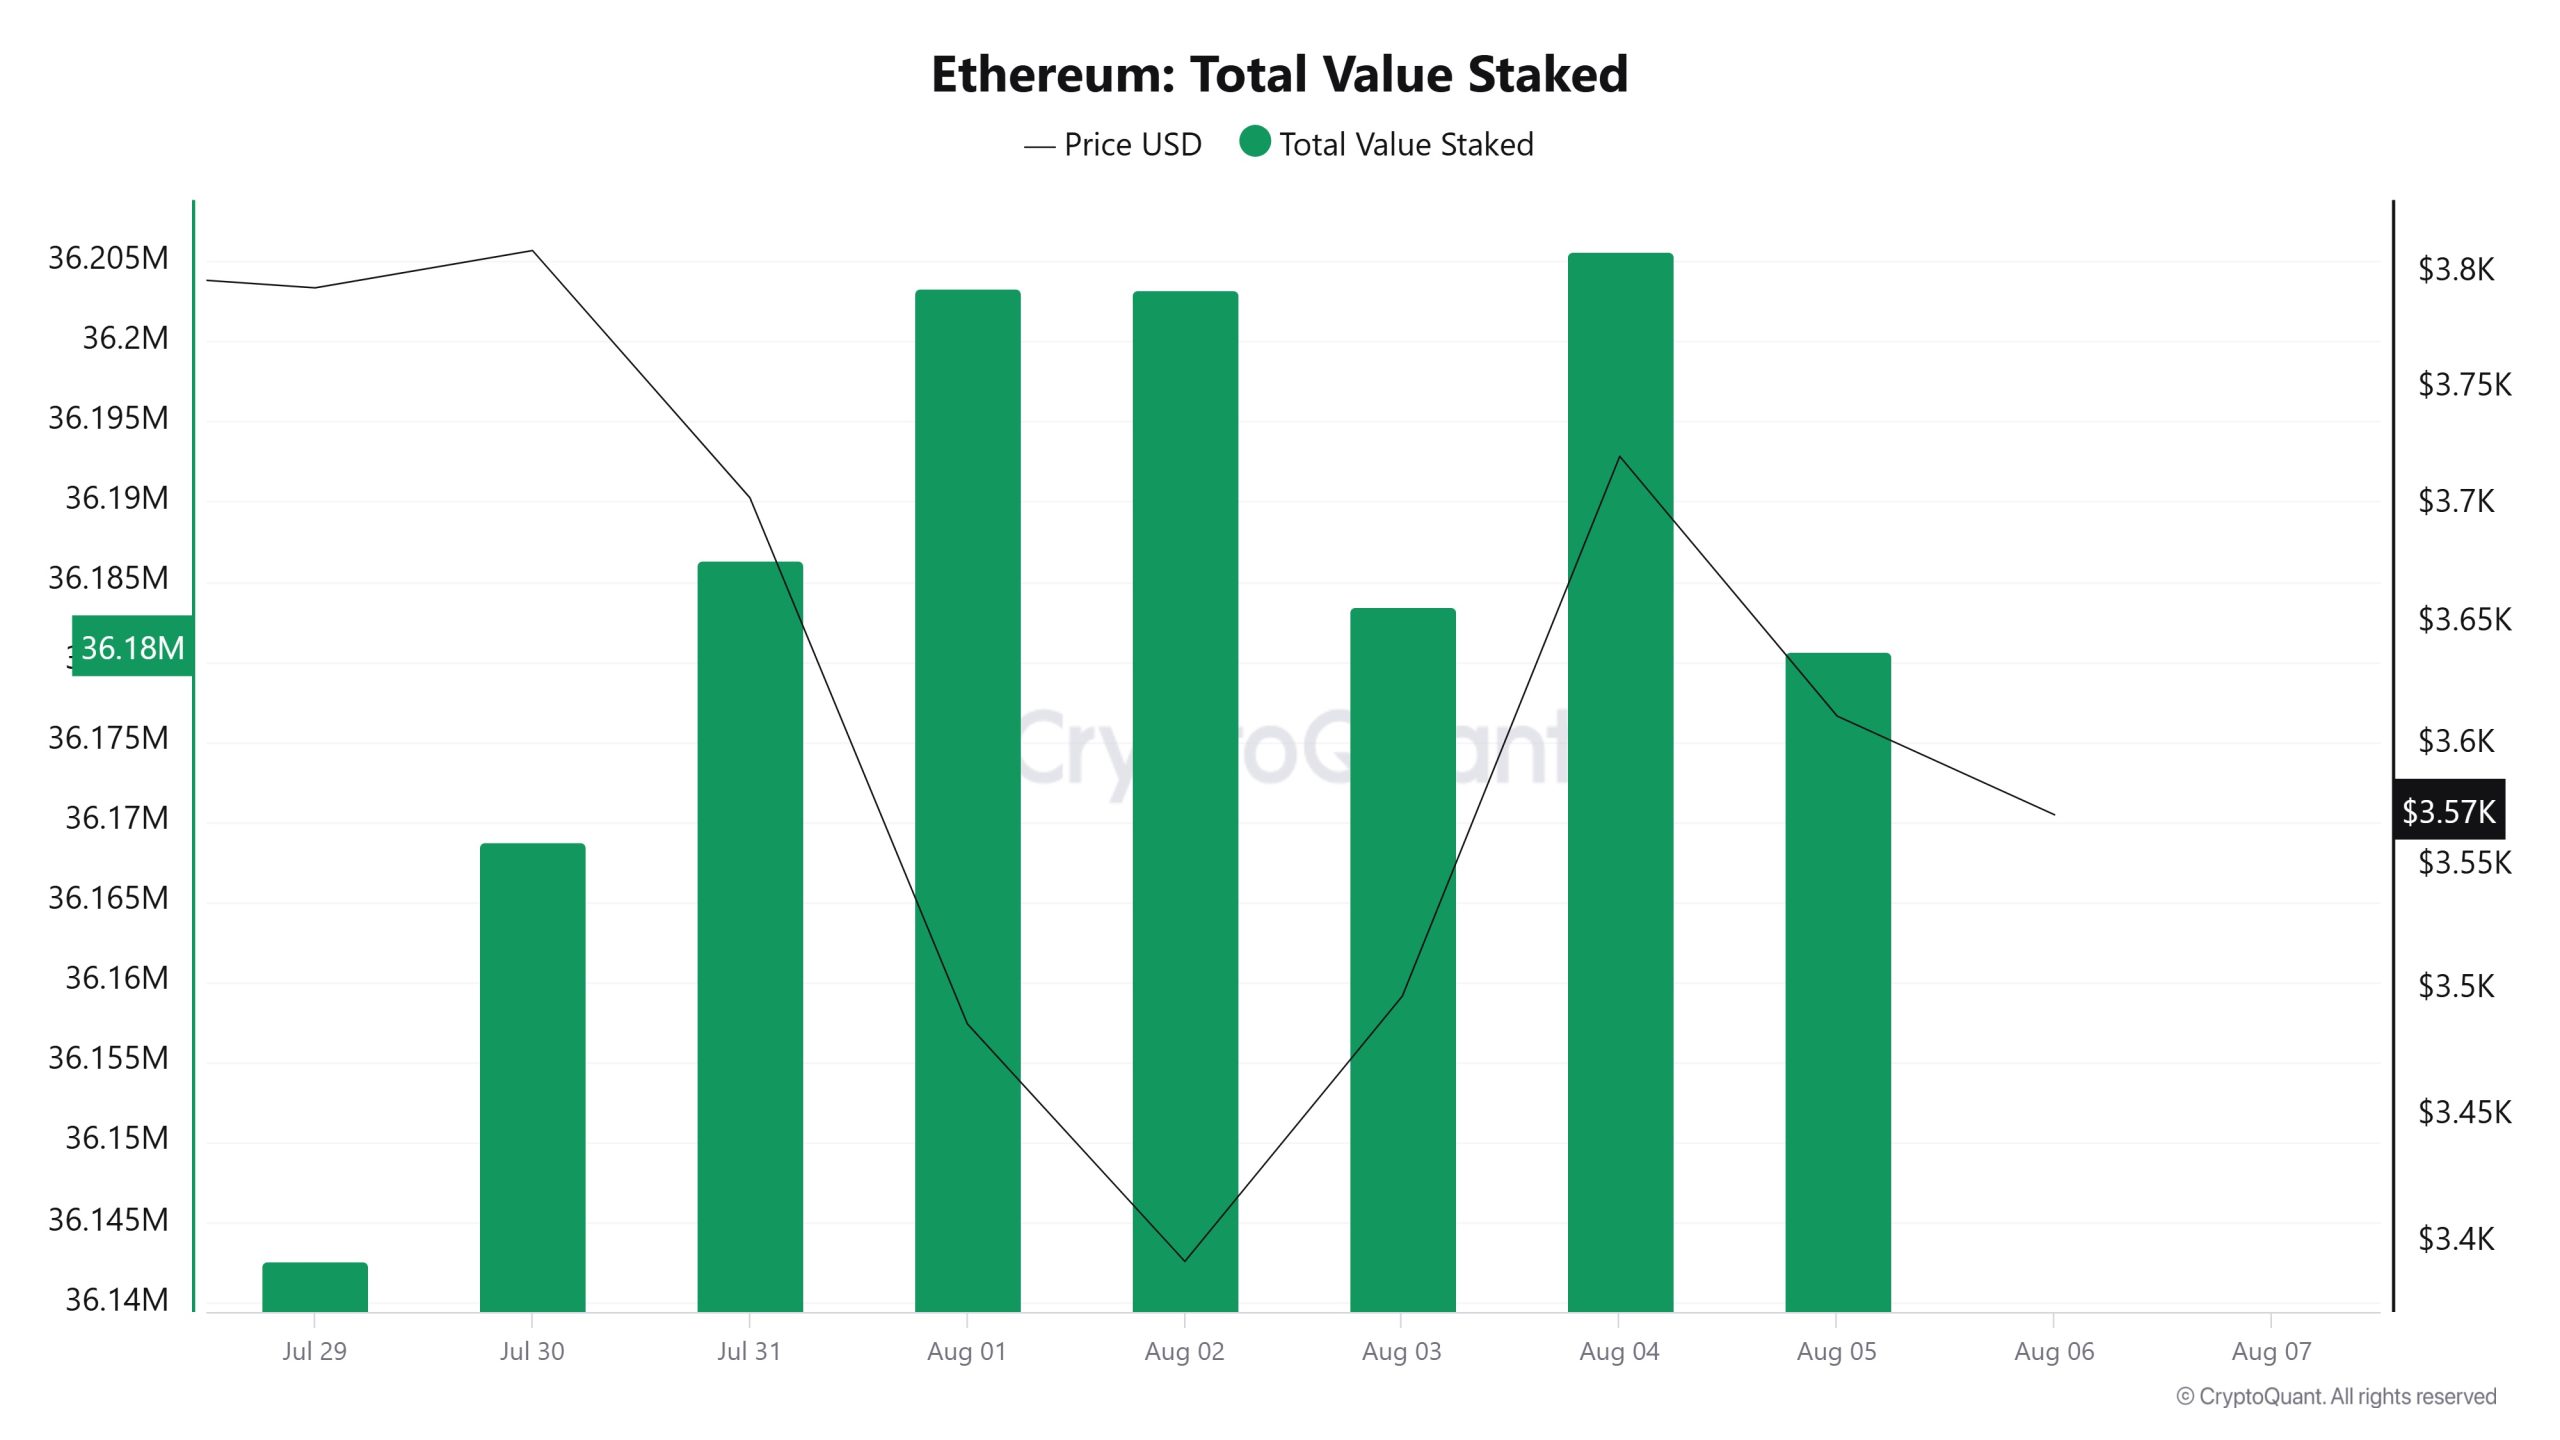
30 Temmuz'da ETH fiyatı 3.809 iken Toplam Staked Değeri 36.168.745 idi. 5 Ağustos itibariyle ETH fiyatı %5,20'lik bir düşüşle 3.611'e gerilerken, Toplam Staked Değeri %0,03'lük bir artışla 36.180.645'e yükseldi.
Staking Girişleri
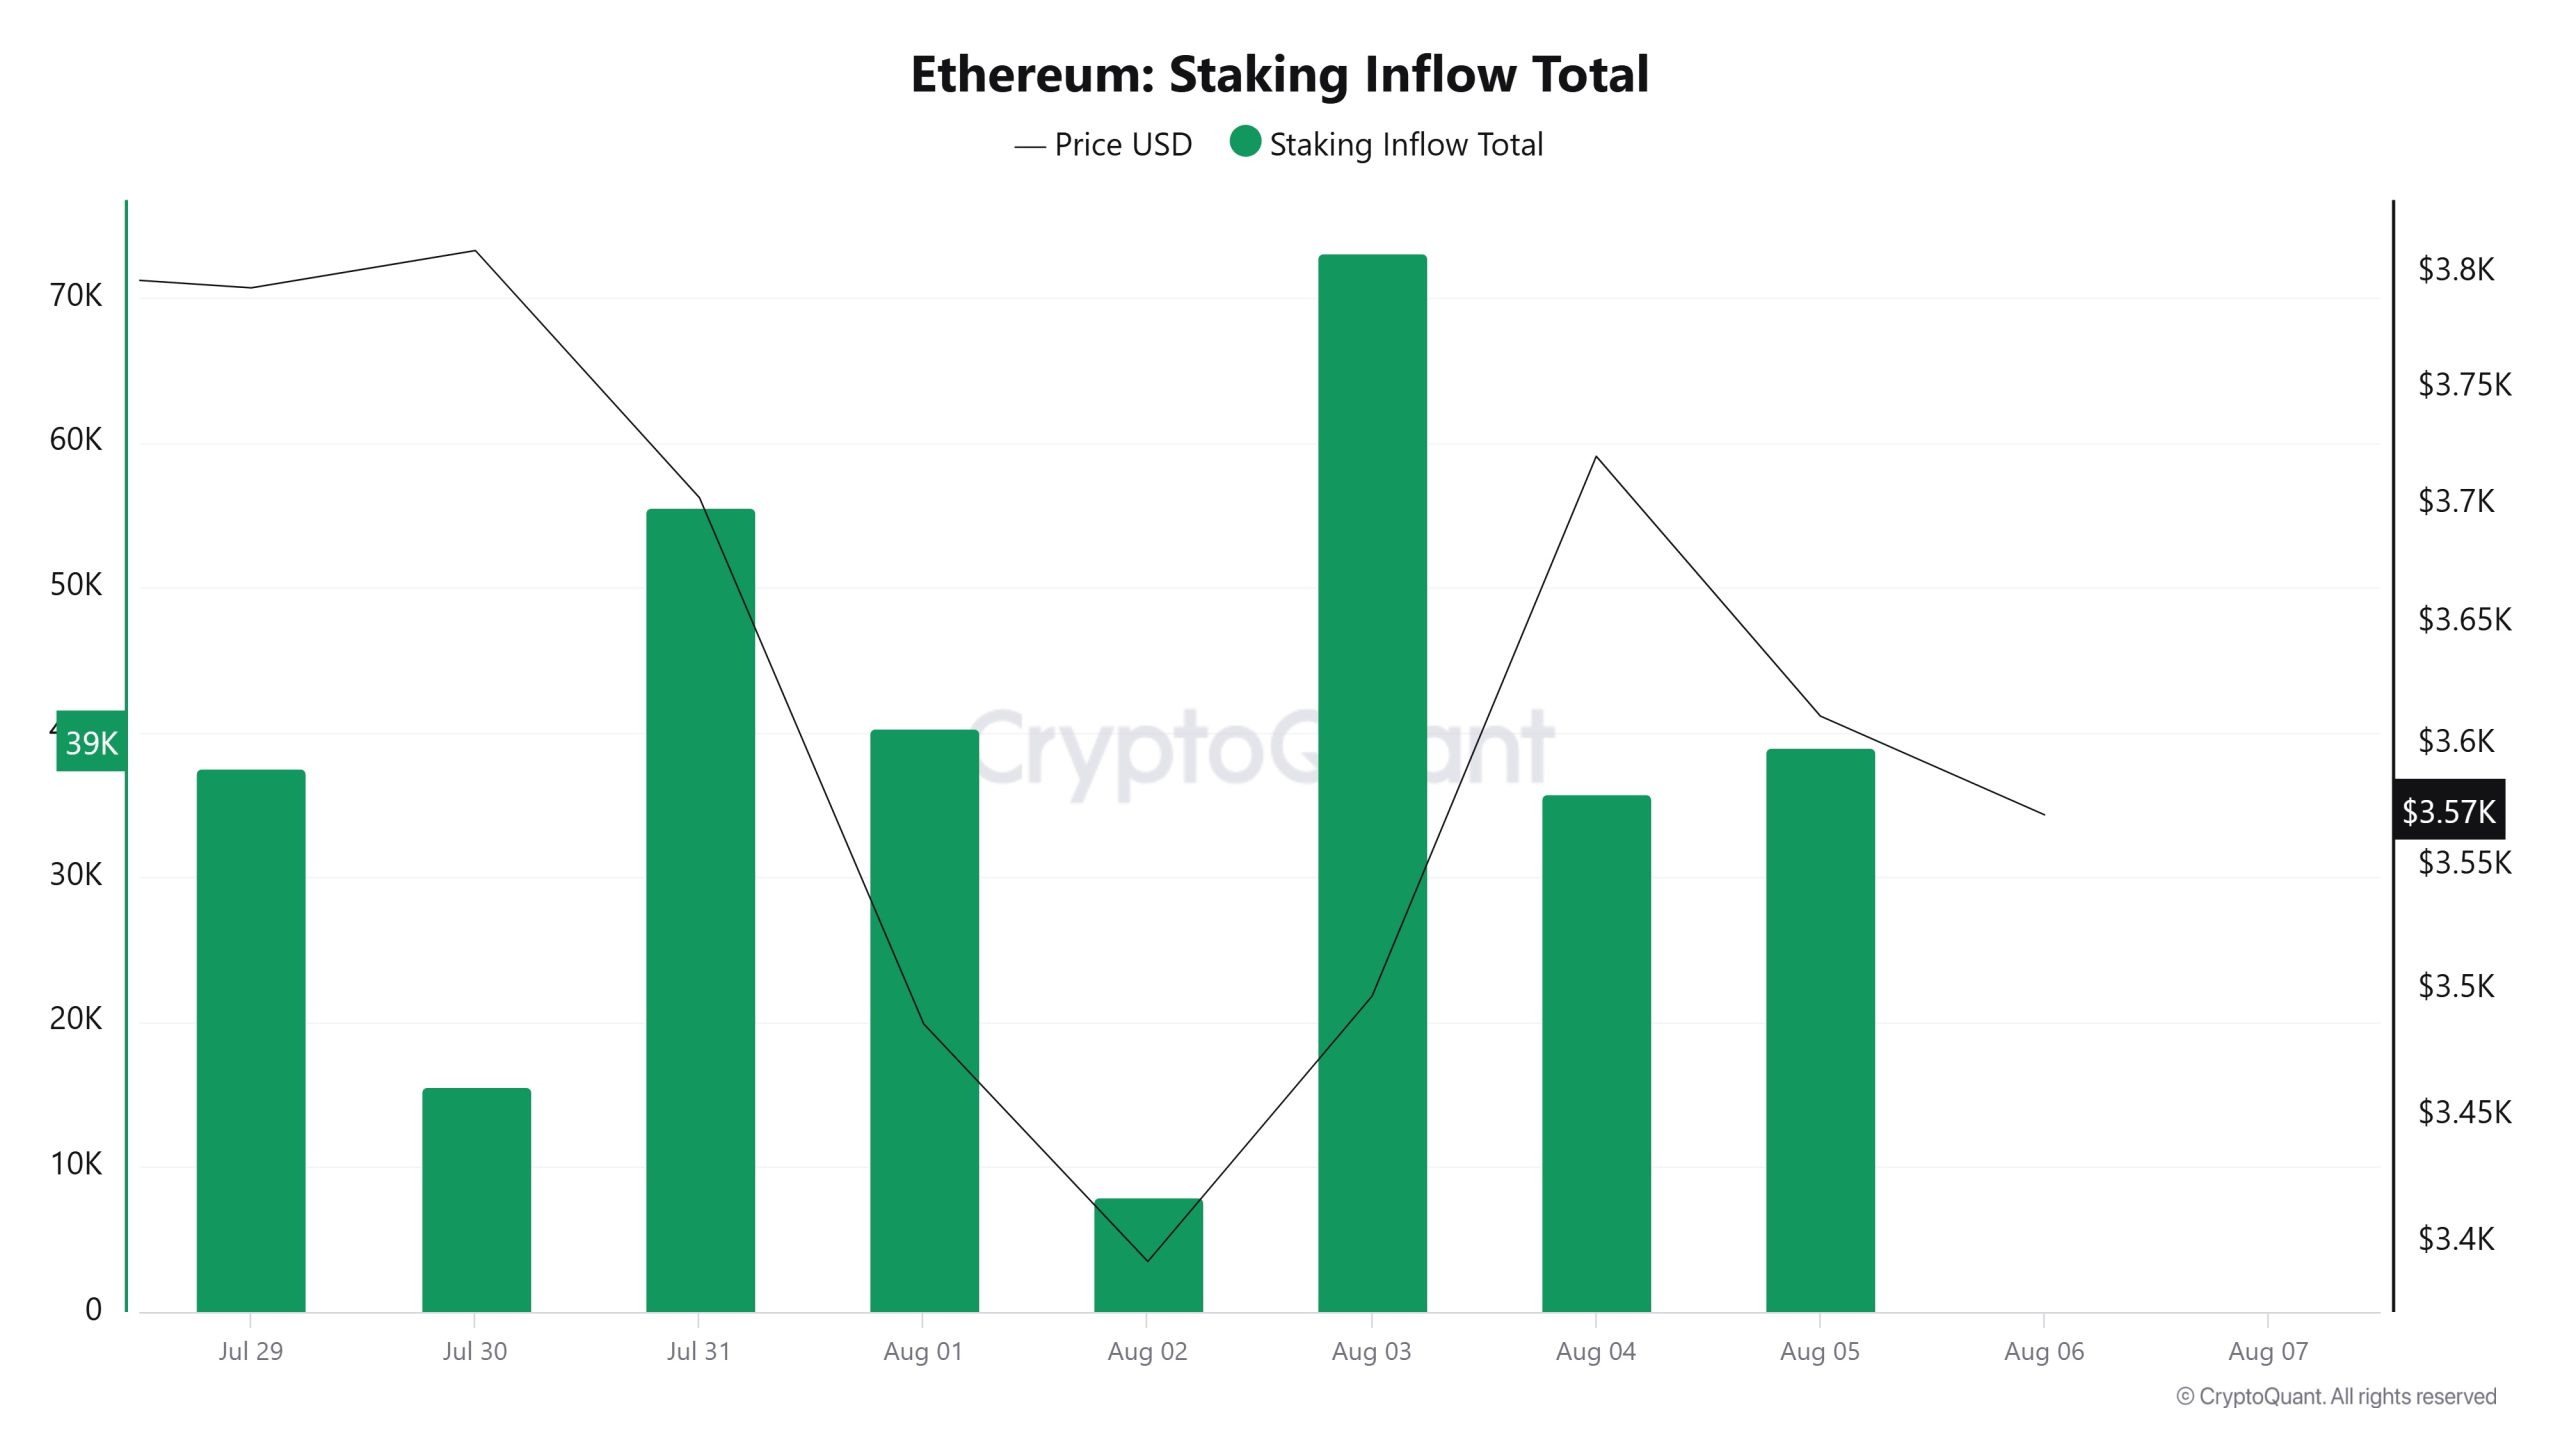
30 Temmuz'da ETH fiyatı 3.809 seviyesindeyken, Staking Girişi 15.532 seviyesindeydi. 5 Ağustos itibarıyla ETH fiyatı %5,20 düşüşle 3.611'e gerilerken, Staking Inflow %151,38 artışla 39.030'a yükseldi.
Türevler
Açık Faiz
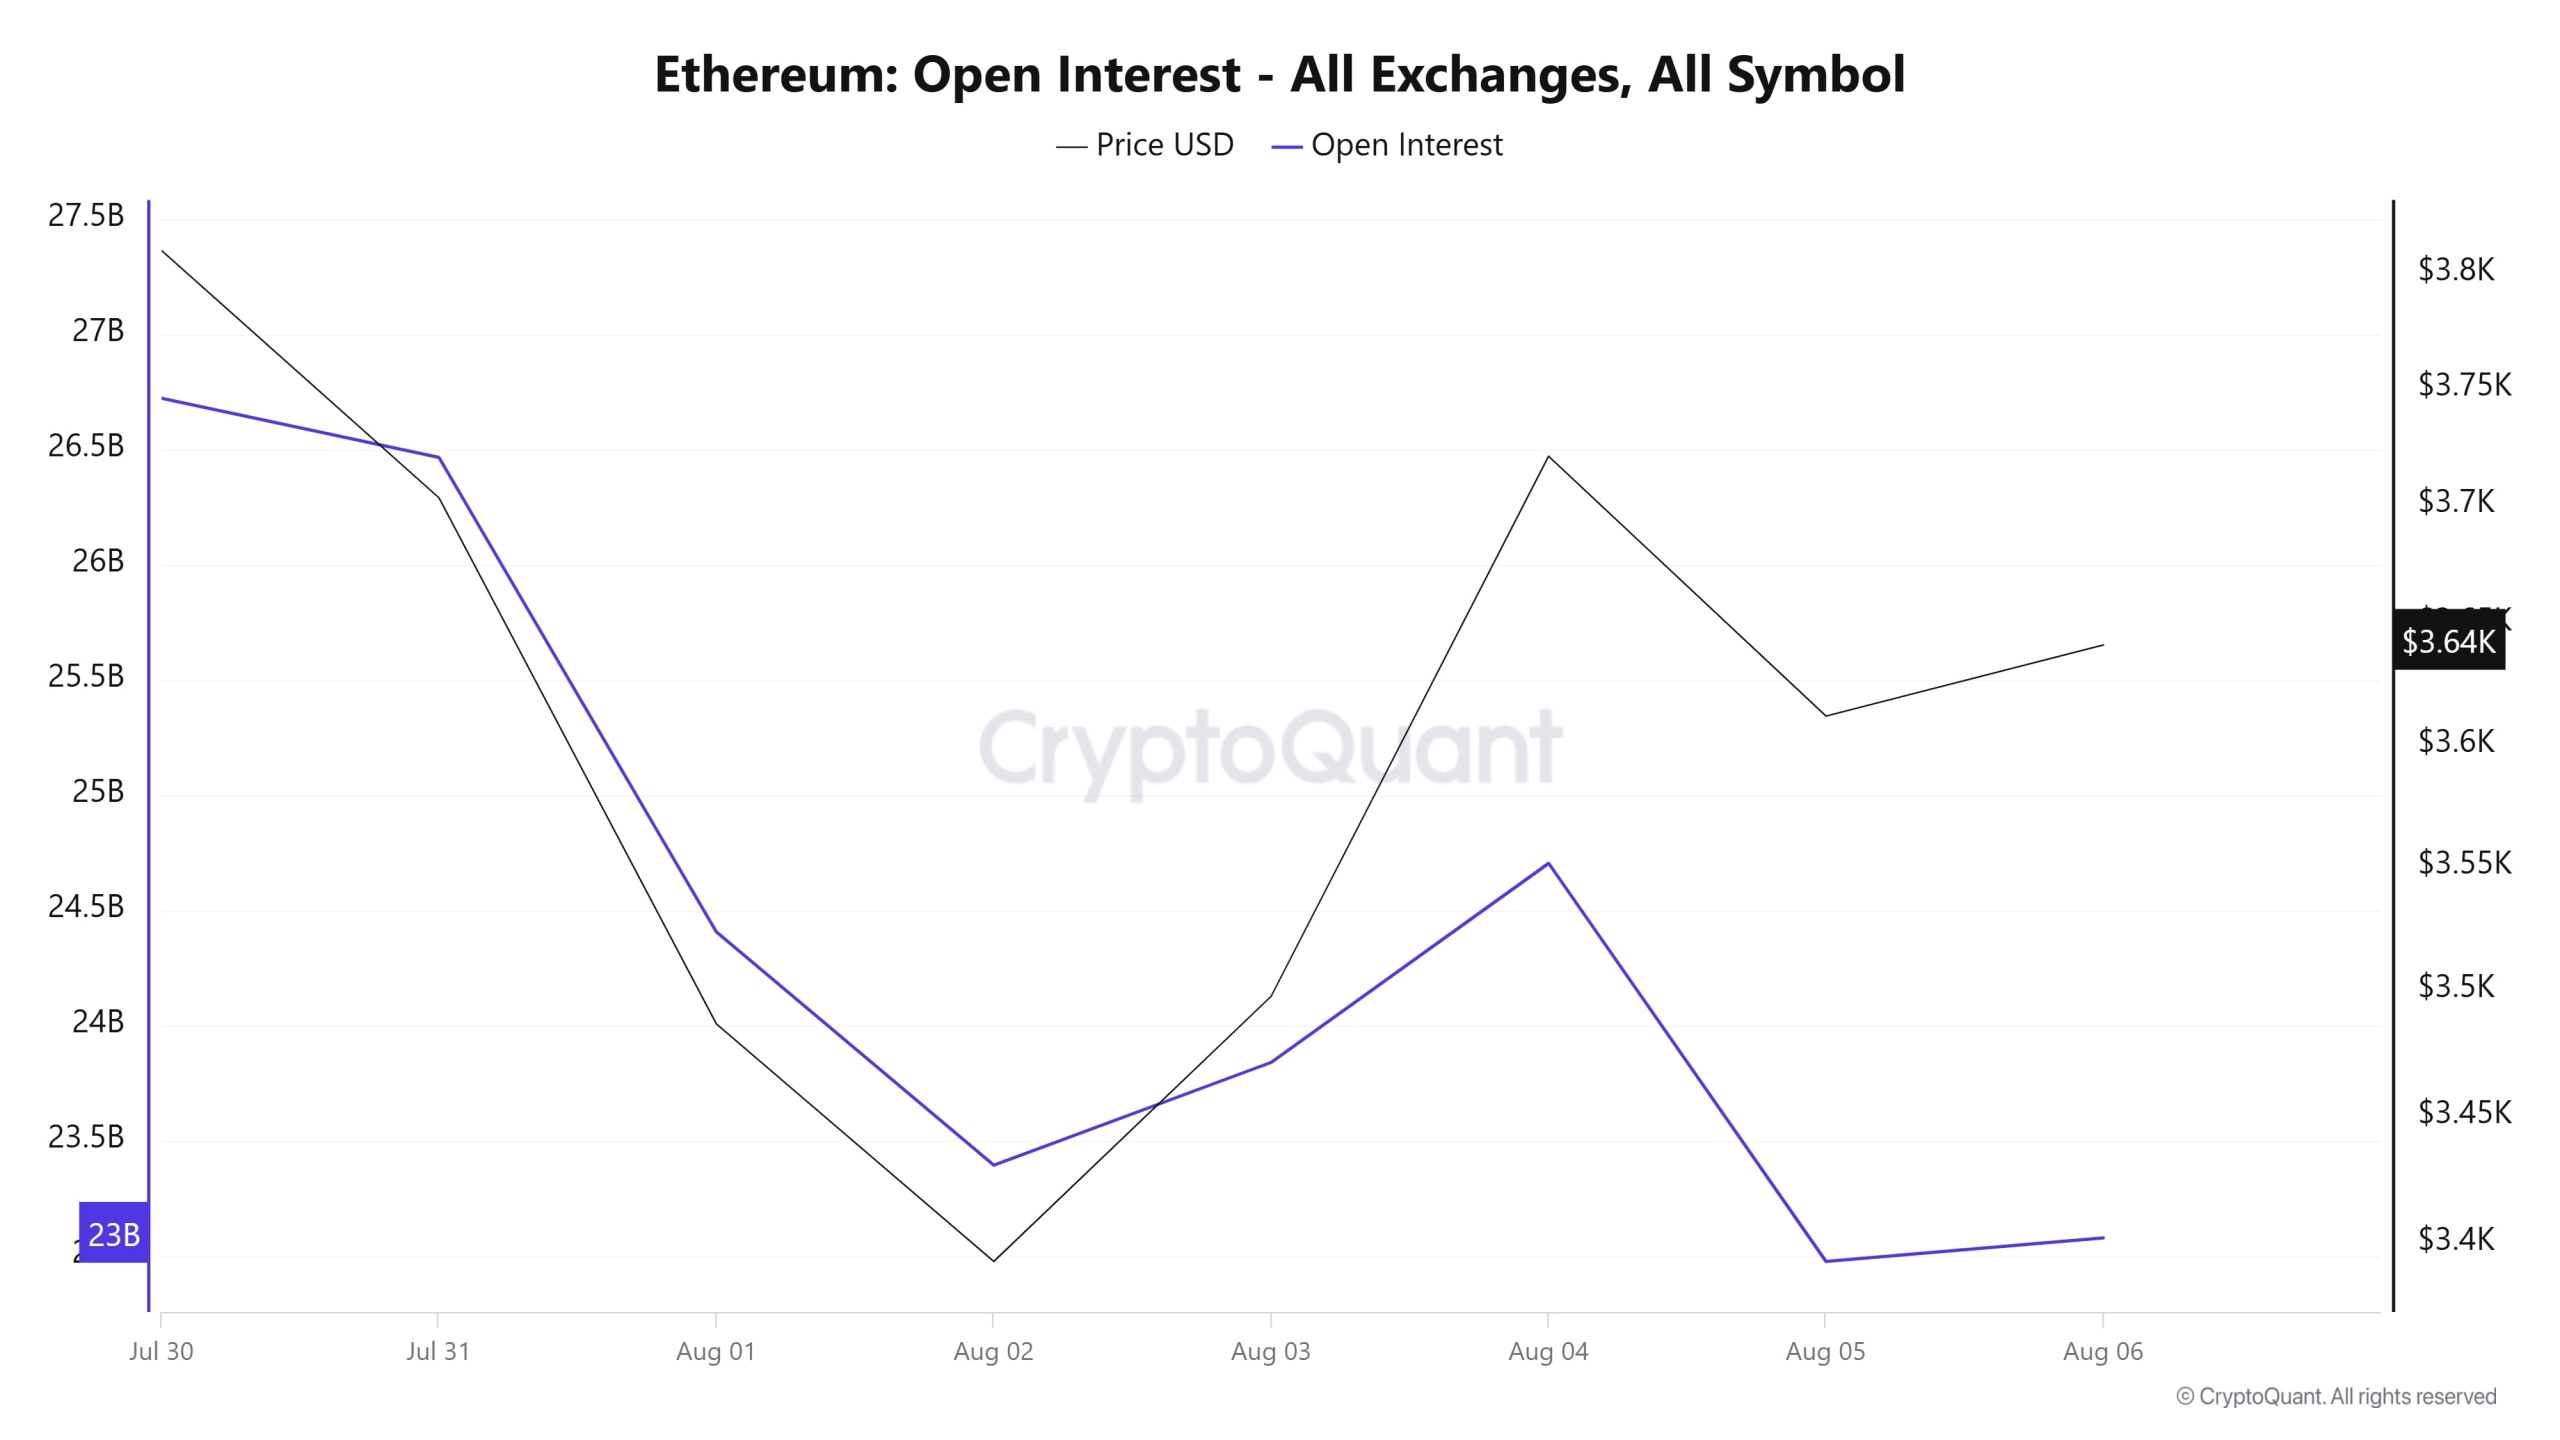
Temmuz ayı sonunda 26,7 milyar dolar civarında olan açık pozisyonlar Ağustos ayının ilk günlerinde keskin bir düşüşle 23 milyar dolara geriledi. Aynı dönemde fiyat da benzer şekilde düşerek piyasada genel bir geri çekilme ya da temkinli davranışa işaret etti. 2 Ağustos'ta hem fiyat hem de açık piyasa faizinin en düşük seviyelerine inmesinin ardından bir toparlanma başladı. 3 ve 4 Ağustos'ta fiyattaki yükseliş daha belirgin hale gelirken, açık pozisyonlar da buna eşlik etti, ancak daha sınırlı bir ivmeyle. 5 Ağustos itibarıyla açık pozisyon tekrar düşmeye başlar ve yatay bir seviyeye yerleşir. Fiyat da benzer şekilde, 6 Ağustos'ta hafifçe toparlanmadan önce o gün keskin bir şekilde geriledi. Genel olarak, bu grafik kısa vadede hem yatırımcı ilgisinin hem de fiyat hareketlerinin dalgalı olduğunu ve piyasanın kararsız ve temkinli kaldığını göstermektedir. Bu dönemde açık pozisyonlar kalıcı olarak artamadığından piyasada güçlü bir yön beklentisi olmadığı anlaşılmaktadır.
3.2. Finansman Oranı
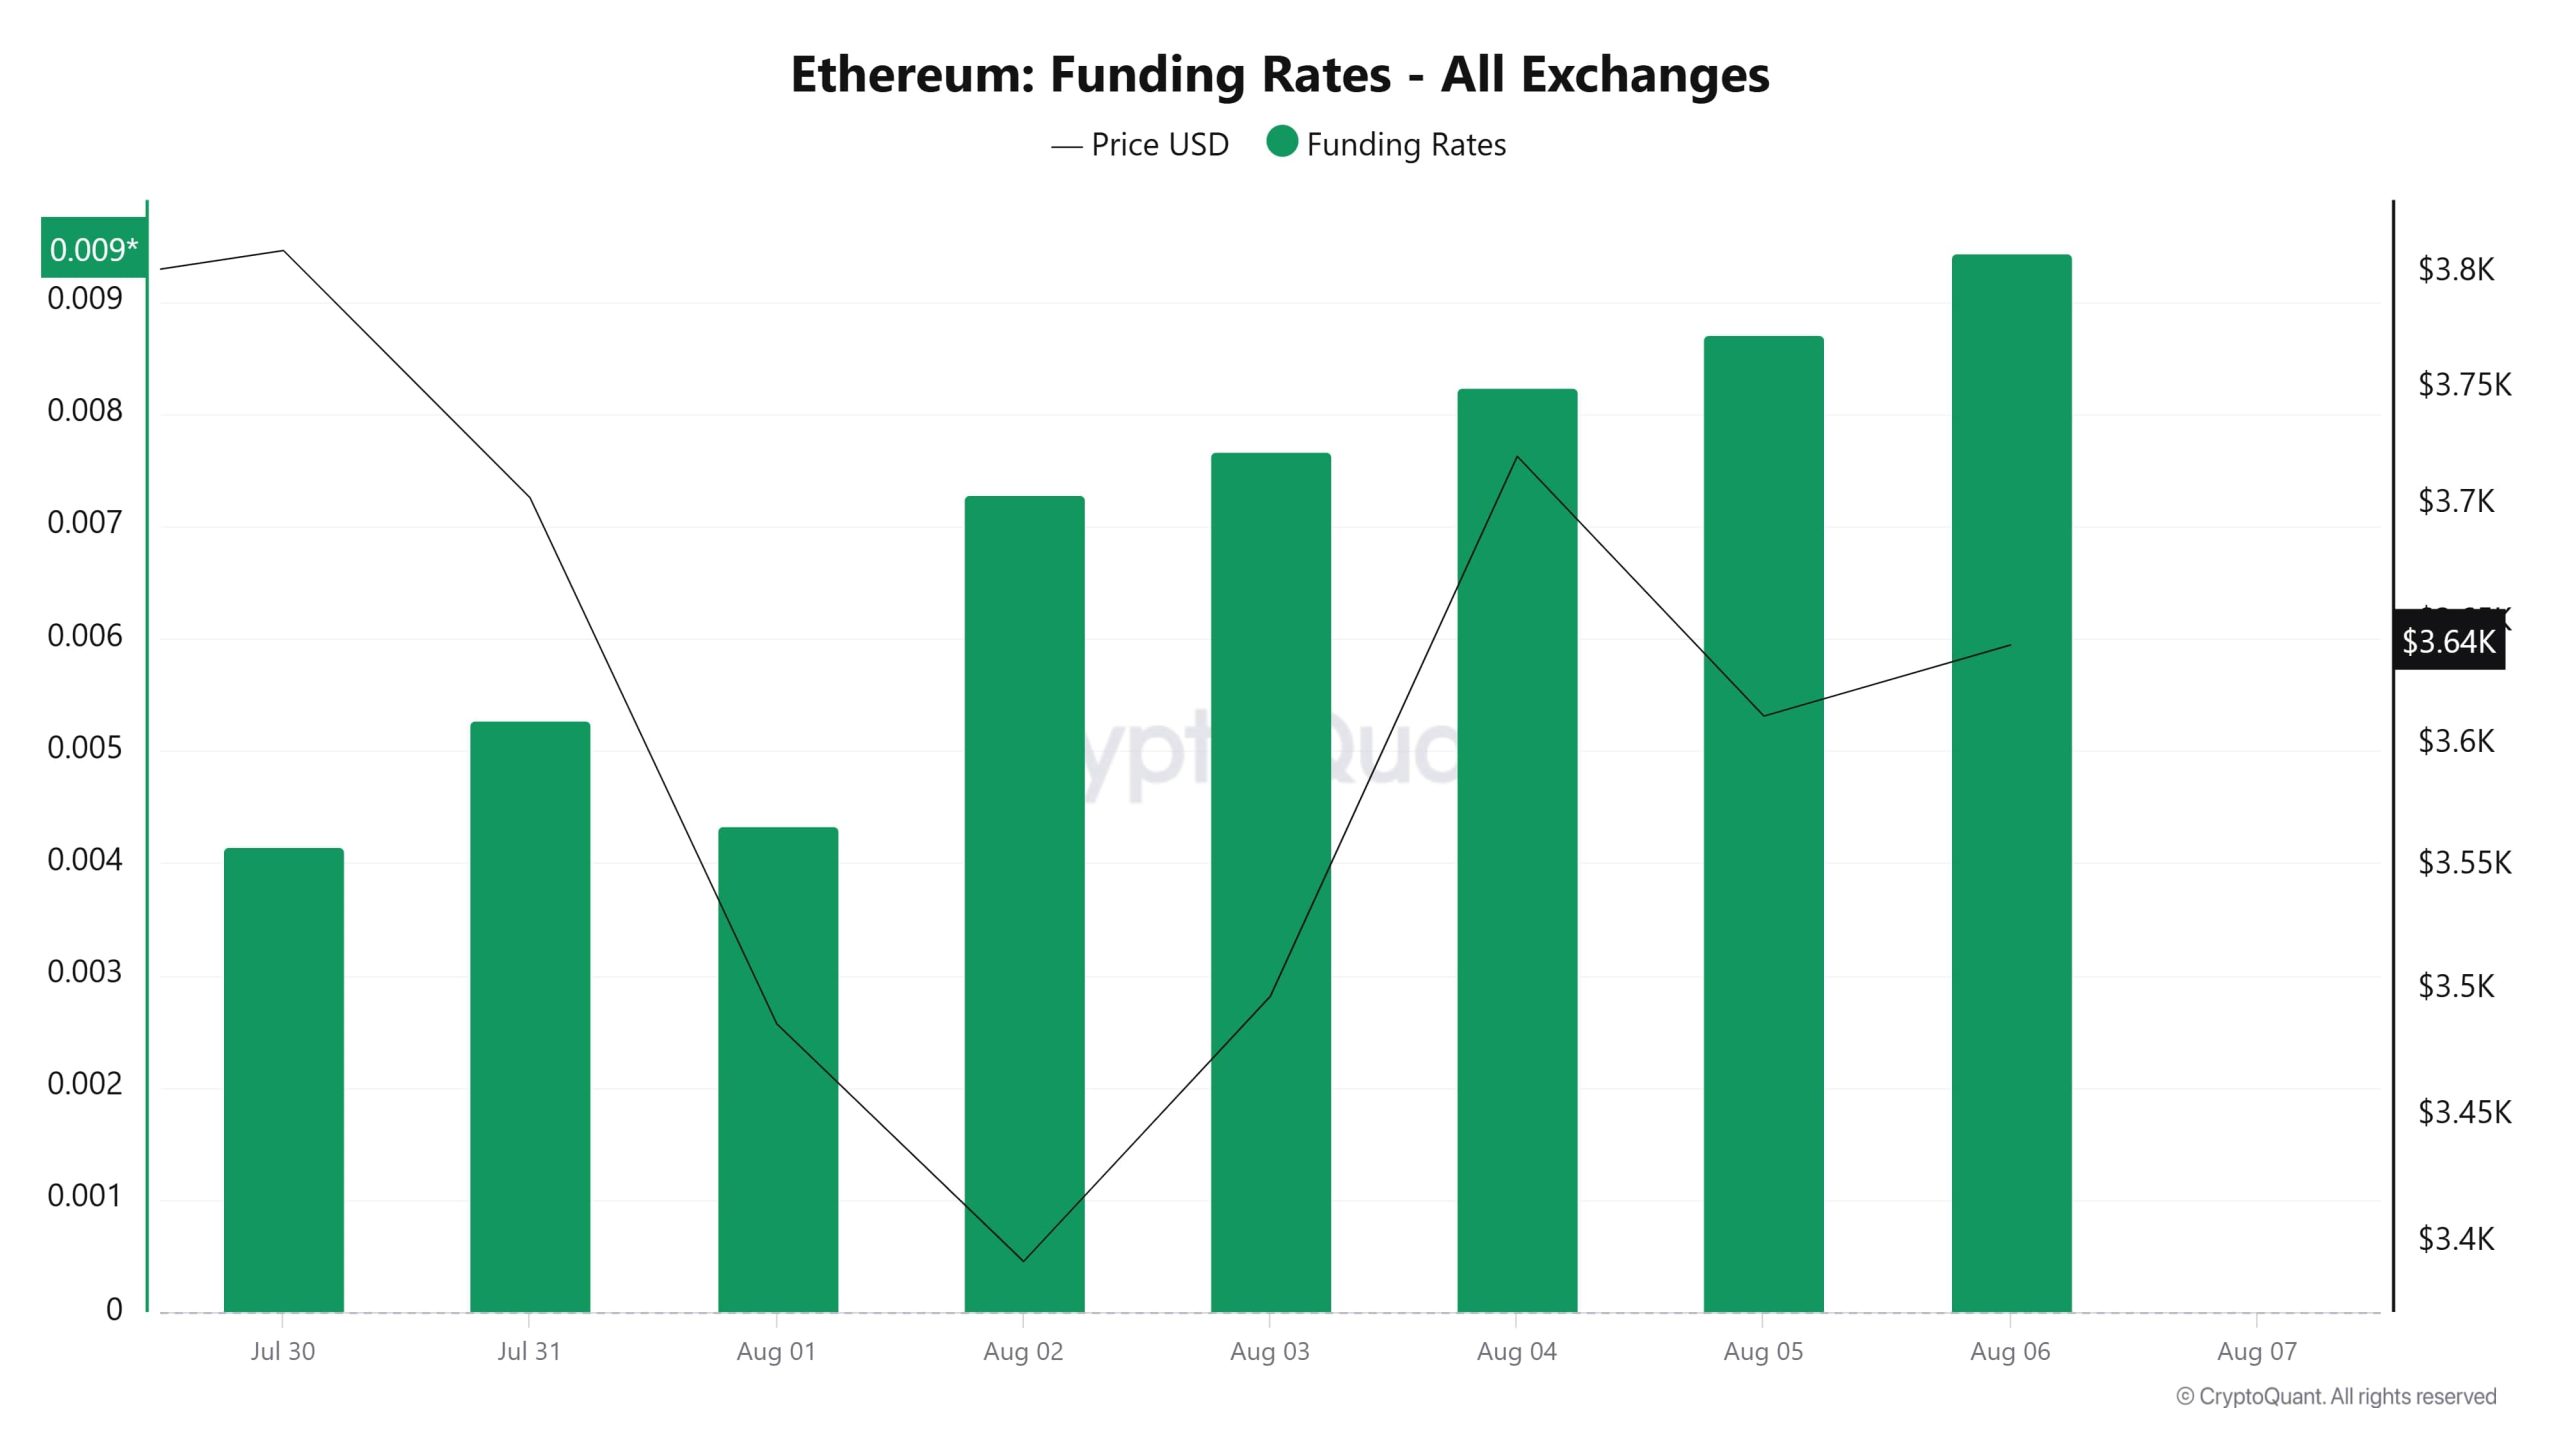
Grafiğe genel olarak bakıldığında Ethereum'un fonlama oranlarının 2 Ağustos'tan bu yana yükseliş eğiliminde olduğu görülüyor. Bu tarihten önce daha düşük seviyelerde olan oranlar bir anda yukarı yönlü hareket ederek 6 Ağustos itibariyle en yüksek seviyesine ulaştı. Bu da piyasada uzun pozisyonların ağırlık kazandığını ve yatırımcıların fiyatın yükselmesini beklediğini gösteriyor. Ancak ilginç bir şekilde, fiyat hareketi fonlama oranı kadar güçlü değil. Fiyat Temmuz sonundan 2 Ağustos'a kadar önemli ölçüde düşmesine rağmen fonlama oranı 2 Ağustos'tan itibaren artmaya başladı, yani yatırımcılar düşüşe rağmen uzun pozisyon açmaya devam etti. 4 Ağustos'tan sonra fiyat bir miktar toparlandı, ancak fonlama oranındaki agresif artışa paralel olarak değil. Bu durum piyasanın fazla iyimser olabileceğine işaret ediyor. Fonlama oranı yüksek olmasına rağmen fiyatın bunu tam olarak desteklememesi kısa vadede temkinli olunması gerektiğine işaret ediyor olabilir.
Uzun ve Kısa Tasfiyeler
ETH fiyatının 3.354 dolara düşmesiyle birlikte yaklaşık 1,1 milyar dolar değerinde uzun pozisyon tasfiye edildi. Aynı dönemde 359 milyon dolarlık kısa pozisyon da tasfiye edildi.
| Tarih | Uzun Tutar (Milyon $) | Kısa Tutar (Milyon $) |
|---|---|---|
| 30 Temmuz | 114.50 | 40.11 |
| 31 Temmuz | 94.30 | 30.89 |
| 01 Ağustos | 373.88 | 40.97 |
| 02 Ağustos | 152.93 | 31.68 |
| 03 Ağustos | 28.93 | 57.00 |
| 04 Ağustos | 17.15 | 115.86 |
| 05 Ağustos | 337.88 | 42.91 |
| Toplam | 1119.57 | 359.42 |
Tedarik Dağıtımı
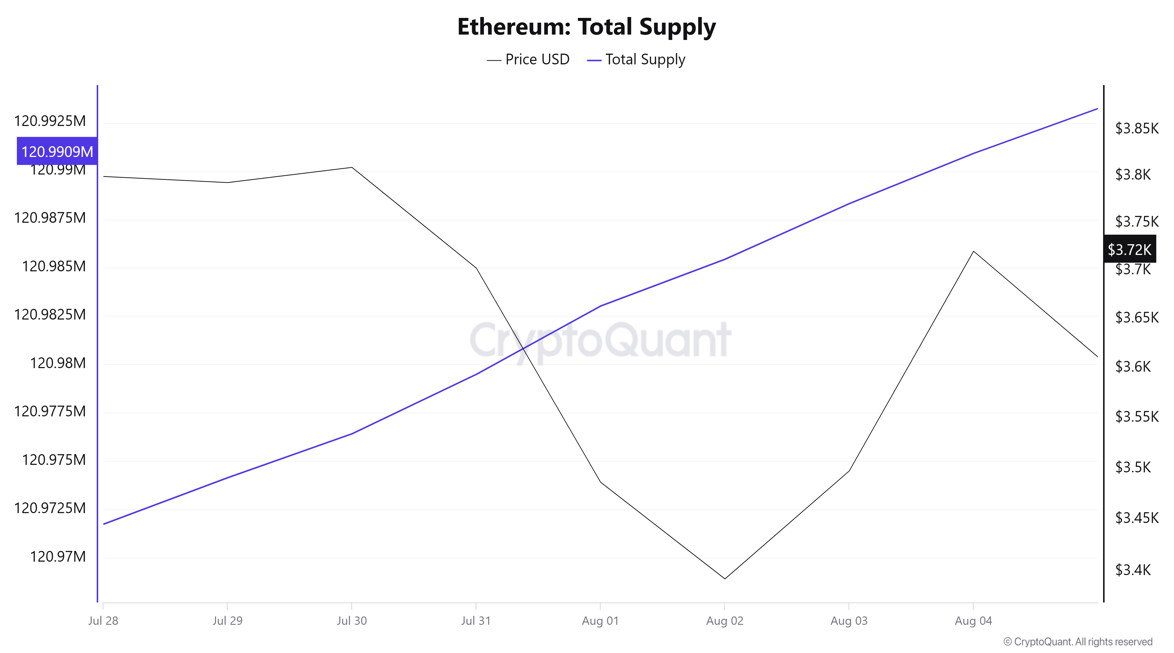
Toplam Arz: 120.993.223 adet, geçen haftaya göre yaklaşık %0,01775 artış.
Yeni Arz: Bu hafta üretilen ETH miktarı 21.487 oldu.
Hız: Hız, geçen hafta 8,85 iken 4 Ağustos itibariyle 8,91 oldu.
| Cüzdan Kategorisi | 28.07.2025 | 04.08.2025 | Değişim (%) |
|---|---|---|---|
| 100 - 1k ETH | 8.8642M | 8.7981M | -0.746% |
| 1k - 10k ETH | 12.6256M | 12.7372M | 0.884% |
| 10k - 100k ETH | 18.1479M | 18.4725M | 1.789% |
| 100k+ ETH | 4.3805M | 4.2244M | -3.564% |
Son haftalık verilere göre Ethereum cüzdan dağılımı karışık bir seyir izliyor. 100-1k ETH aralığındaki cüzdan bakiyeleri %0,746'lık sınırlı bir düşüş yaşarken, 1k-10k ETH segmentinde %0,884'lük ılımlı bir artış kaydedildi. Buna karşılık, 10 bin - 100 bin ETH aralığında %1,789'luk kayda değer bir artış yaşanırken, 100 bin+ ETH kategorisinde %3,564'lük önemli bir düşüş görüldü.
Döviz Arz Oranı
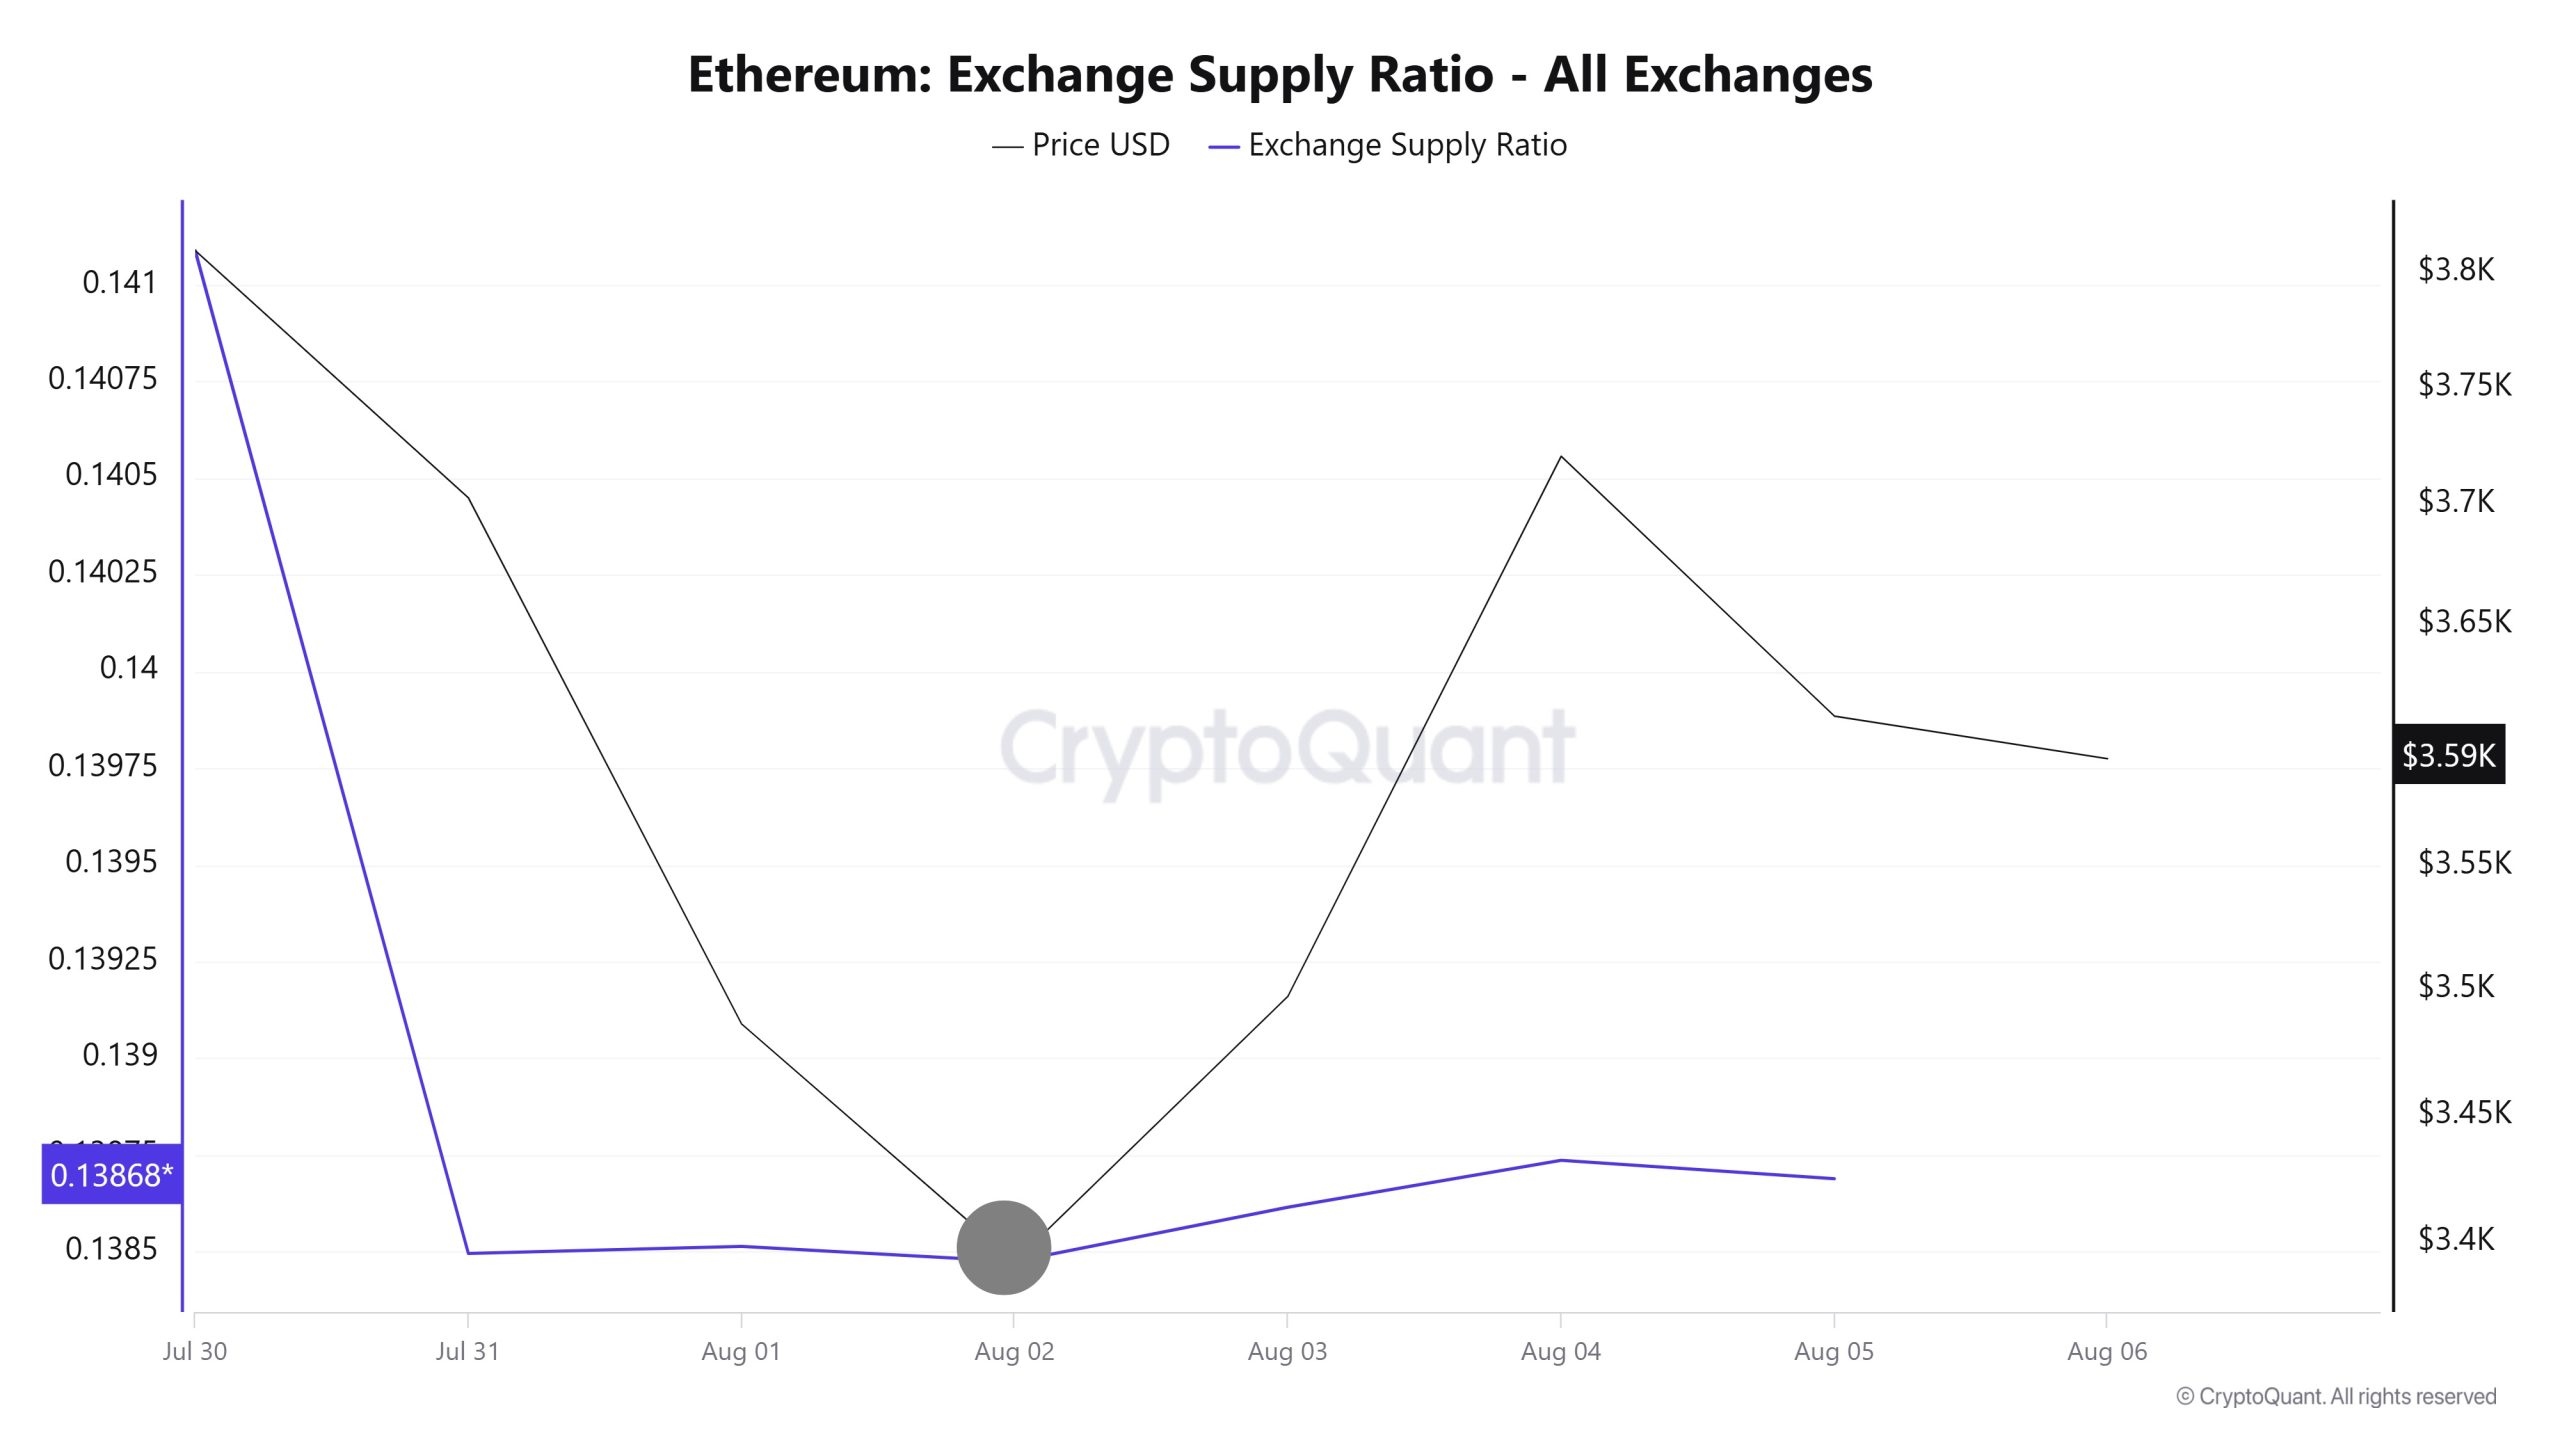
30 Ağustos ve 5 Ağustos tarihleri arasında Ethereum Borsa Arz Oranı 0,13849551'dan 0,13873636'a yükseldi. Bu dönemde Ethereum fiyatı 3.703 dolardan 3.720 dolara yükseldi. Fiyat ve Borsa Arz Oranının kesiştiği noktada, özellikle 2 Ağustos'ta, fiyat düşmeye devam ederken Borsa Arz Oranında önemli bir artış oldu. Bu durum, fiyat düşüşüne rağmen borsalara arz edilen Ethereum miktarının arttığını ve muhtemelen uzun vadeli yatırımcıların varlıklarını ellerinde tutmayı bıraktığını göstermektedir. Ethereum fiyatında genel olarak düşüş eğiliminin hakim olduğu görülmektedir.
Döviz Rezervi
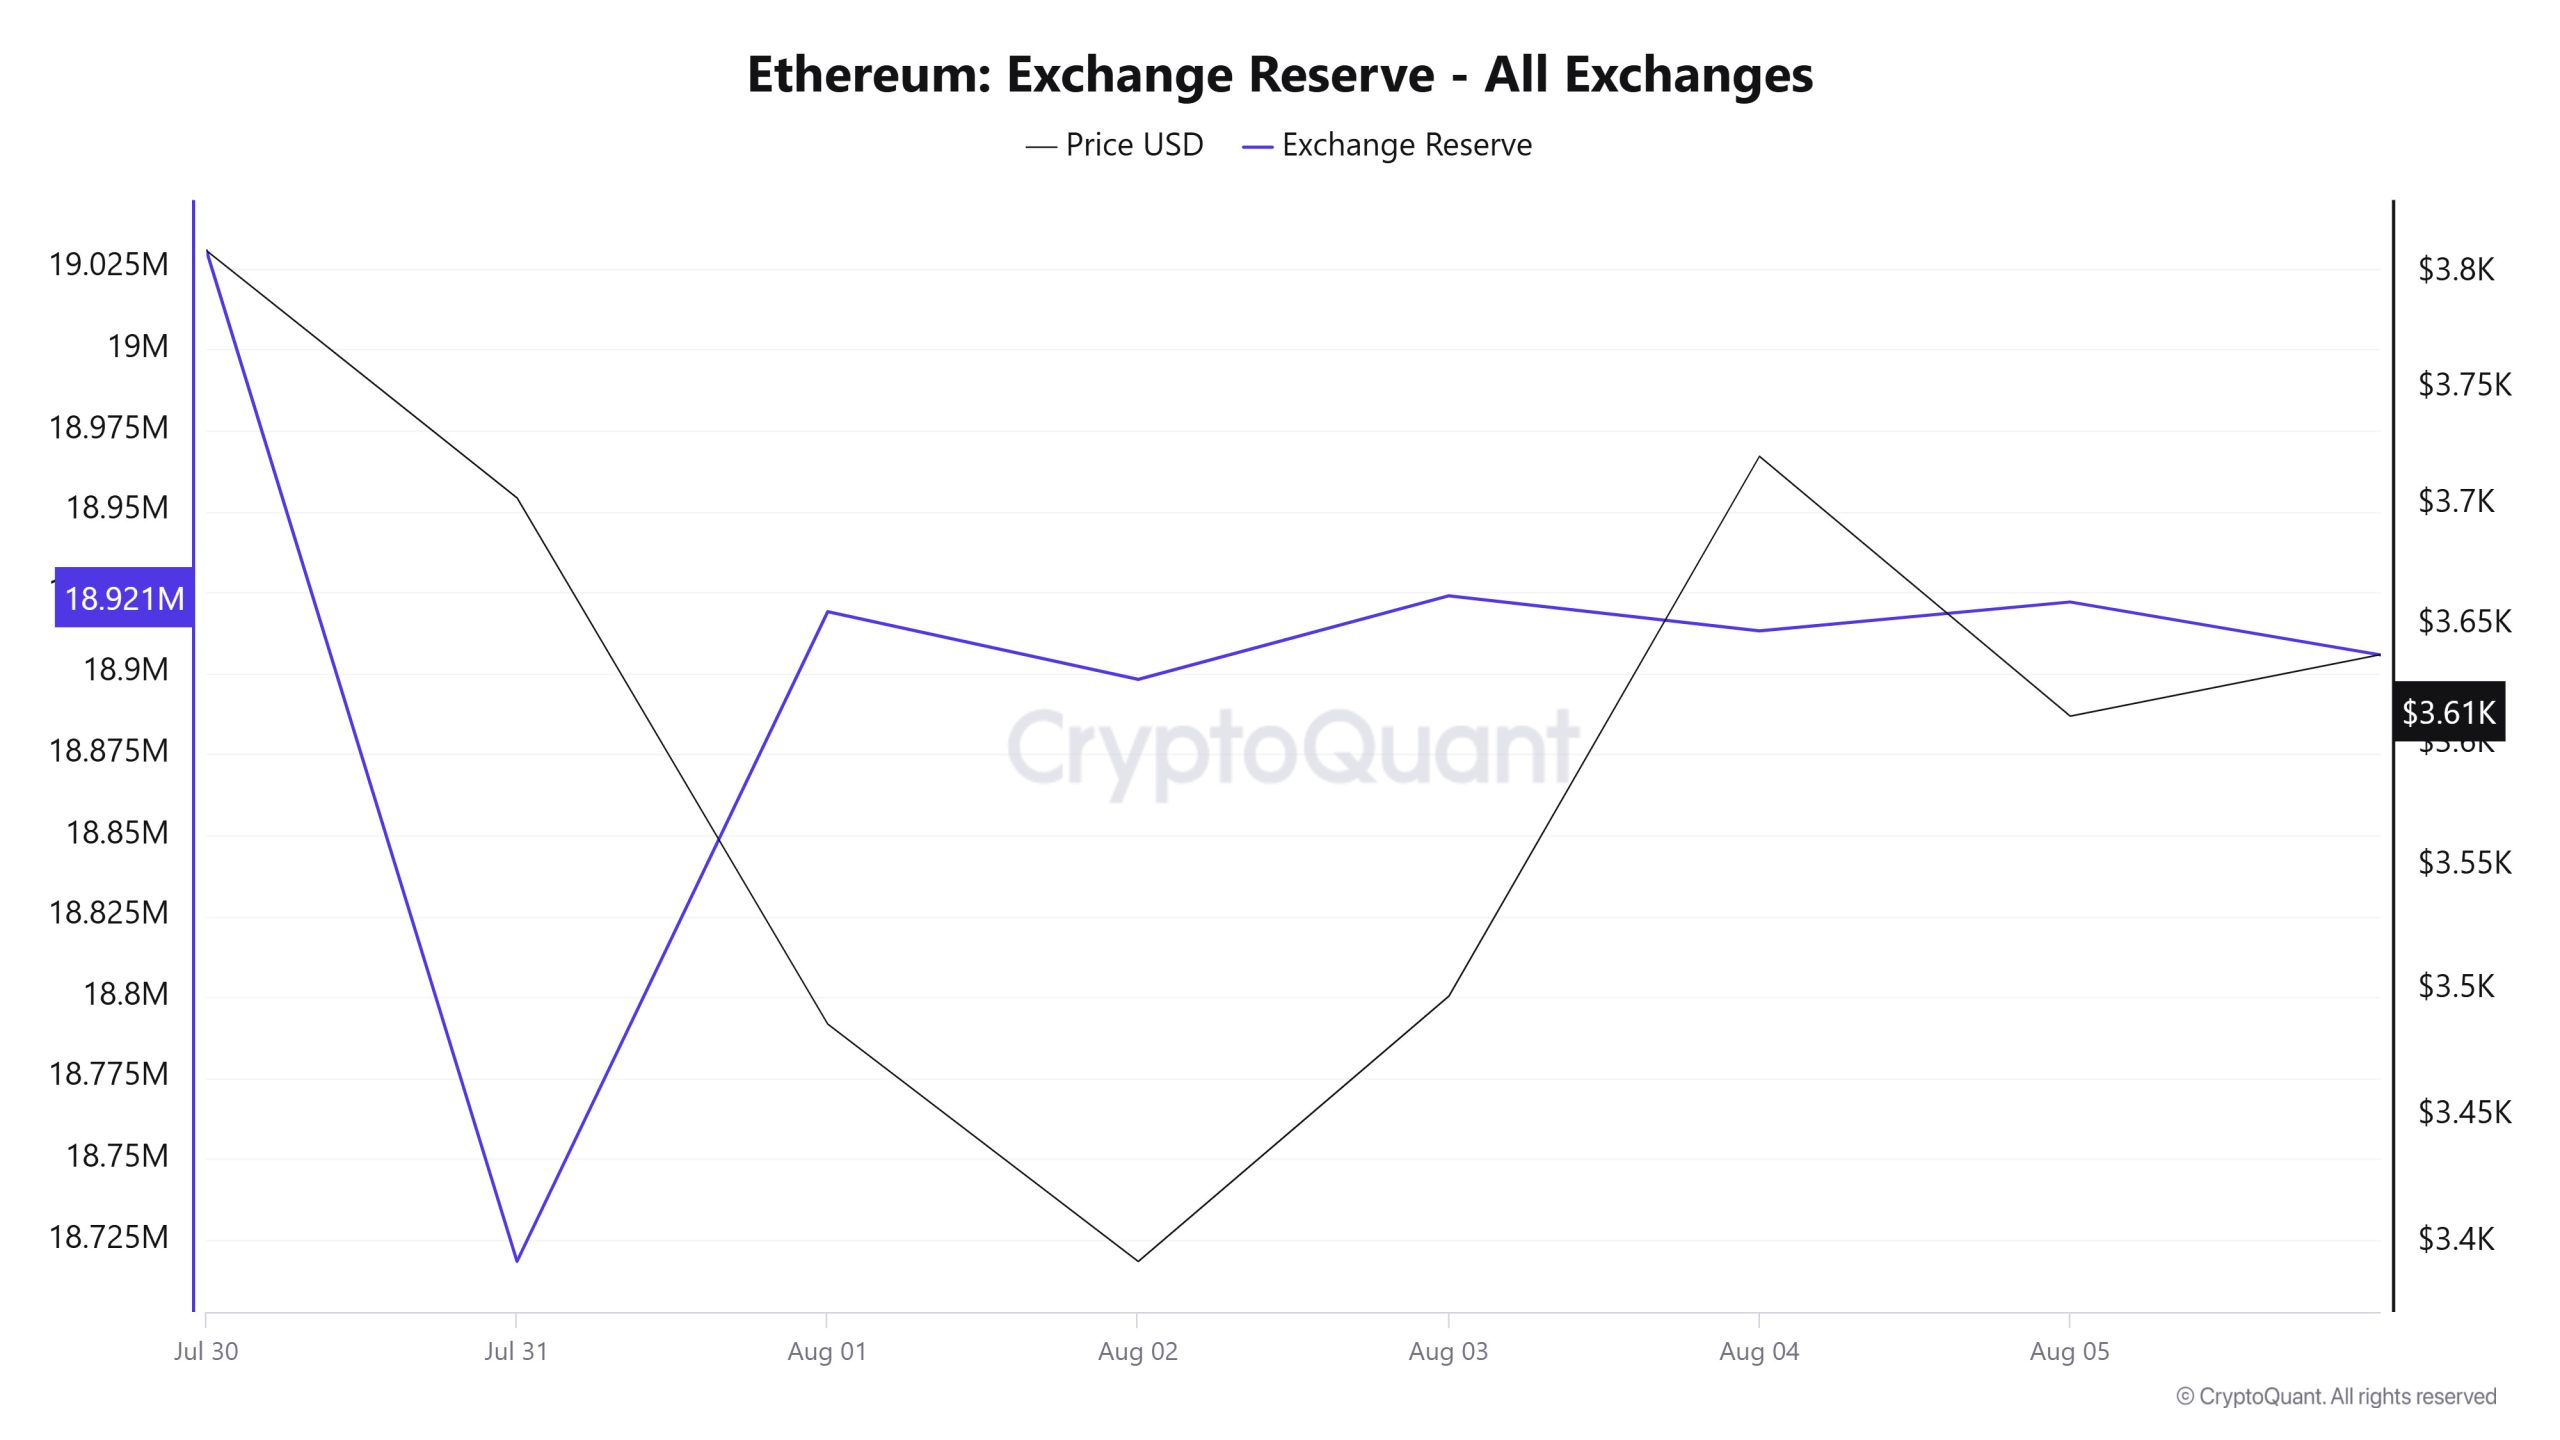
30 Temmuz - 5 Ağustos 2025 tarihleri arasında borsalardaki Ethereum rezervleri 19.030.470 ETH'den 18.921.976 ETH'ye düştü. Bu dönemde, borsa rezervlerinde yaklaşık %0,57'lik bir düşüşle toplam 108.494 ETH net çıkış oldu. Aynı dönemde Ethereum fiyatı %5,2 oranında düşerek 3.810 dolardan 3.612 dolara geriledi. Rezervlerdeki azalmanın devam etmesine rağmen fiyattaki düşüş, yatırımcıların temkinli bir kâr realizasyonu ya da satış stratejisi izlediğini gösteriyor. Uzun vadede, rezervlerdeki düşüş yükseliş potansiyelini desteklemeye devam ederken, kısa vadede devam eden borsa çıkışları ve satış baskısı fiyatın daha yatay bir trendde kalmasına neden olabilir.
| Tarih | 30-Temmuz | 31-Temmuz | 1-Ağustos | 2-Ağustos | 3-Ağustos | 4-Ağustos | 5-Ağustos |
|---|---|---|---|---|---|---|---|
| Borsa Girişi | 1,010,735 | 1,009,376 | 1,350,715 | 496,083 | 383,635 | 957,304 | 1,159,541 |
| Döviz Çıkışı | 1,007,639 | 1,321,446 | 1,150,141 | 516,965 | 357,842 | 968,146 | 1,150,609 |
| Exchange Netflow | 3,095 | -312,070 | 200,574 | -20,881 | 25,793 | -10,842 | 8,932 |
| Döviz Rezervi | 19,030,470 | 18,718,400 | 18,918,974 | 18,898,092 | 18,923,885 | 18,913,043 | 18,921,976 |
| ETH Fiyat | 3,810 | 3,703 | 3,486 | 3,393 | 3,497 | 3,721 | 3,612 |
Ücretler ve Gelirler
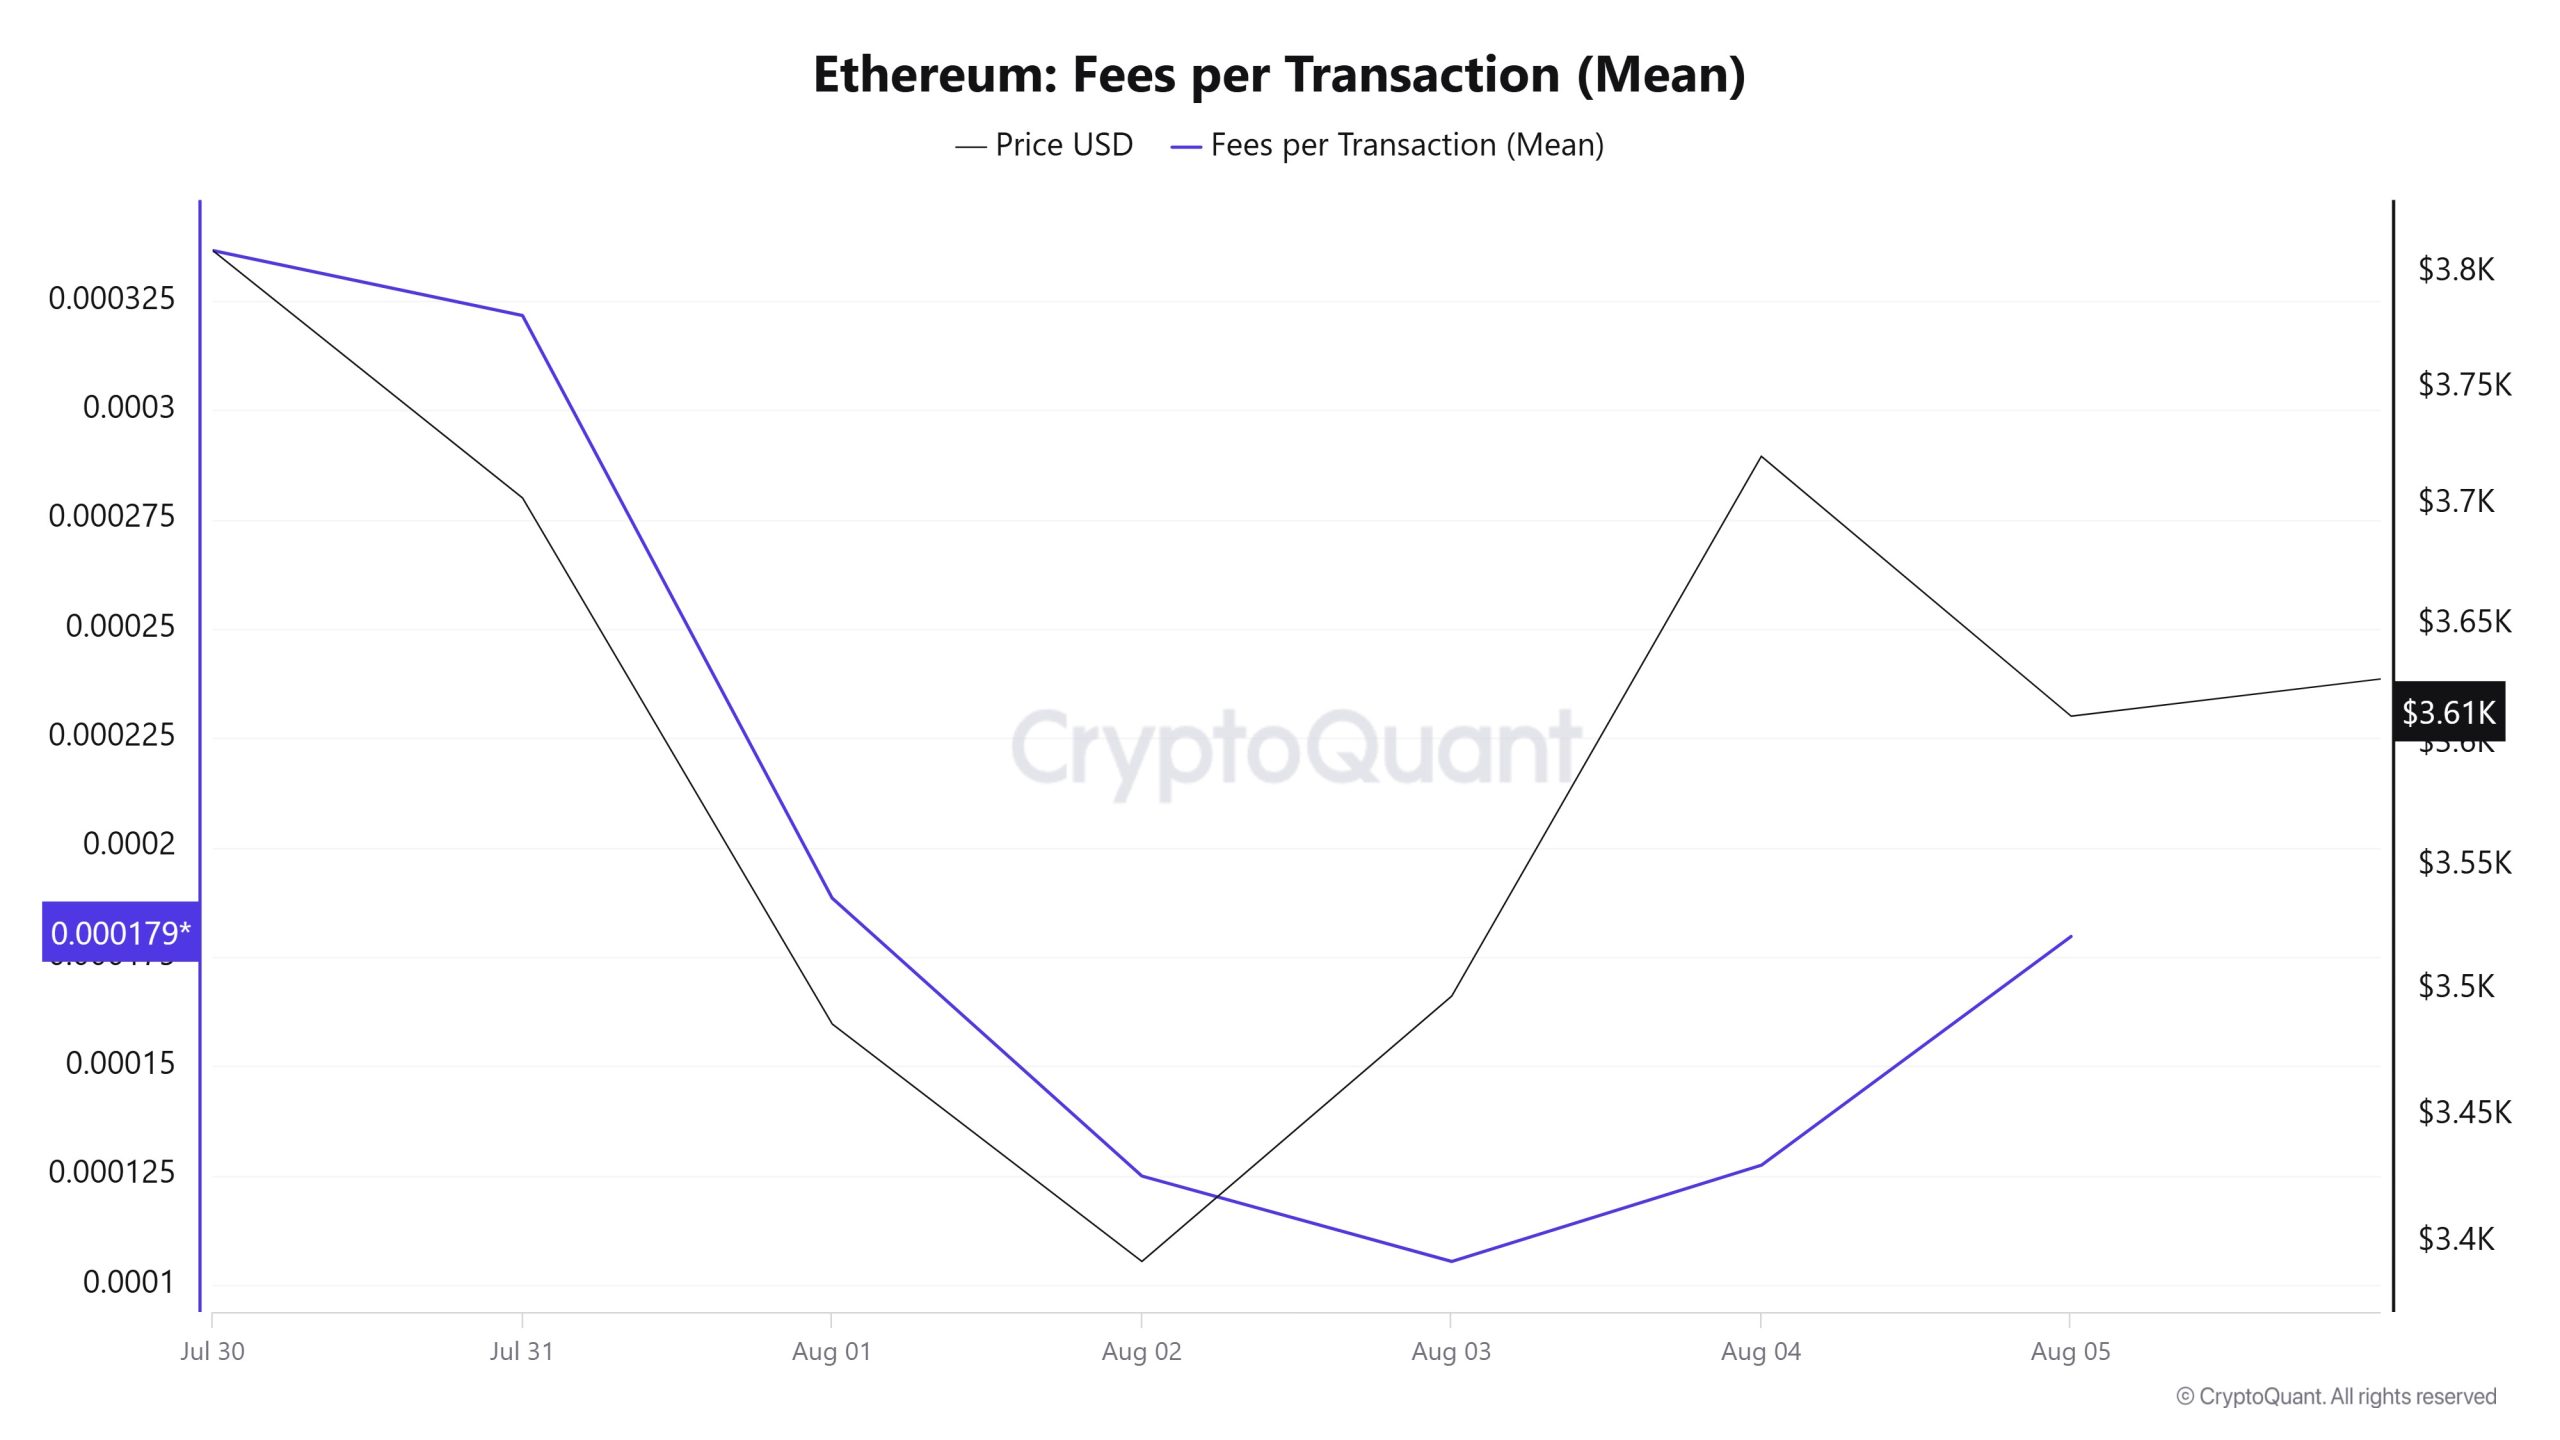
Ethereum'un 30 Temmuz - 5 Ağustos tarihleri arasındaki İşlem Başına Ücret (Ortalama) verileri incelendiğinde, bu göstergenin haftanın ilk günü olan 30 Temmuz'da 0,000336440317944061 seviyesinde gerçekleştiği görülüyor.
Bu tarihten itibaren Ethereum fiyatında yaşanan volatil hareketler nedeniyle aşağı yönlü bir eğilim gözlendi; 3 Ağustos itibariyle 0,000105307312637154 seviyesine ulaşarak haftanın en düşük seviyesini gördü.
İlerleyen günlerde Ethereum İşlem Başına Ücretler (Ortalama) yeniden yükselişe geçerek haftanın son günü olan 5 Ağustos'ta 0,00017961704632878 seviyesinden kapandı.
Bitcoin: Ücretler (Toplam)
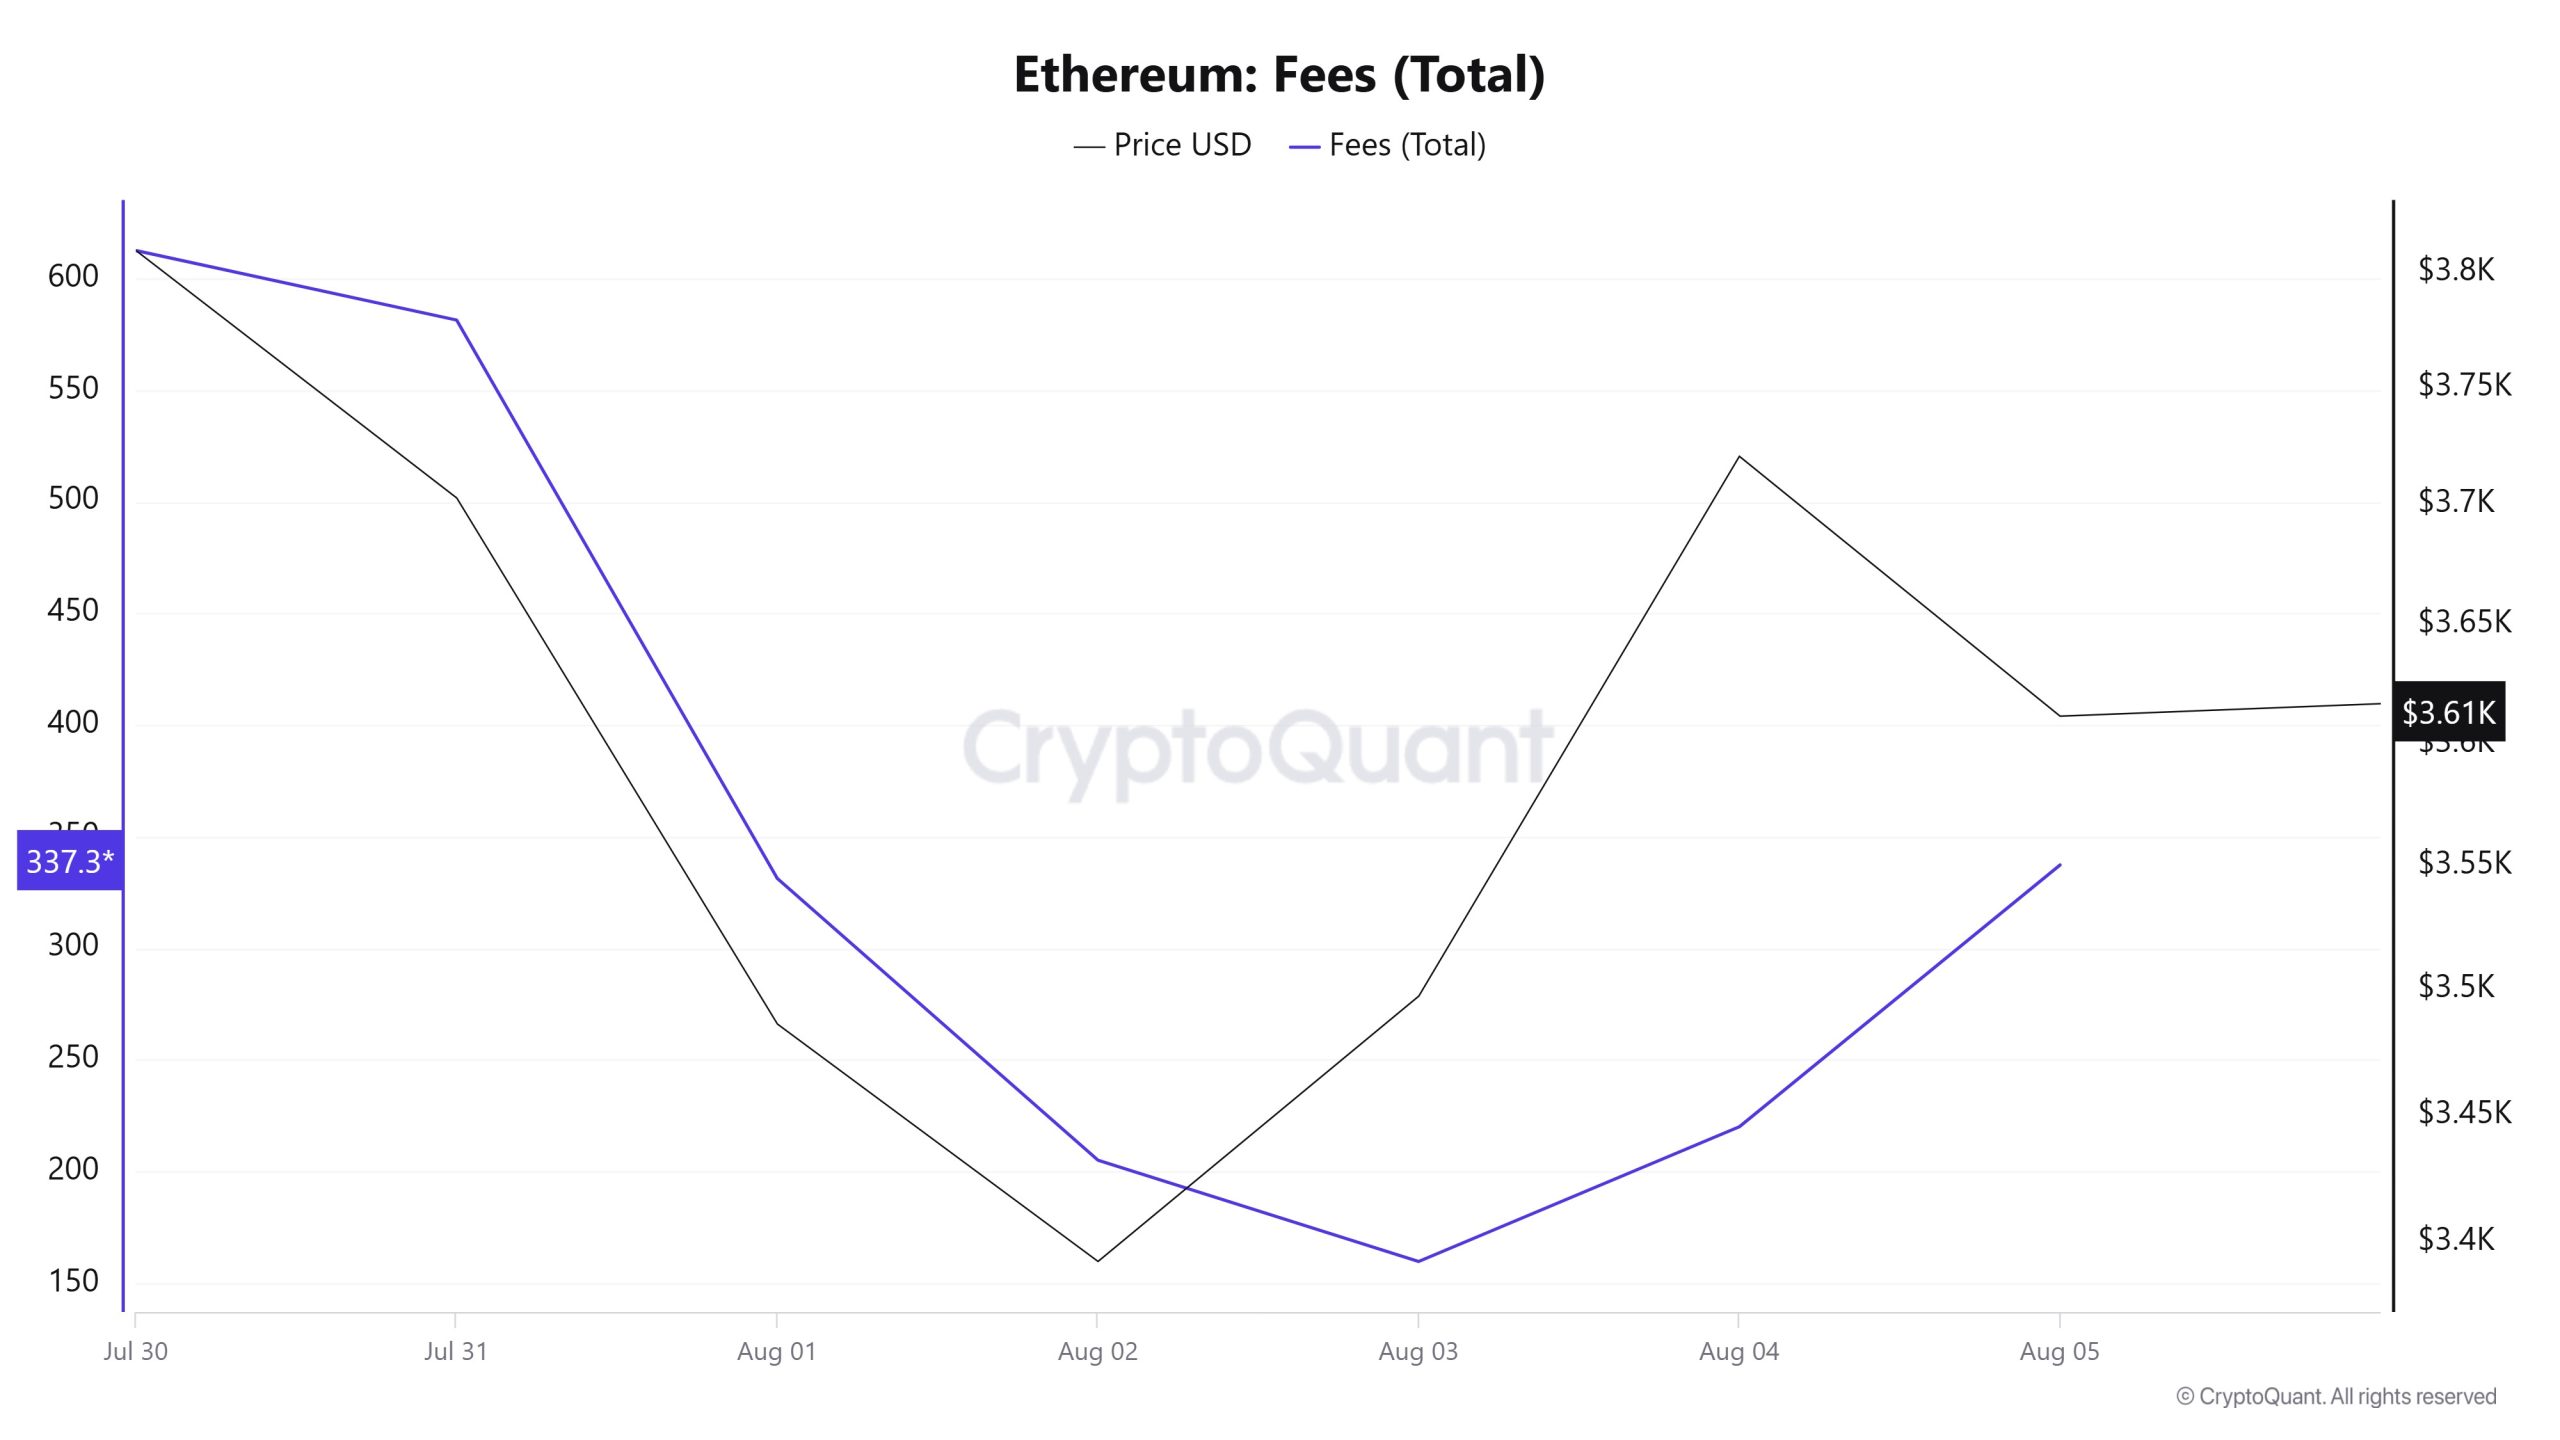
Benzer şekilde, 30 Temmuz ve 5 Ağustos tarihleri arasındaki Ethereum Ücretleri (Toplam) verileri incelendiğinde, haftanın ilk günü olan 30 Temmuz'da bu göstergenin 612.6568096551816 seviyesinde olduğu görülmektedir.
Bu tarihten itibaren Ethereum fiyatında yaşanan volatil hareketler nedeniyle aşağı yönlü bir eğilim gözlendi; 3 Ağustos itibariyle haftanın en düşük seviyesi olan 159.64114712885606'a ulaştı.
İlerleyen günlerde Ethereum Ücretleri (Total) tekrar yükselişe geçti ve haftanın son günü olan 5 Ağustos'ta 337.32638113388487 seviyesinden kapandı.
Çıkarılan Bloklar
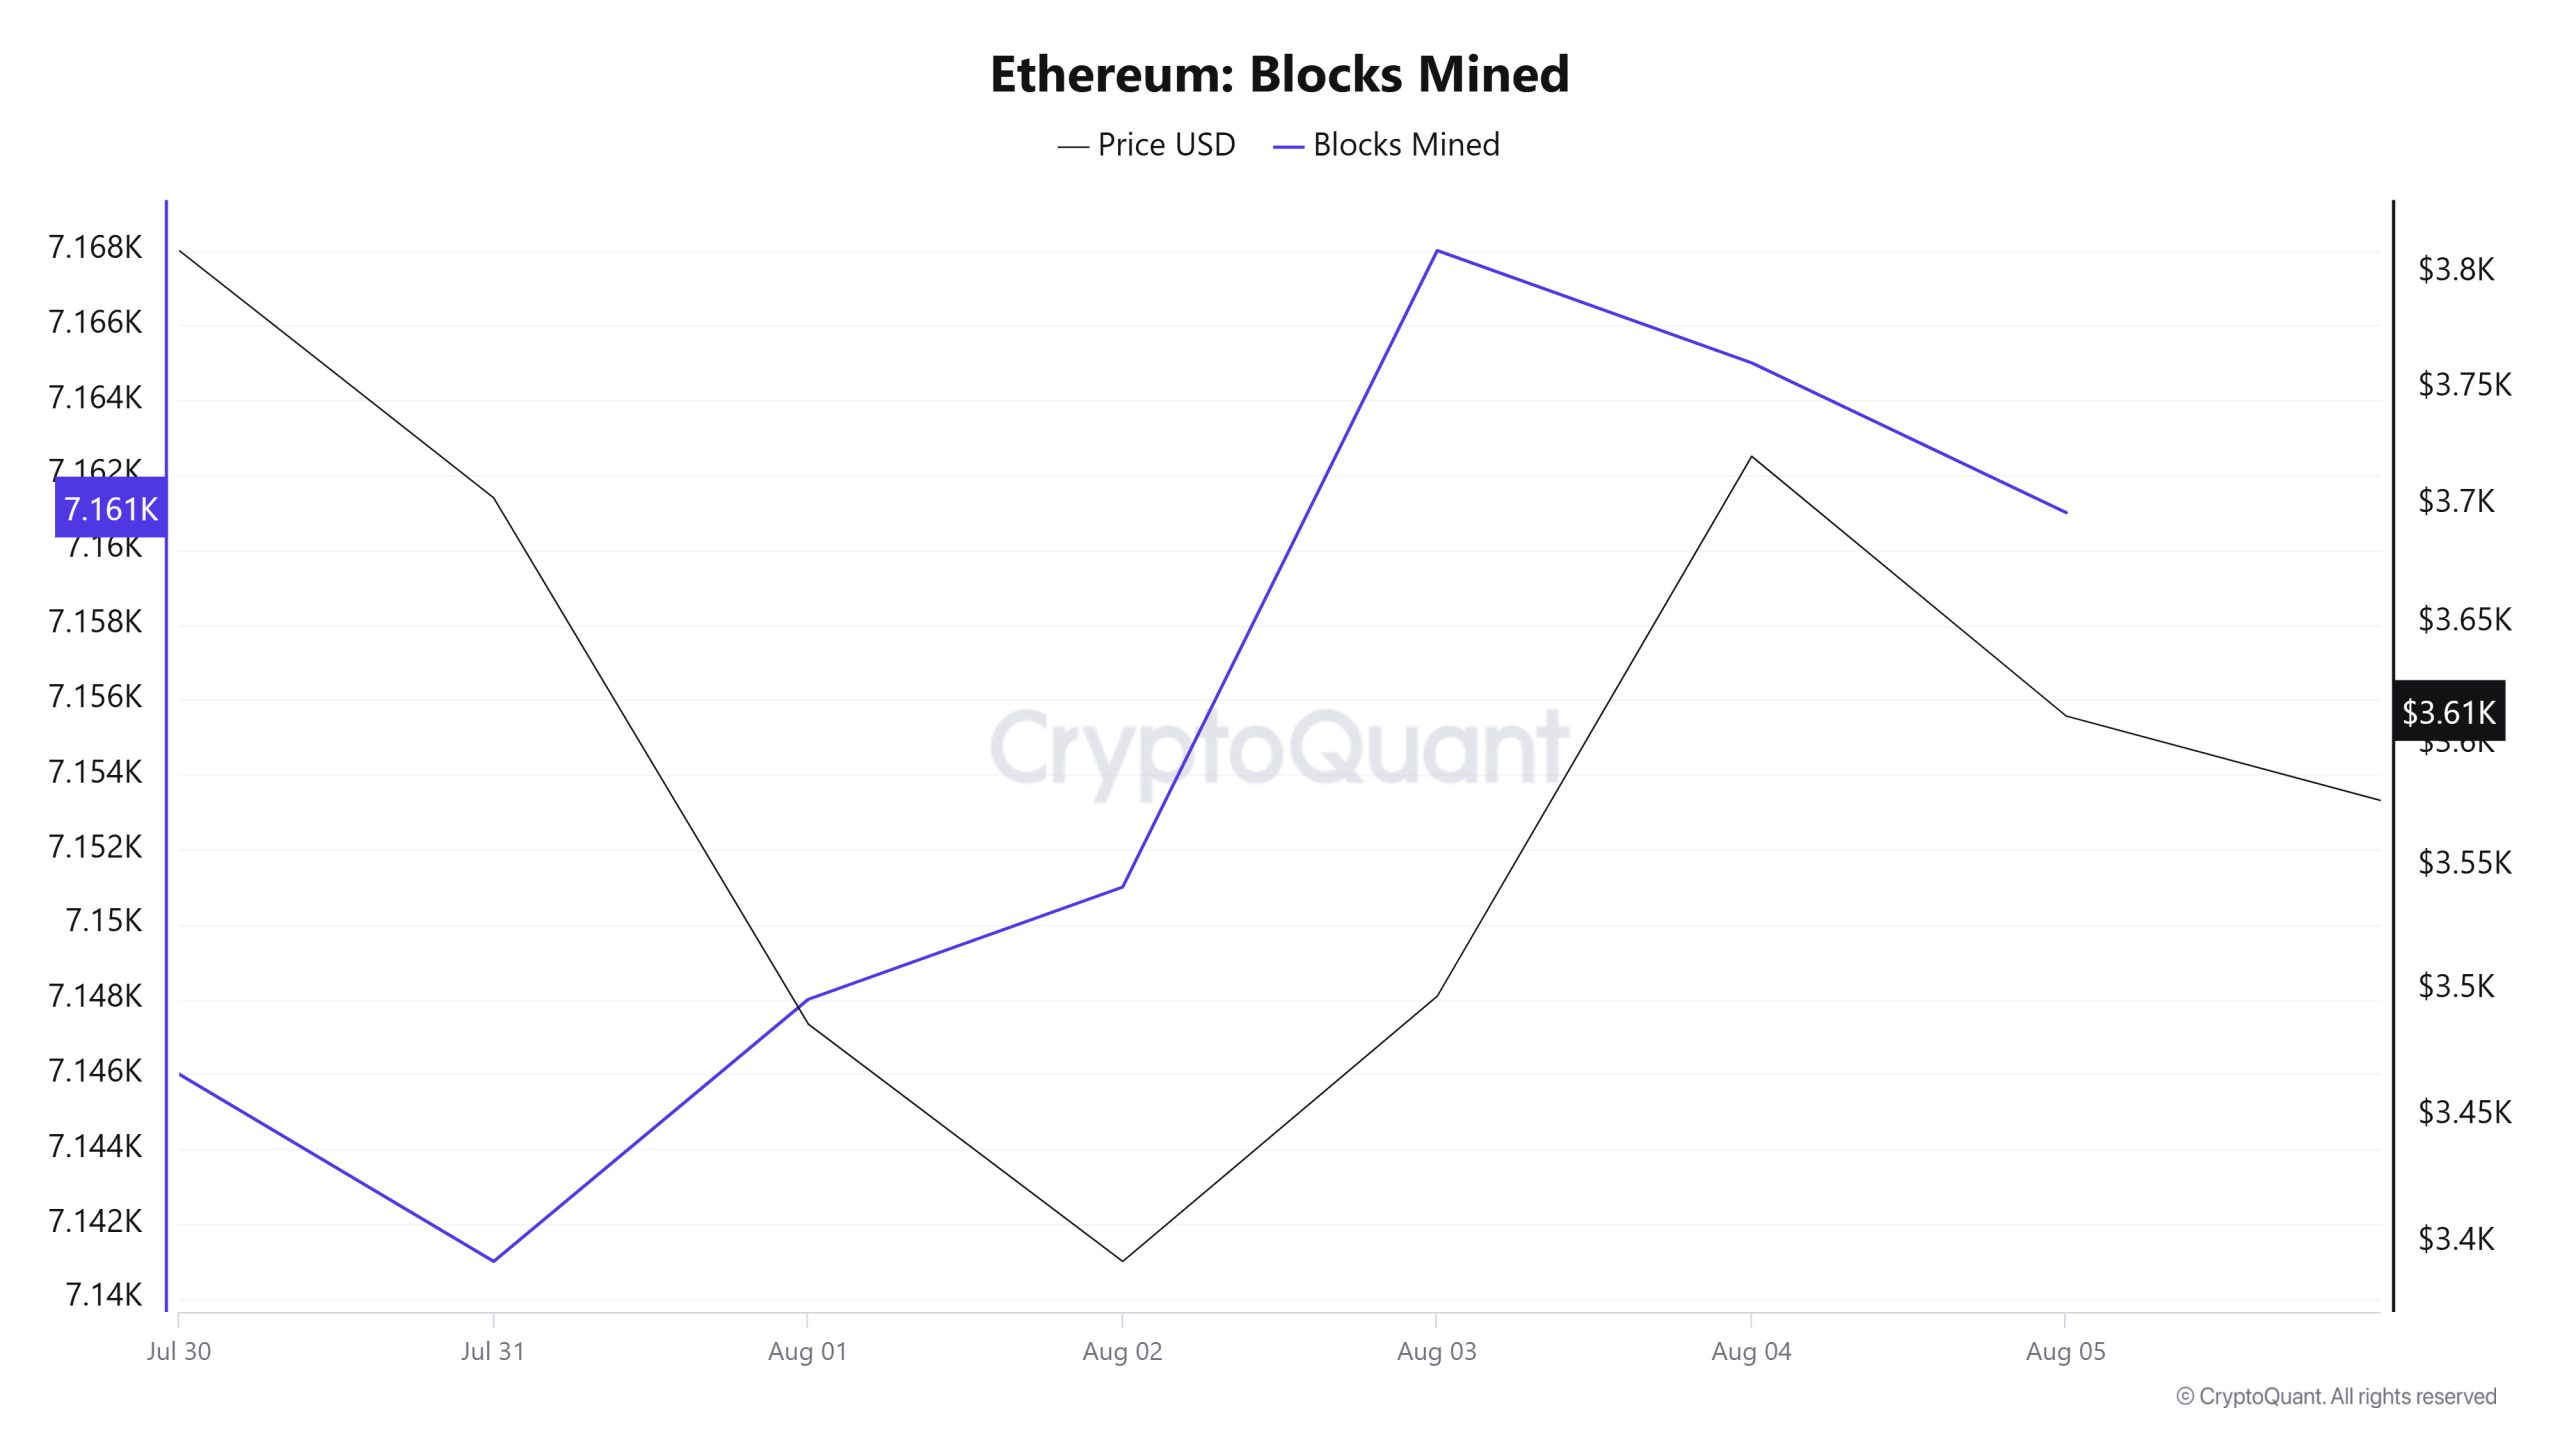
30 Temmuz - 5 Ağustos tarihleri arasında Ethereum blok üretim verileri hafta boyunca artış gösterdi. 30 Temmuz'da 7.146 blok üretilirken, bu sayı 5 Ağustos itibariyle 7.161'e yükseldi. Üretilen blok sayısındaki artış, ağın bu dönemde daha yoğun kullanıldığına işaret ediyor. Ethereum fiyatı ile hafta boyunca üretilen blok sayısı arasında pozitif bir korelasyon vardı.
Blok Boyutu
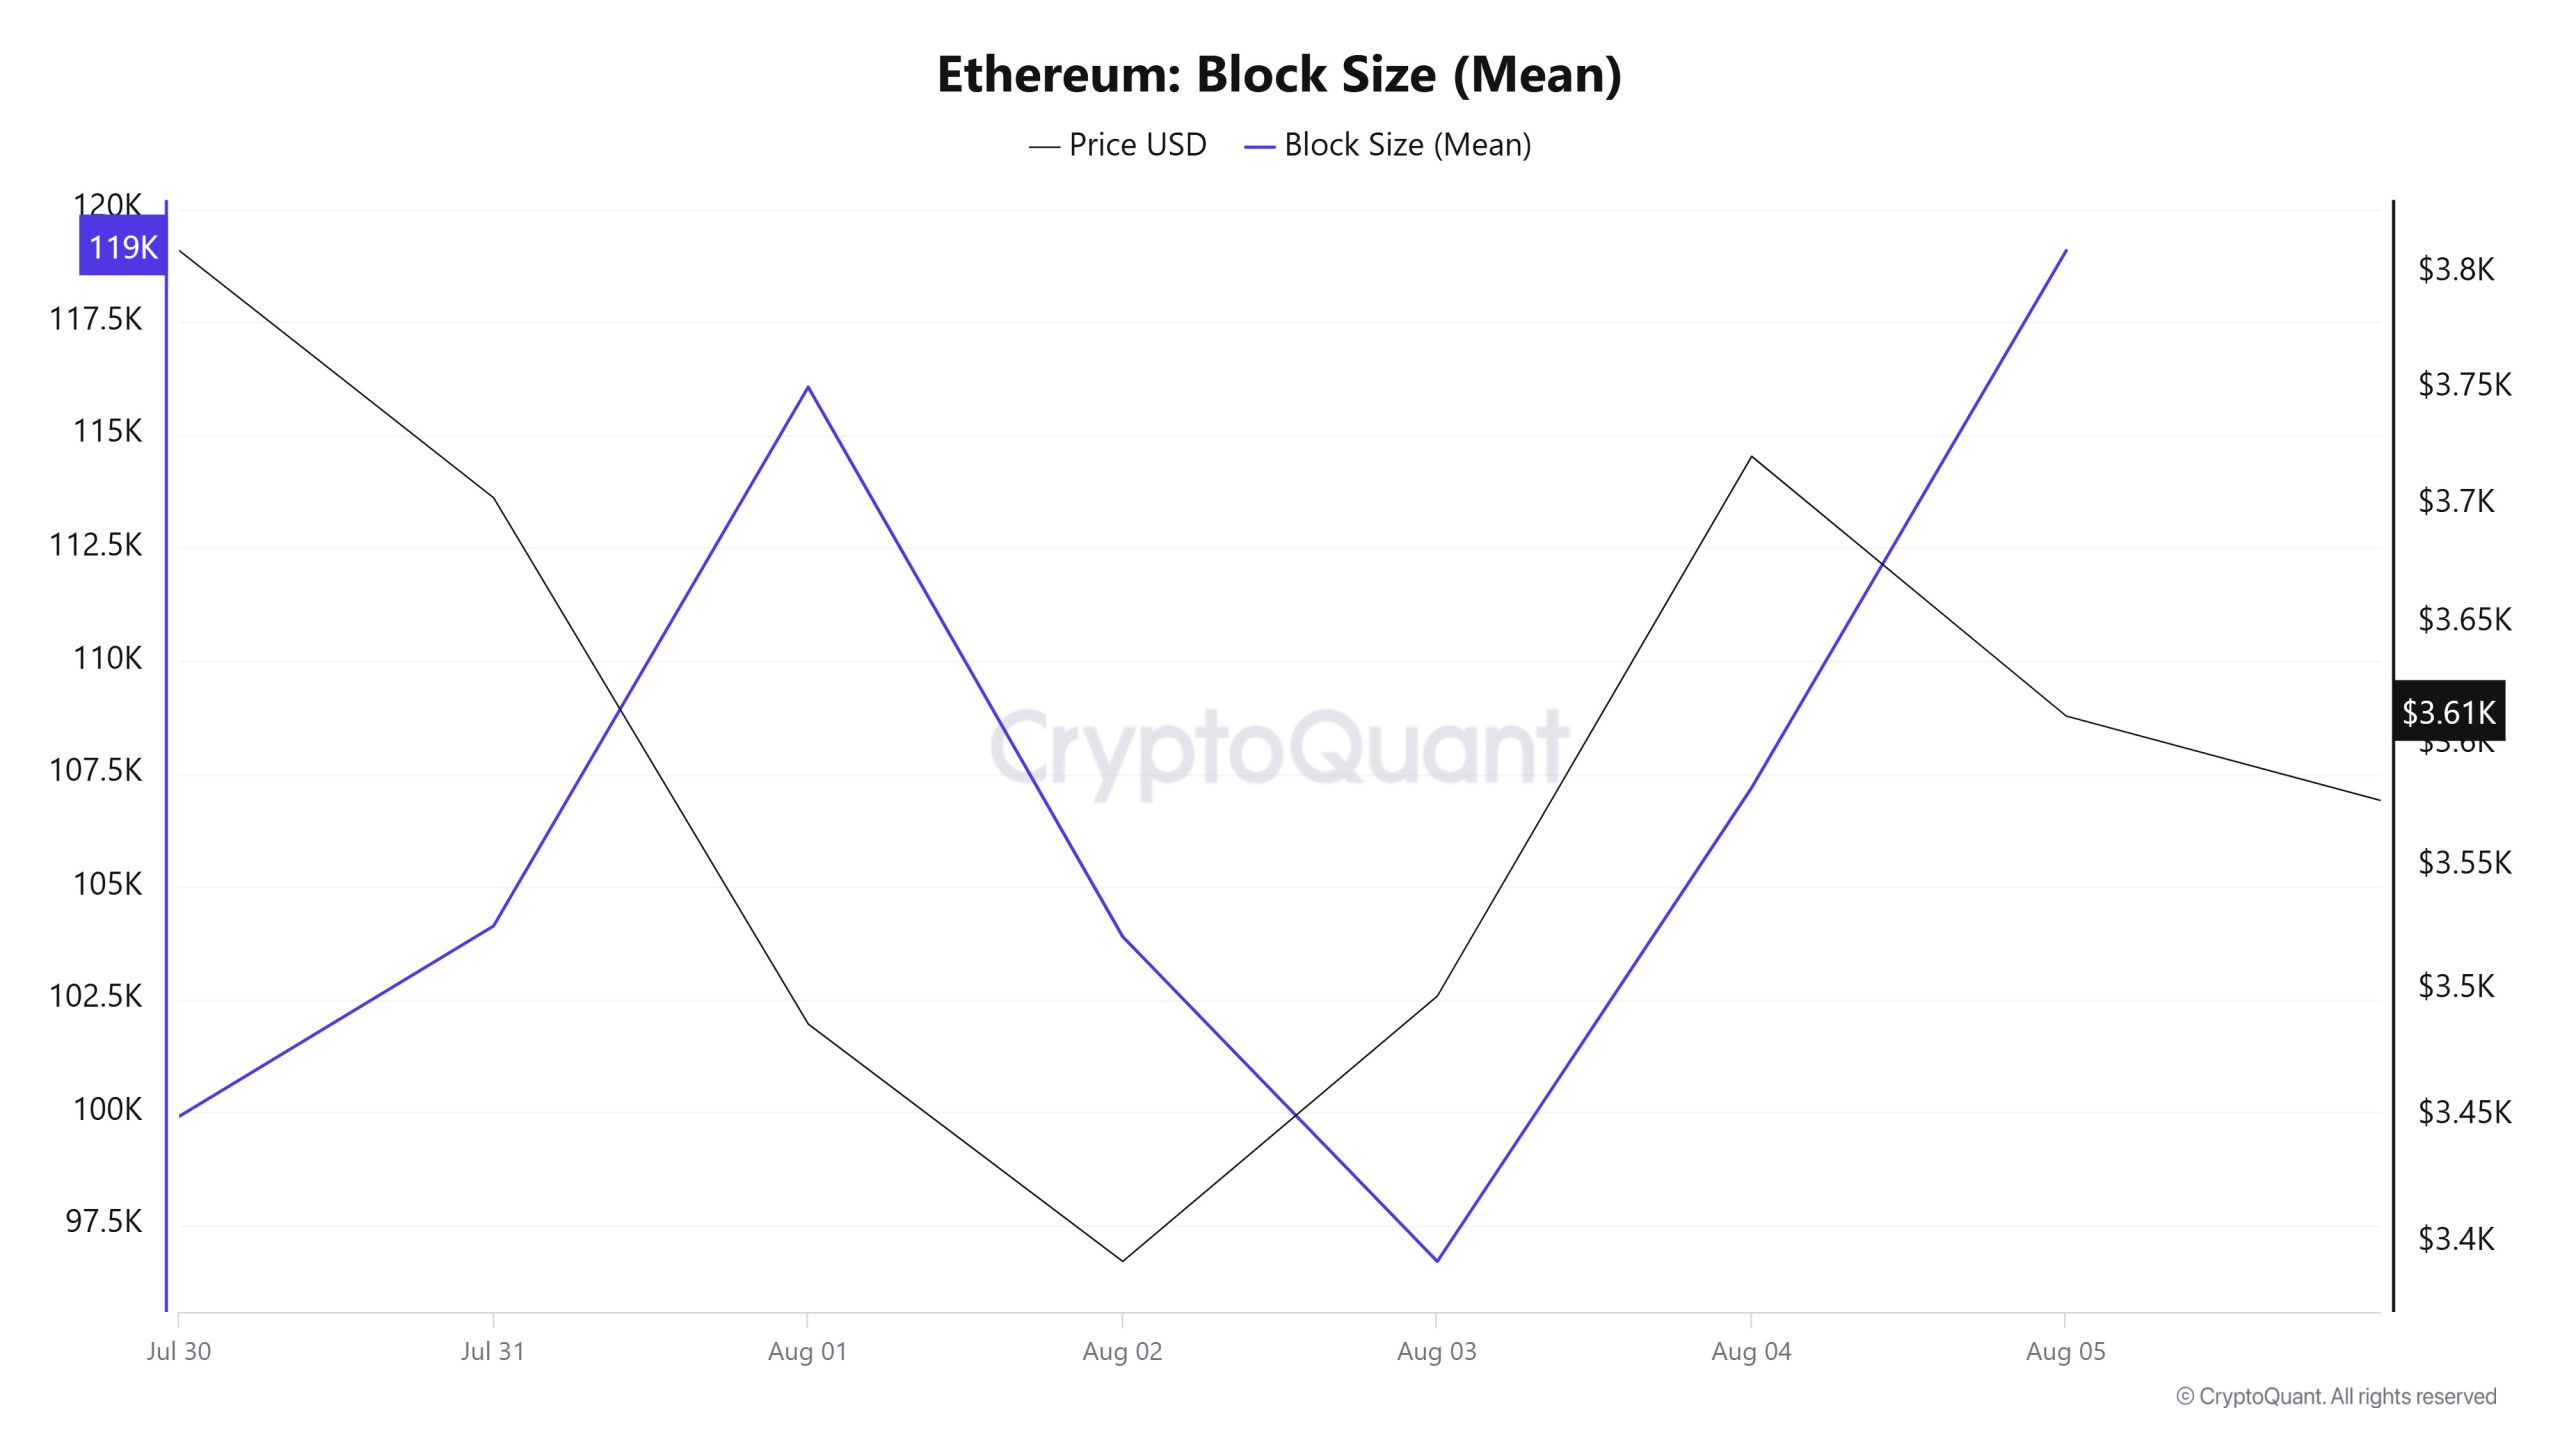
30 Temmuz ve 5 Ağustos tarihleri arasında Ethereum blok boyutu verileri hafta boyunca önemli bir artış gösterdi. 30 Temmuz'da ortalama blok boyutu 99.914 bayt iken, 5 Ağustos itibariyle bu değer 119.084 bayta yükseldi. Hafta boyunca blok boyutu ile Ethereum fiyatı arasında negatif bir korelasyon vardı.
Blok Aralığı
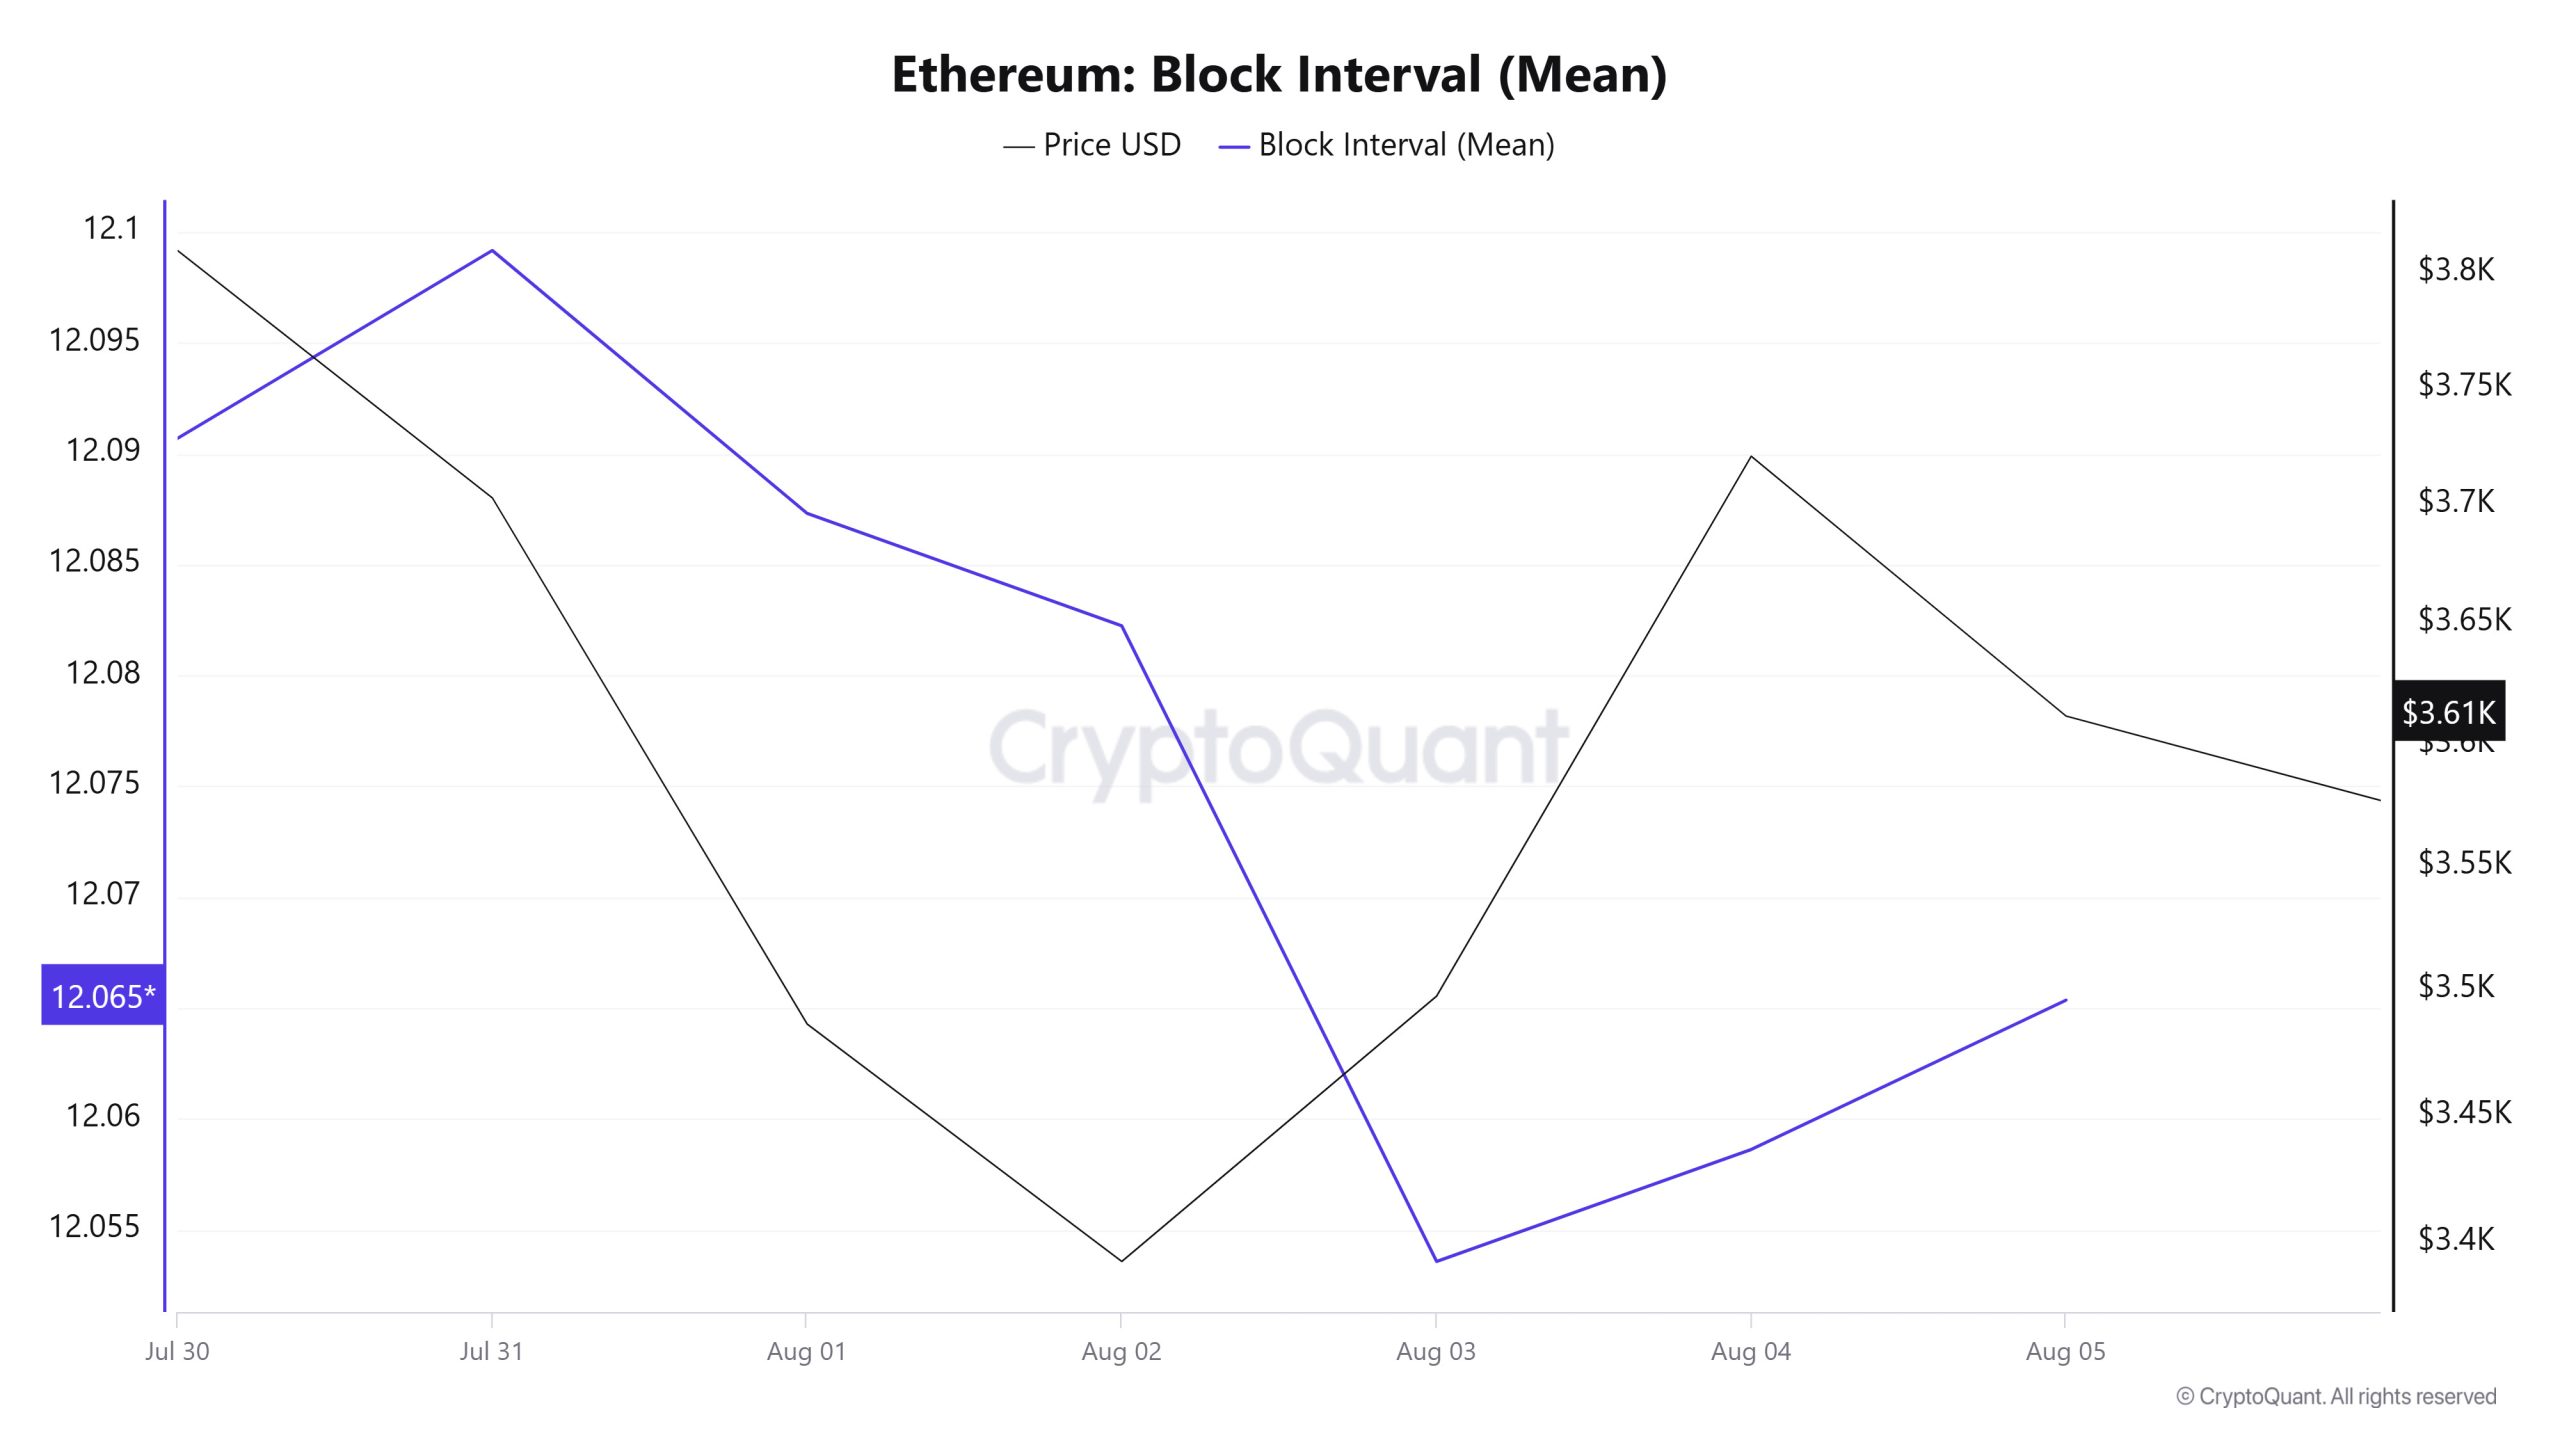
30 Temmuz ve 5 Ağustos tarihleri arasında Ethereum blok verileri hafta boyunca hafif bir düşüş gösterdi. 30 Temmuz'da ortalama blok süresi 12,09 saniye iken, 5 Ağustos itibariyle 12,06 saniyeye geriledi. Söz konusu dönemde, Ethereum blok süresi ve fiyat hareketi hafta boyunca pozitif korelasyon gösterdi.
İşlem
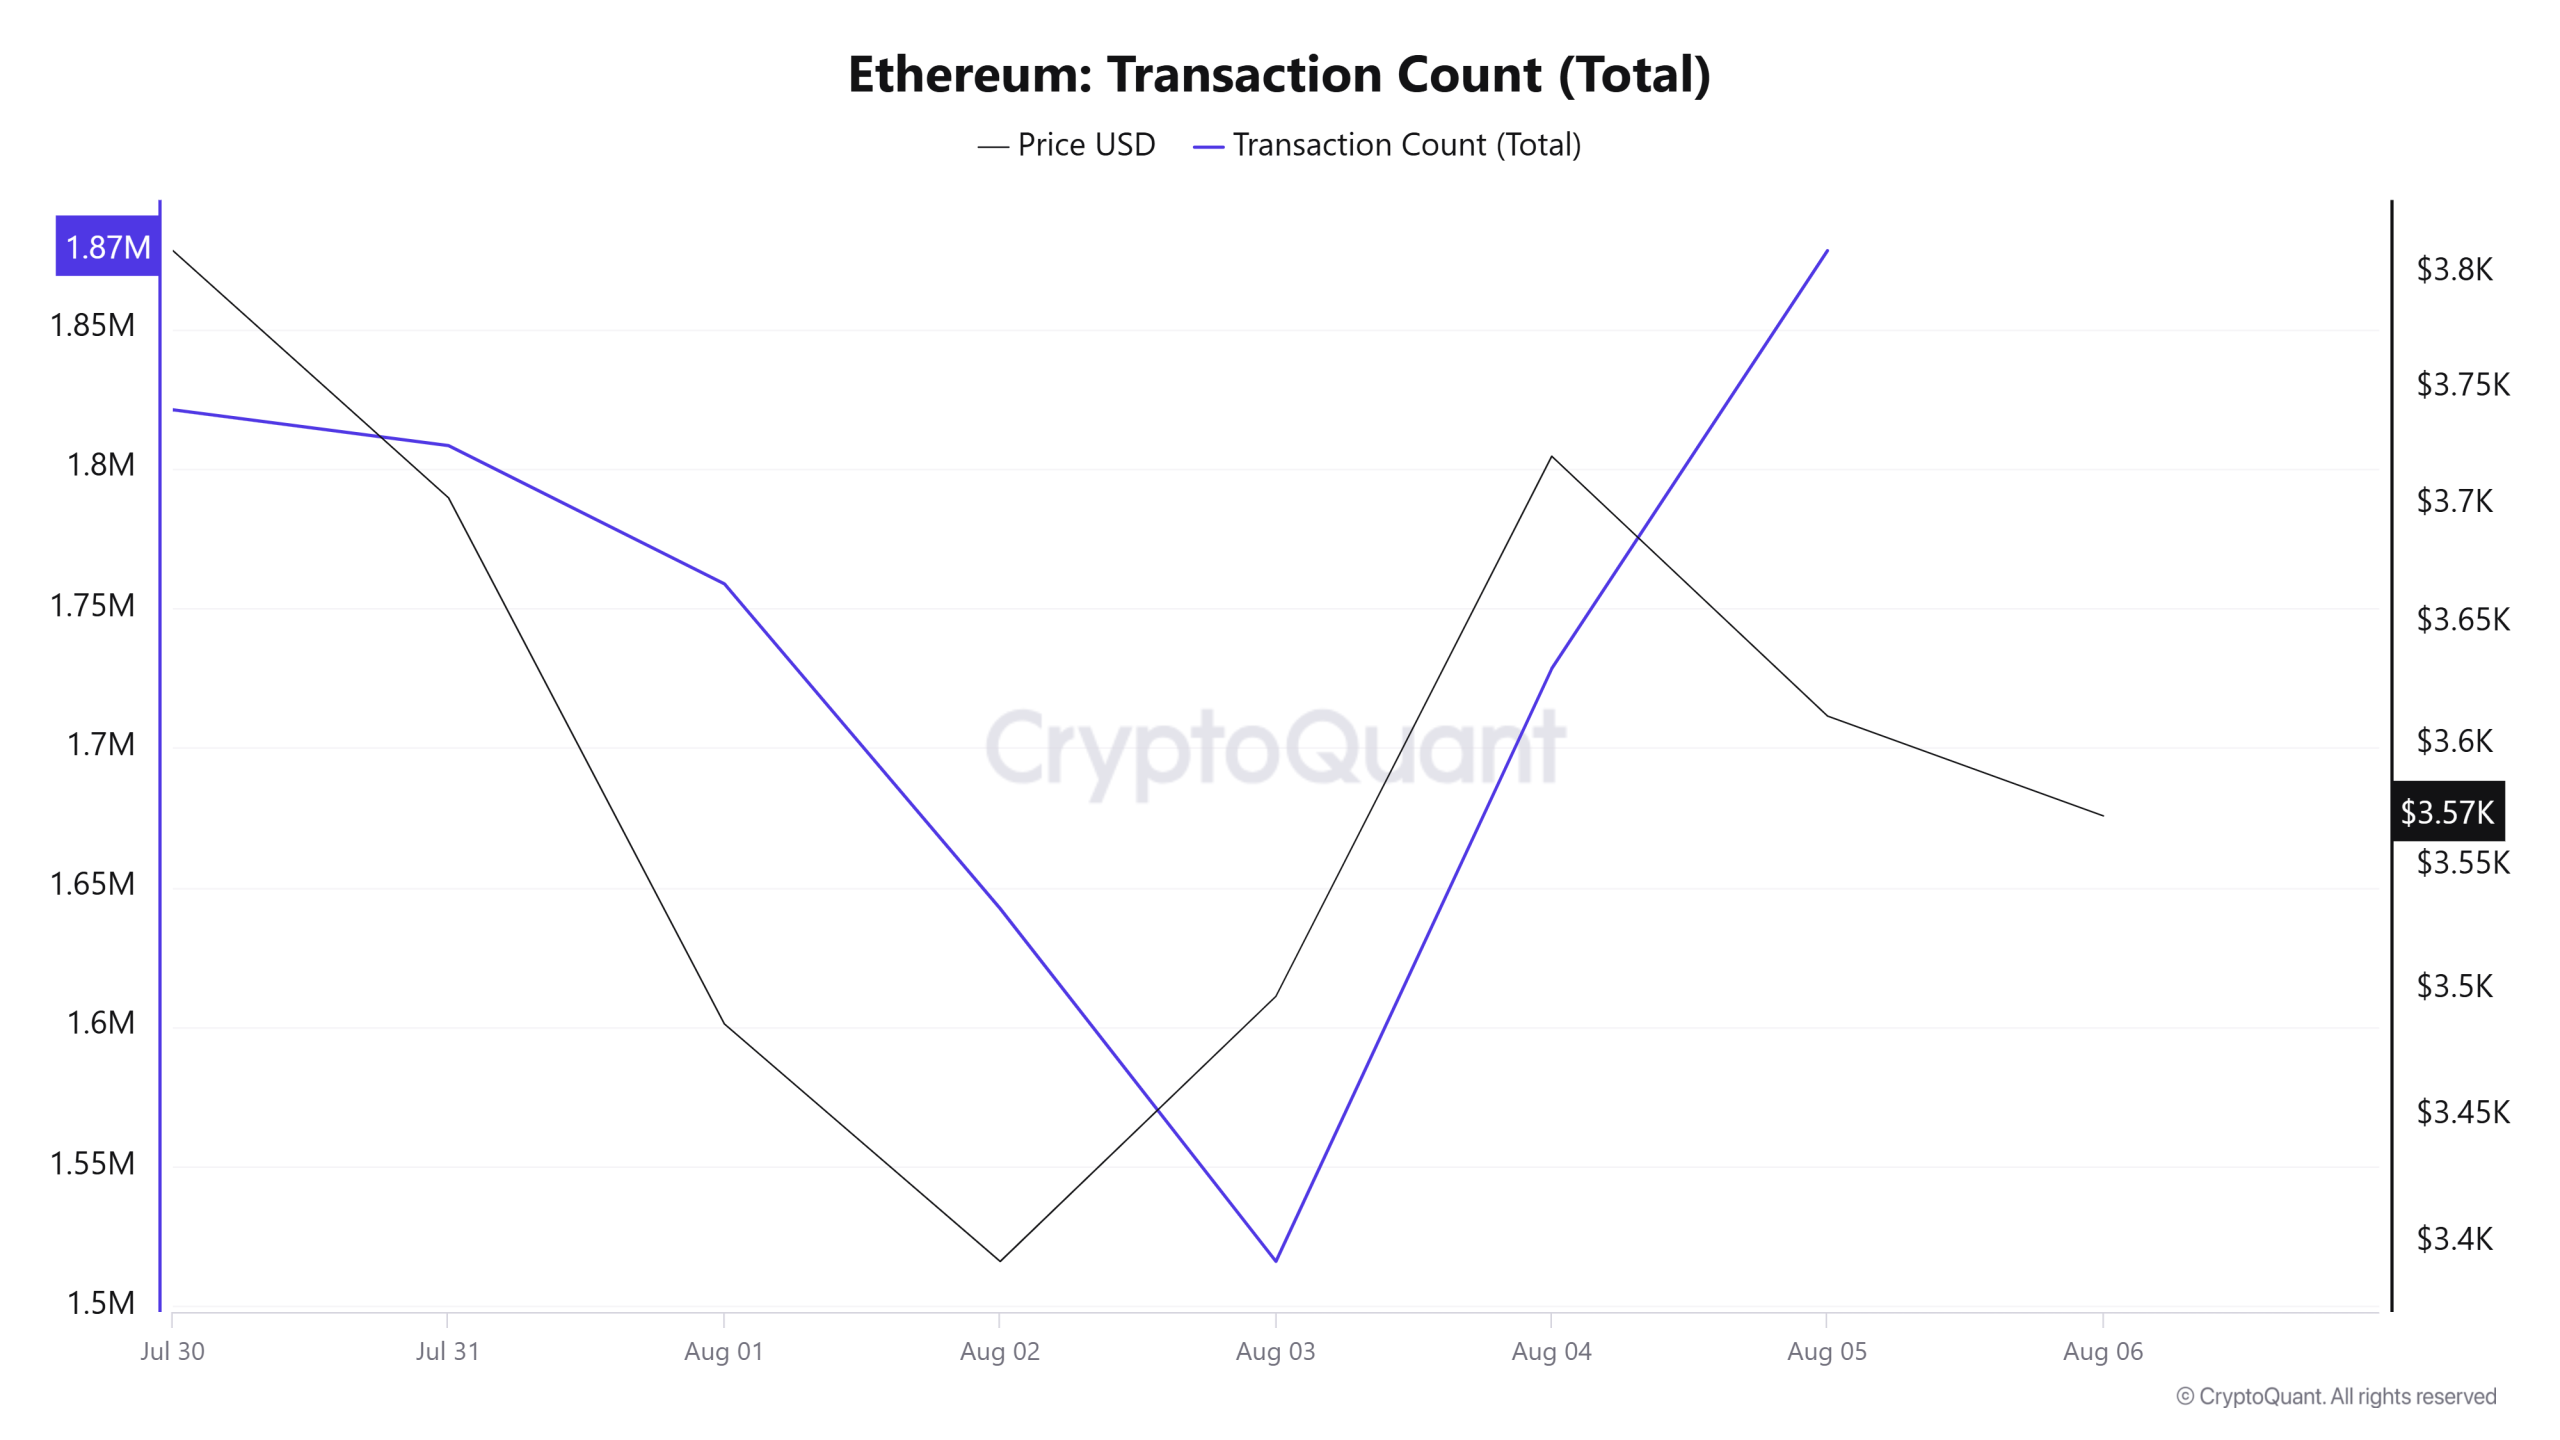
Geçtiğimiz hafta Ethereum ağında toplam 11.143.025 işlem gerçekleştirilirken, bu hafta bu sayı yaklaşık %4,82 azalarak 10.605.471'e geriledi. Haftalık bazda en yüksek işlem sayısı 5 Ağustos'ta 1.878.031 olurken, en düşük işlem sayısı ise 3 Ağustos'ta 1.515.955 oldu.
İşlem sayısındaki bu değişim, ağdaki kullanımın artmayı bırakıp biraz stabilize olduğunu ve Ethereum yakımlarının geçen haftaya kıyasla azaldığını gösteriyor. Fiyat ve işlem sayısı arasındaki korelasyon hafta boyunca pozitif ağırlıklıydı.
Transfer Edilen Jetonlar
Geçtiğimiz hafta Ethereum ağında transfer edilen toplam ETH miktarı 16.952.280 iken bu hafta bu miktar yaklaşık %23,81 azalarak 12.913.505'e geriledi. 1 Ağustos'ta gerçekleşen 2.530.694 ETH transferi haftanın en yüksek günlük token transfer miktarı olurken 3 Ağustos sadece 1.019.774 ETH transferi ile haftanın en düşük değerini kaydetti. Hafta boyunca fiyat ve transfer edilen token miktarı arasındaki ilişki incelendiğinde dengeli bir korelasyon gözlemlendi.
Ağ kullanımında transfer sayısının azalmasına karşın transfer edilen toplam token miktarının çok daha fazla azalmış olması, Ethereum ağındaki kullanıcı aktivitesinin azaldığını ancak daha küçük kullanıcıların hacminin arttığını düşündürüyor. Bu durum, Ethereum'un kullanıcı tabanını DeFi, NFT ve diğer Web3 uygulamalarındaki küçük yatırımcılara doğru genişlettiği şeklinde yorumlanabilir.
Tahmini Kaldıraç Oranı
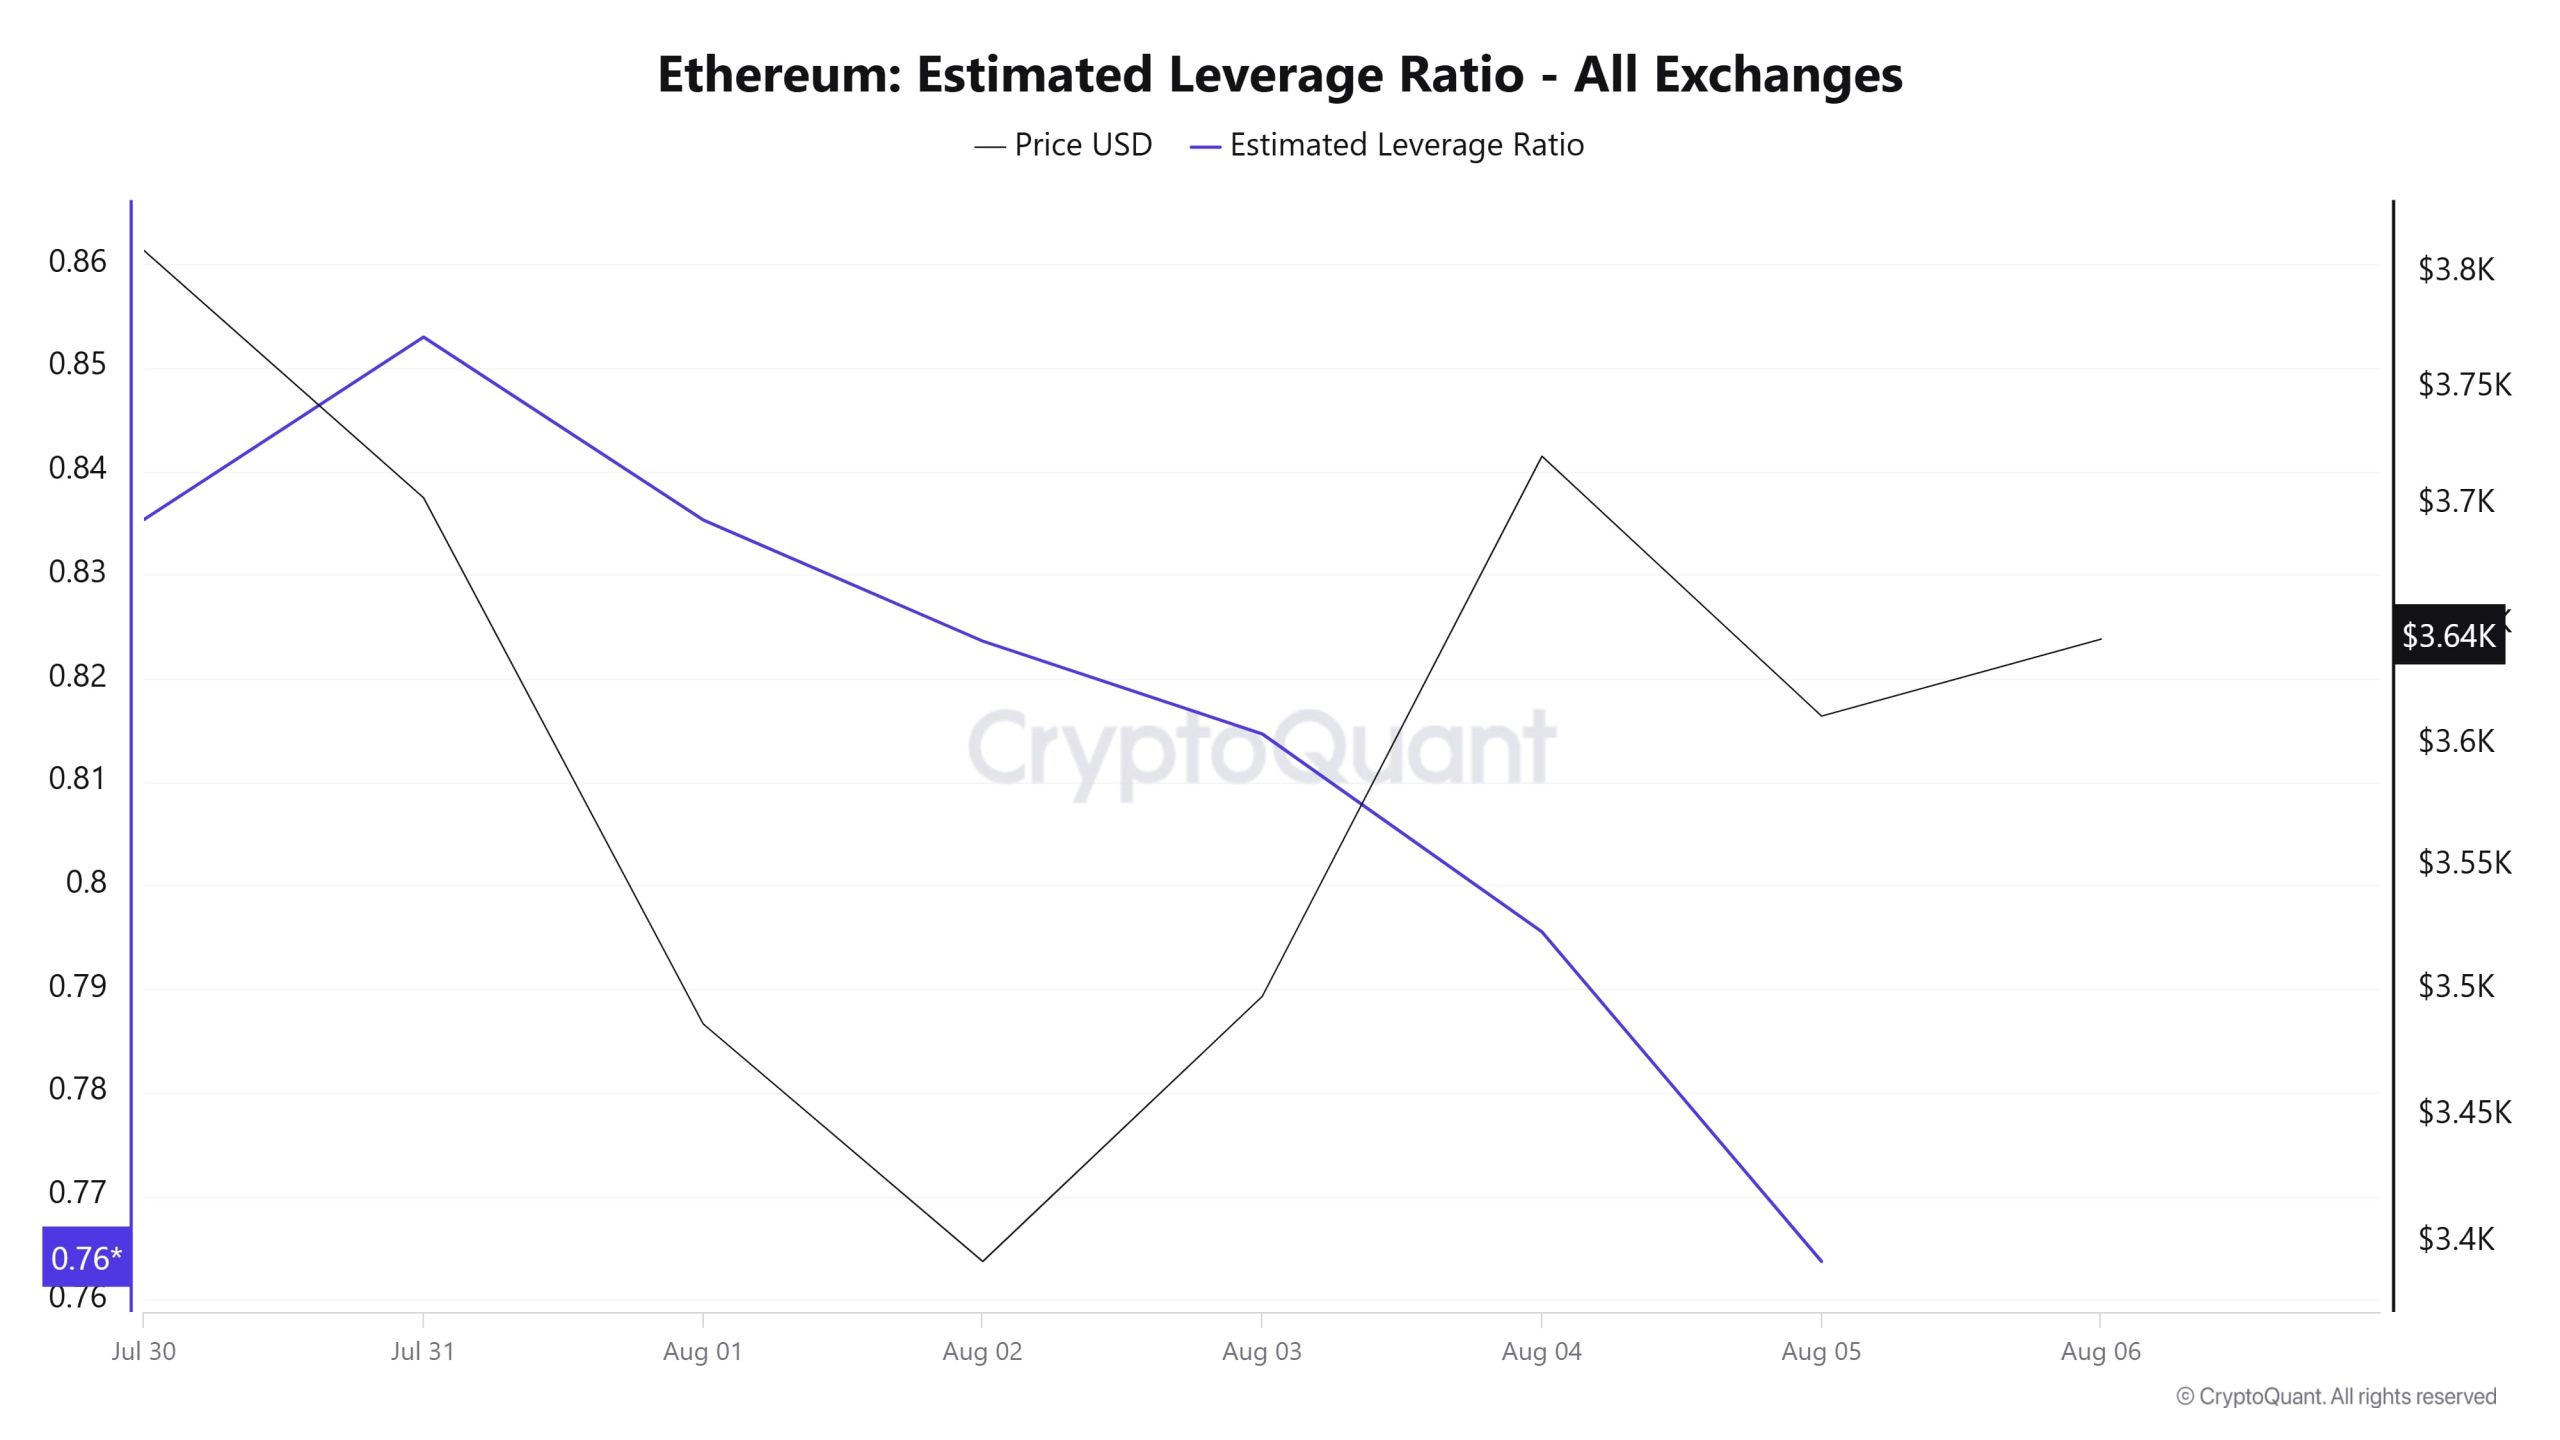
7 günlük süre zarfında metrik genel olarak düşüş göstermiştir. Sürecin başında 0,835 değerine sahip olan ELR (Estimated Leverage Ratio) gün sonrasında artış göstererek 31 Temmuz'da en yüksek değeri olan 0,852'ye ulaştı. Bu noktadan sonra metrik, bu yazının yazıldığı sırada 0,763'e gerilemiştir. Daha yüksek bir ELR, katılımcıların daha fazla risk üstlenmeye istekli olduğu anlamına gelir ve genellikle yükseliş koşullarına veya beklentilerine işaret eder. Bu rallilerin azalan rezervlerden de kaynaklanabileceği unutulmamalıdır. Ethereum rezervlerine baktığımızda, sürecin başında 19,03 milyon rezerv bulunurken, sürecin geri kalanında bu rakam azaldı ve şu anda 18,93 milyon olarak görülüyor. Aynı zamanda Ethereum'un Açık Faizi de sürecin başında 55,64 milyar dolar olarak görülüyor. An itibariyle süreçte hacim azaldı ve açık faiz değeri 47,27 milyar dolar olarak göze çarptı. Tüm bu verilerle birlikte ELR metriği sürecin büyük bir kısmında geri çekilmiş durumda. Varlığın fiyatı ise tüm bu verilerle birlikte sürecin en yüksek noktasını 31 Temmuz'da yaşadı ve 3.878 dolar olarak belirledi. En düşük nokta ise 3 Ağustos'ta 3.353 dolardan gerçekleşti. An itibariyle yatırımcı ve traders risk iştahı azalmış görünüyor. Bu durum ETH fiyatına da yansıyarak fiyatın şu anda yatay seyretmesine neden oldu. ELR oranındaki düşüş ve süreç boyunca açık ilginin azalması bize yatırımcıların hedge ettiğini gösteriyor. Sonuç olarak rezervlerdeki ve açık ilgideki düşüş, piyasanın iştahını kaybettiğini ve bearish eğiliminde olduğunu gösteriyor.
ETH Onchain Genel
| Metrik | Pozitif 📈 | Negatif 📉 | Nötr ➖ |
|---|---|---|---|
| Aktif Adresler | ✓ | ||
| Toplam Bahis Değeri | ✓ | ||
| Türevler | ✓ | ||
| Tedarik Dağıtımı | ✓ | ||
| Döviz Arz Oranı | ✓ | ||
| Döviz Rezervi | ✓ | ||
| Ücretler ve Gelirler | ✓ | ||
| Mayısısısınlı Bloklar | ✓ | ||
| İşlem | ✓ | ||
| Tahmini Kaldıraç Oranı | ✓ |
*Tablodaki ölçütler ve rehberlik , kendi başlarına, herhangi bir varlık için gelecekteki fiyat değişiklikleri beklentisini tanımlamaz veya ima etmez. Dijital varlıkların fiyatları birçok farklı değişkene bağlı olarak değişiklik gösterebilir. Onchain analizi ve ilgili kılavuz, yatırımcılara karar verme süreçlerinde yardımcı olmayı amaçlamaktadır ve yalnızca bu analizin sonuçlarına dayanarak finansal yatırımlar yapmak zararlı işlemlere neden olabilir. Tüm metrikler aynı anda olumlu, olumsuz veya nötr sonuç verse bile piyasa koşullarına göre beklenen sonuçlar görülmeyebilir. Raporu inceleyen yatırımcıların şu uyarıları dikkate almaları tavsiye edilir.
Yasal Uyarı
Bu dokümanda yer alan yatırım bilgi, yorum ve tavsiyeleri yatırım danışmanlığı hizmeti niteliği taşımamaktadır. Yatırım danışmanlığı hizmeti, yetkili kuruluşlar tarafından kişilerin risk ve getiri tercihleri dikkate alınarak kişiye özel olarak verilir. Bu dokümanda yer alan yorum ve tavsiyeler genel niteliktedir. Bu tavsiyeler mali durumunuz ile risk ve getiri tercihlerinize uygun olmayabilir. Bu nedenle, sadece bu dokümanda yer alan bilgilere dayanarak yatırım kararı vermeniz beklentilerinize uygun sonuçlar doğurmayabilir.
NOT: Ethereum onchain analizinde kullanılan tüm veriler Cryptoqaunt'a dayanmaktadır.