
Weekly Ethereum Onchain Report
Active Addresses
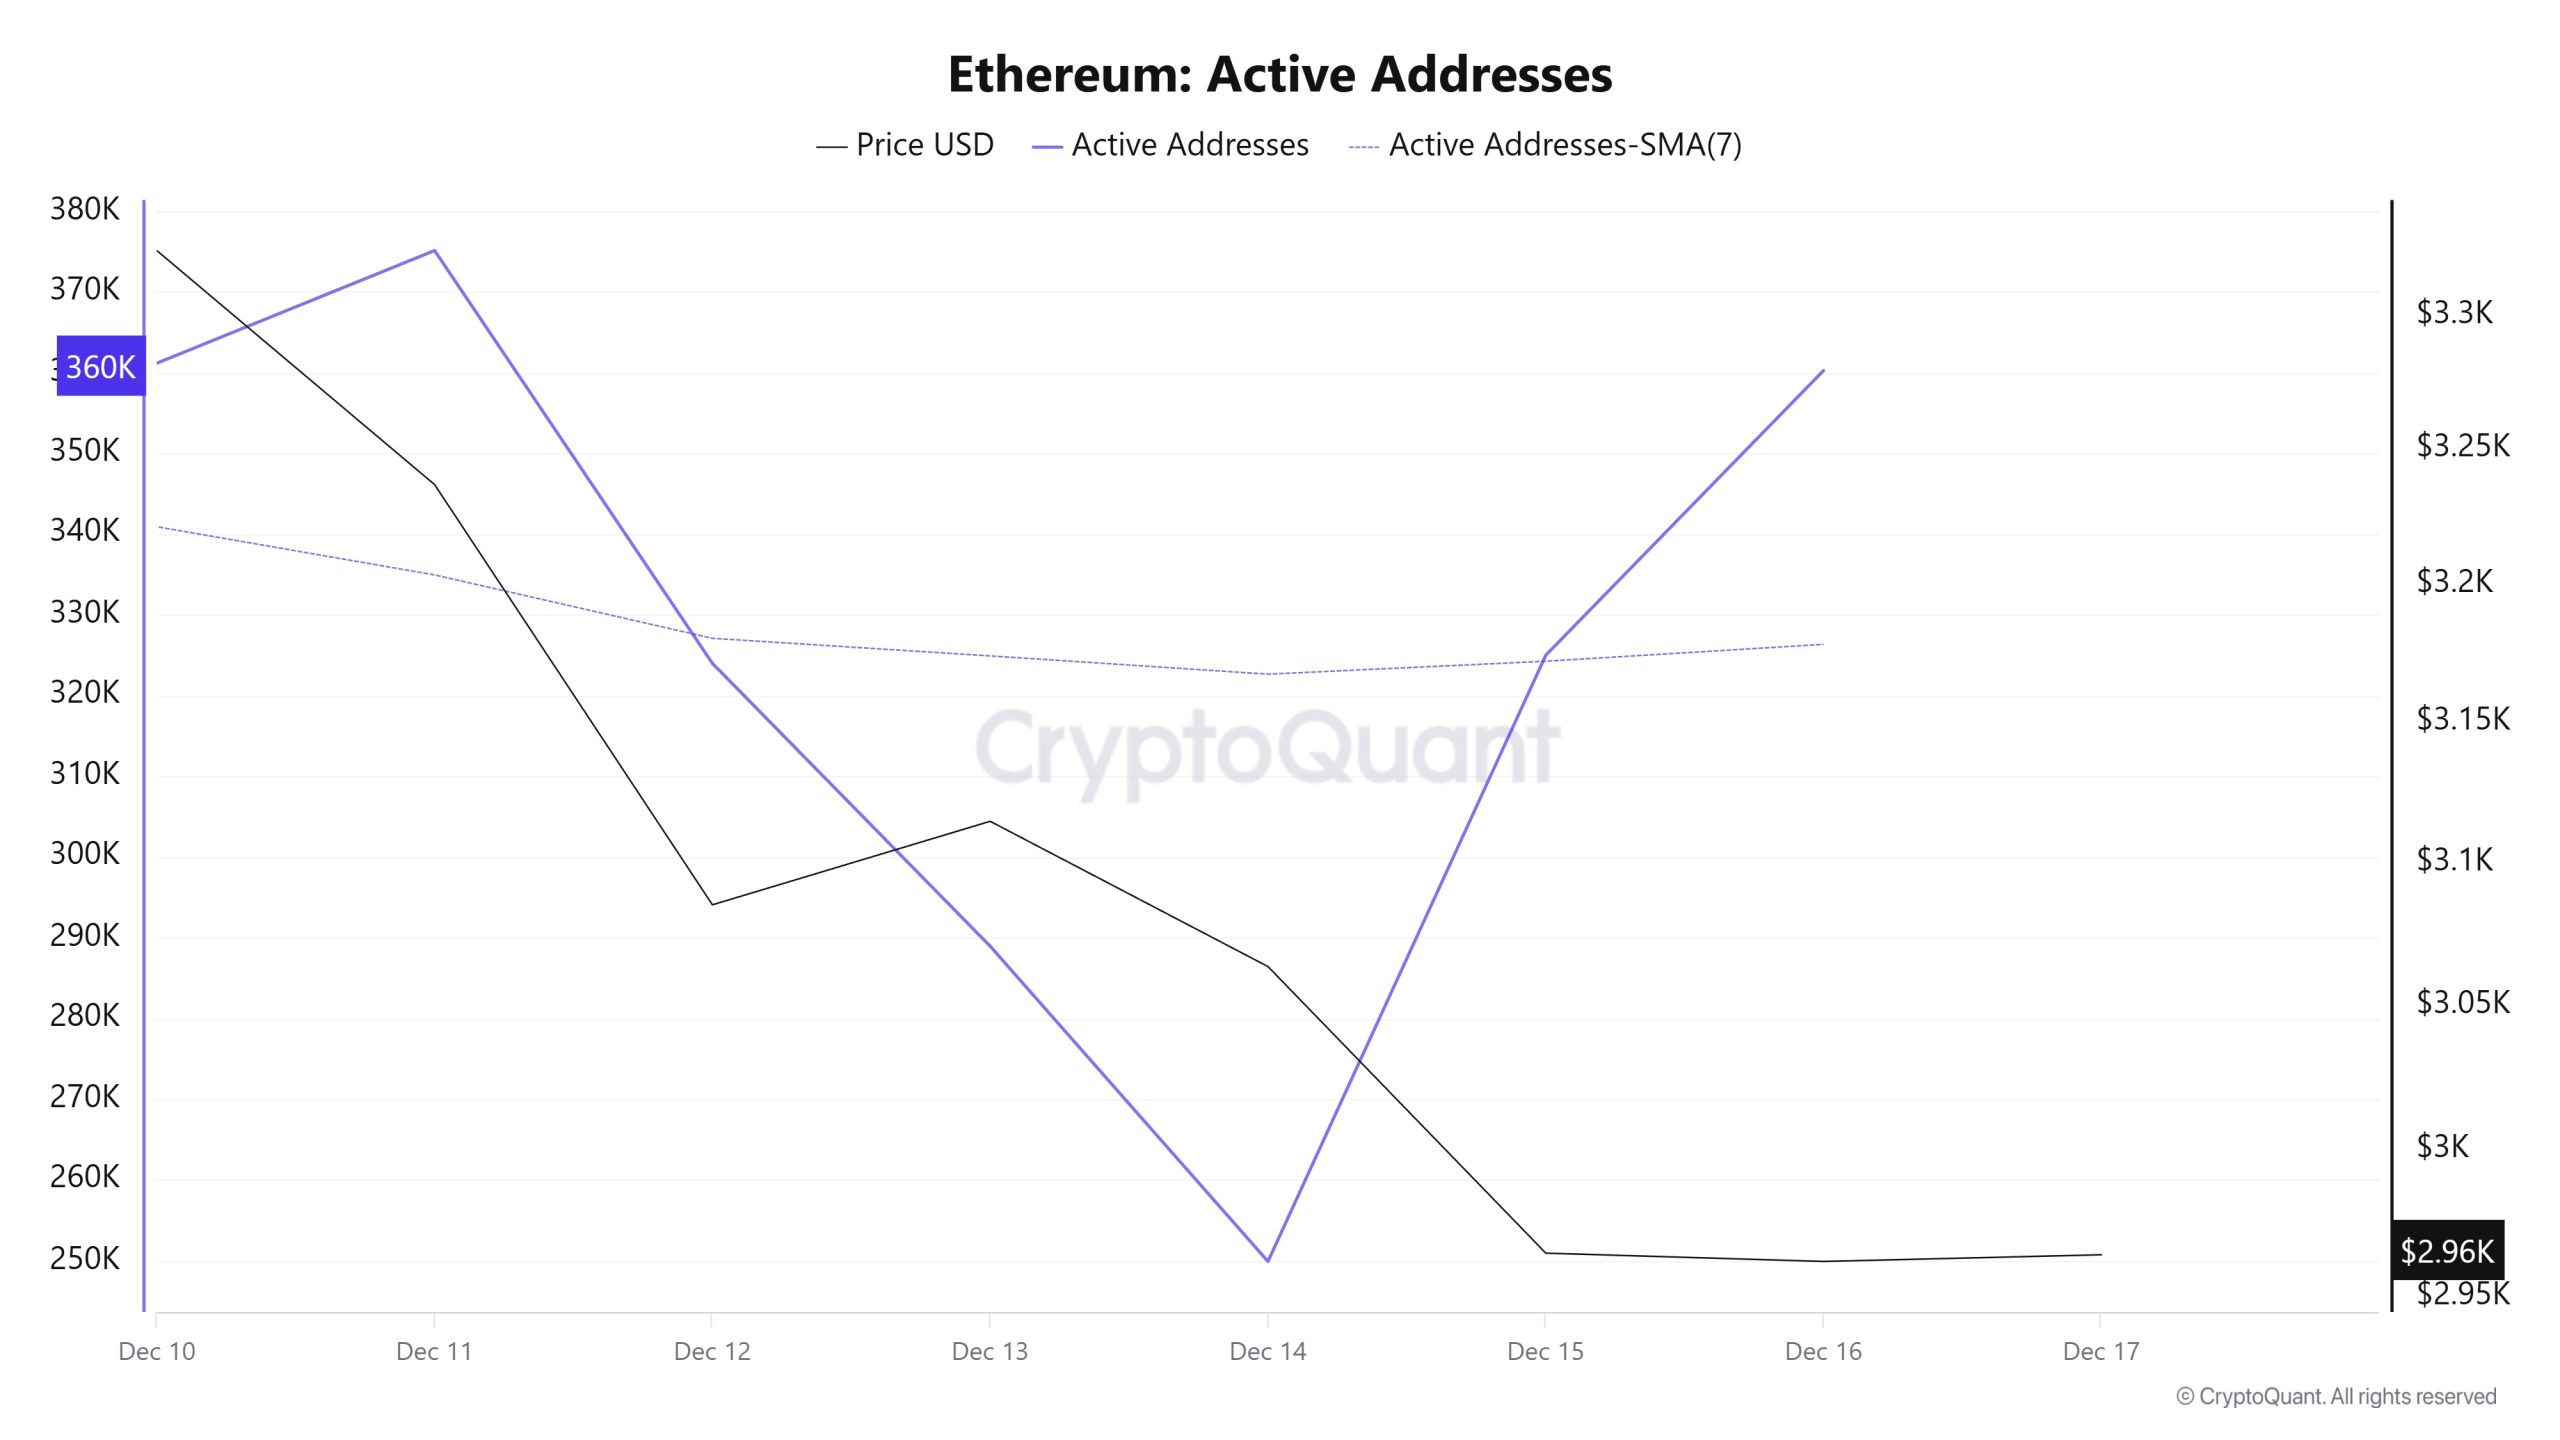
Between December 10 and December 17, a total of 375,128 active addresses were added to the Ethereum network. During this period, the Ethereum price fell from $3,324 to $2,964. On December 13, in particular, when the price hit the active address, a certain decline was observed in both the active address count and the price point. When examining the 7-day simple moving average (SMA), it can be seen that the Ethereum price is generally trending downward.
Active Sending Addresses
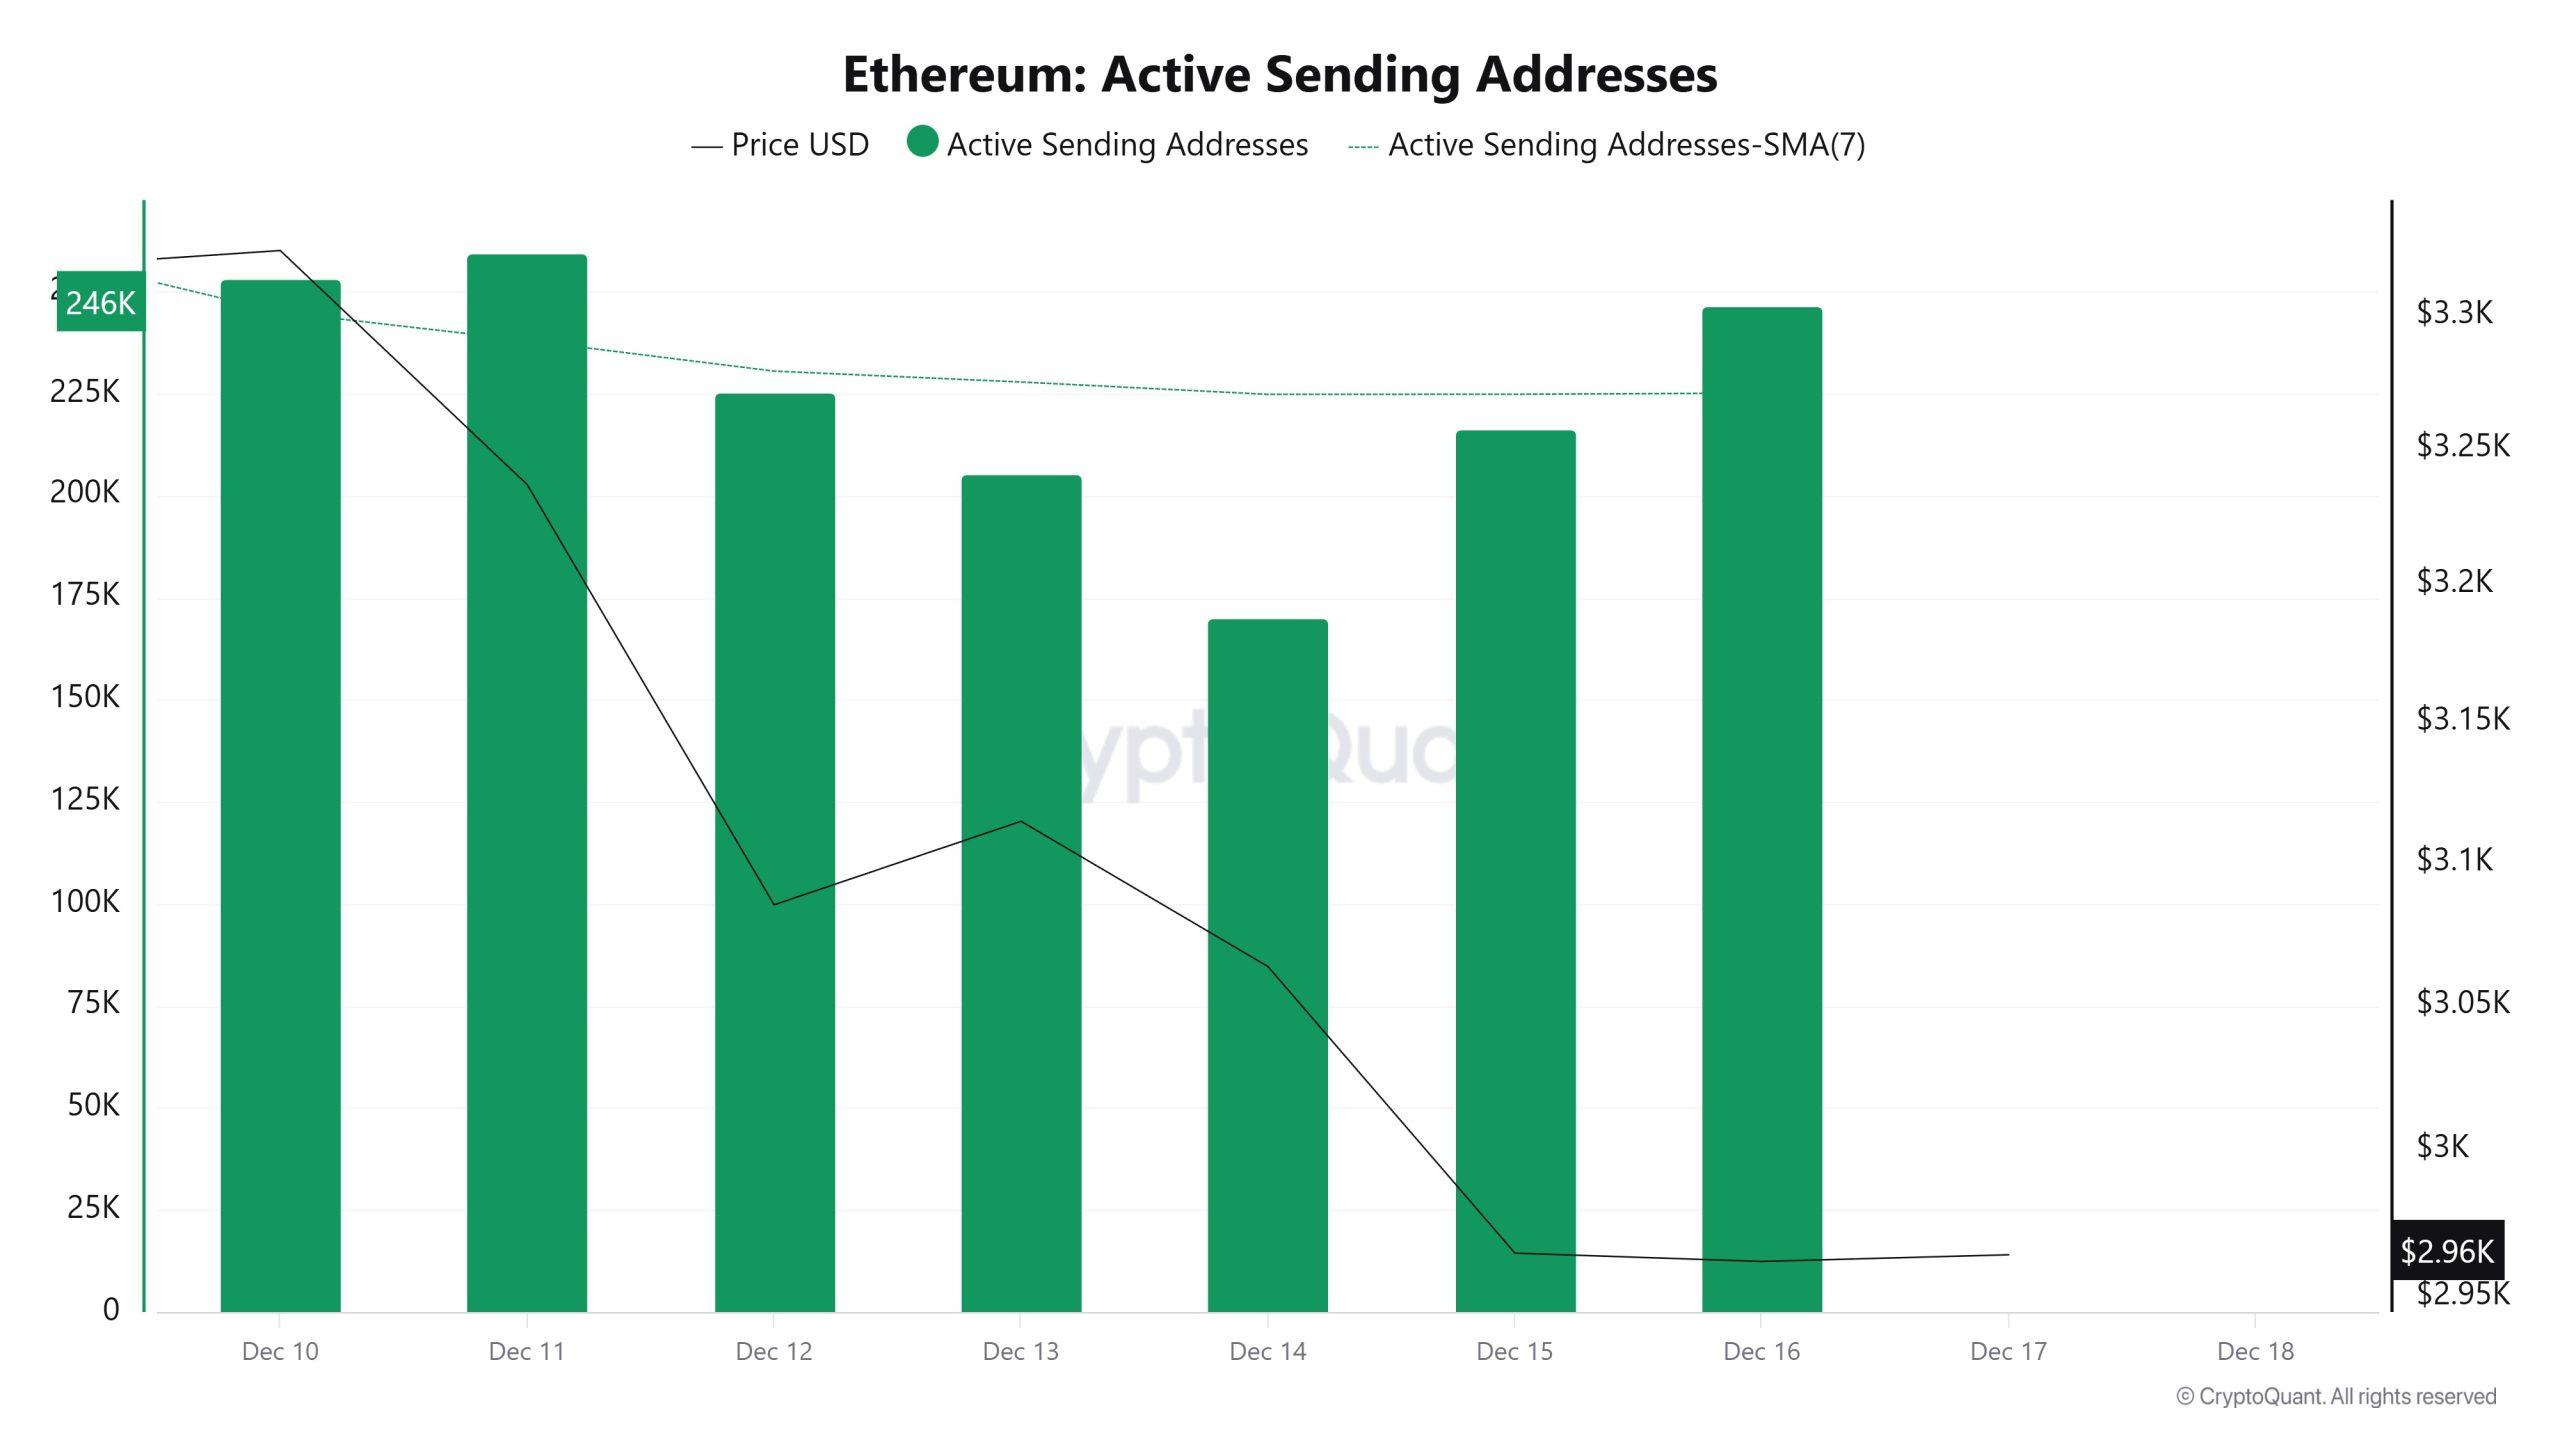
Between December 10 and December 17, high levels of active sending activity were observed in active sending addresses along with the Black Line (price line). On the day the price reached its highest level on a weekly basis, active sending addresses reached 259,452.
Active Receiving Addresses
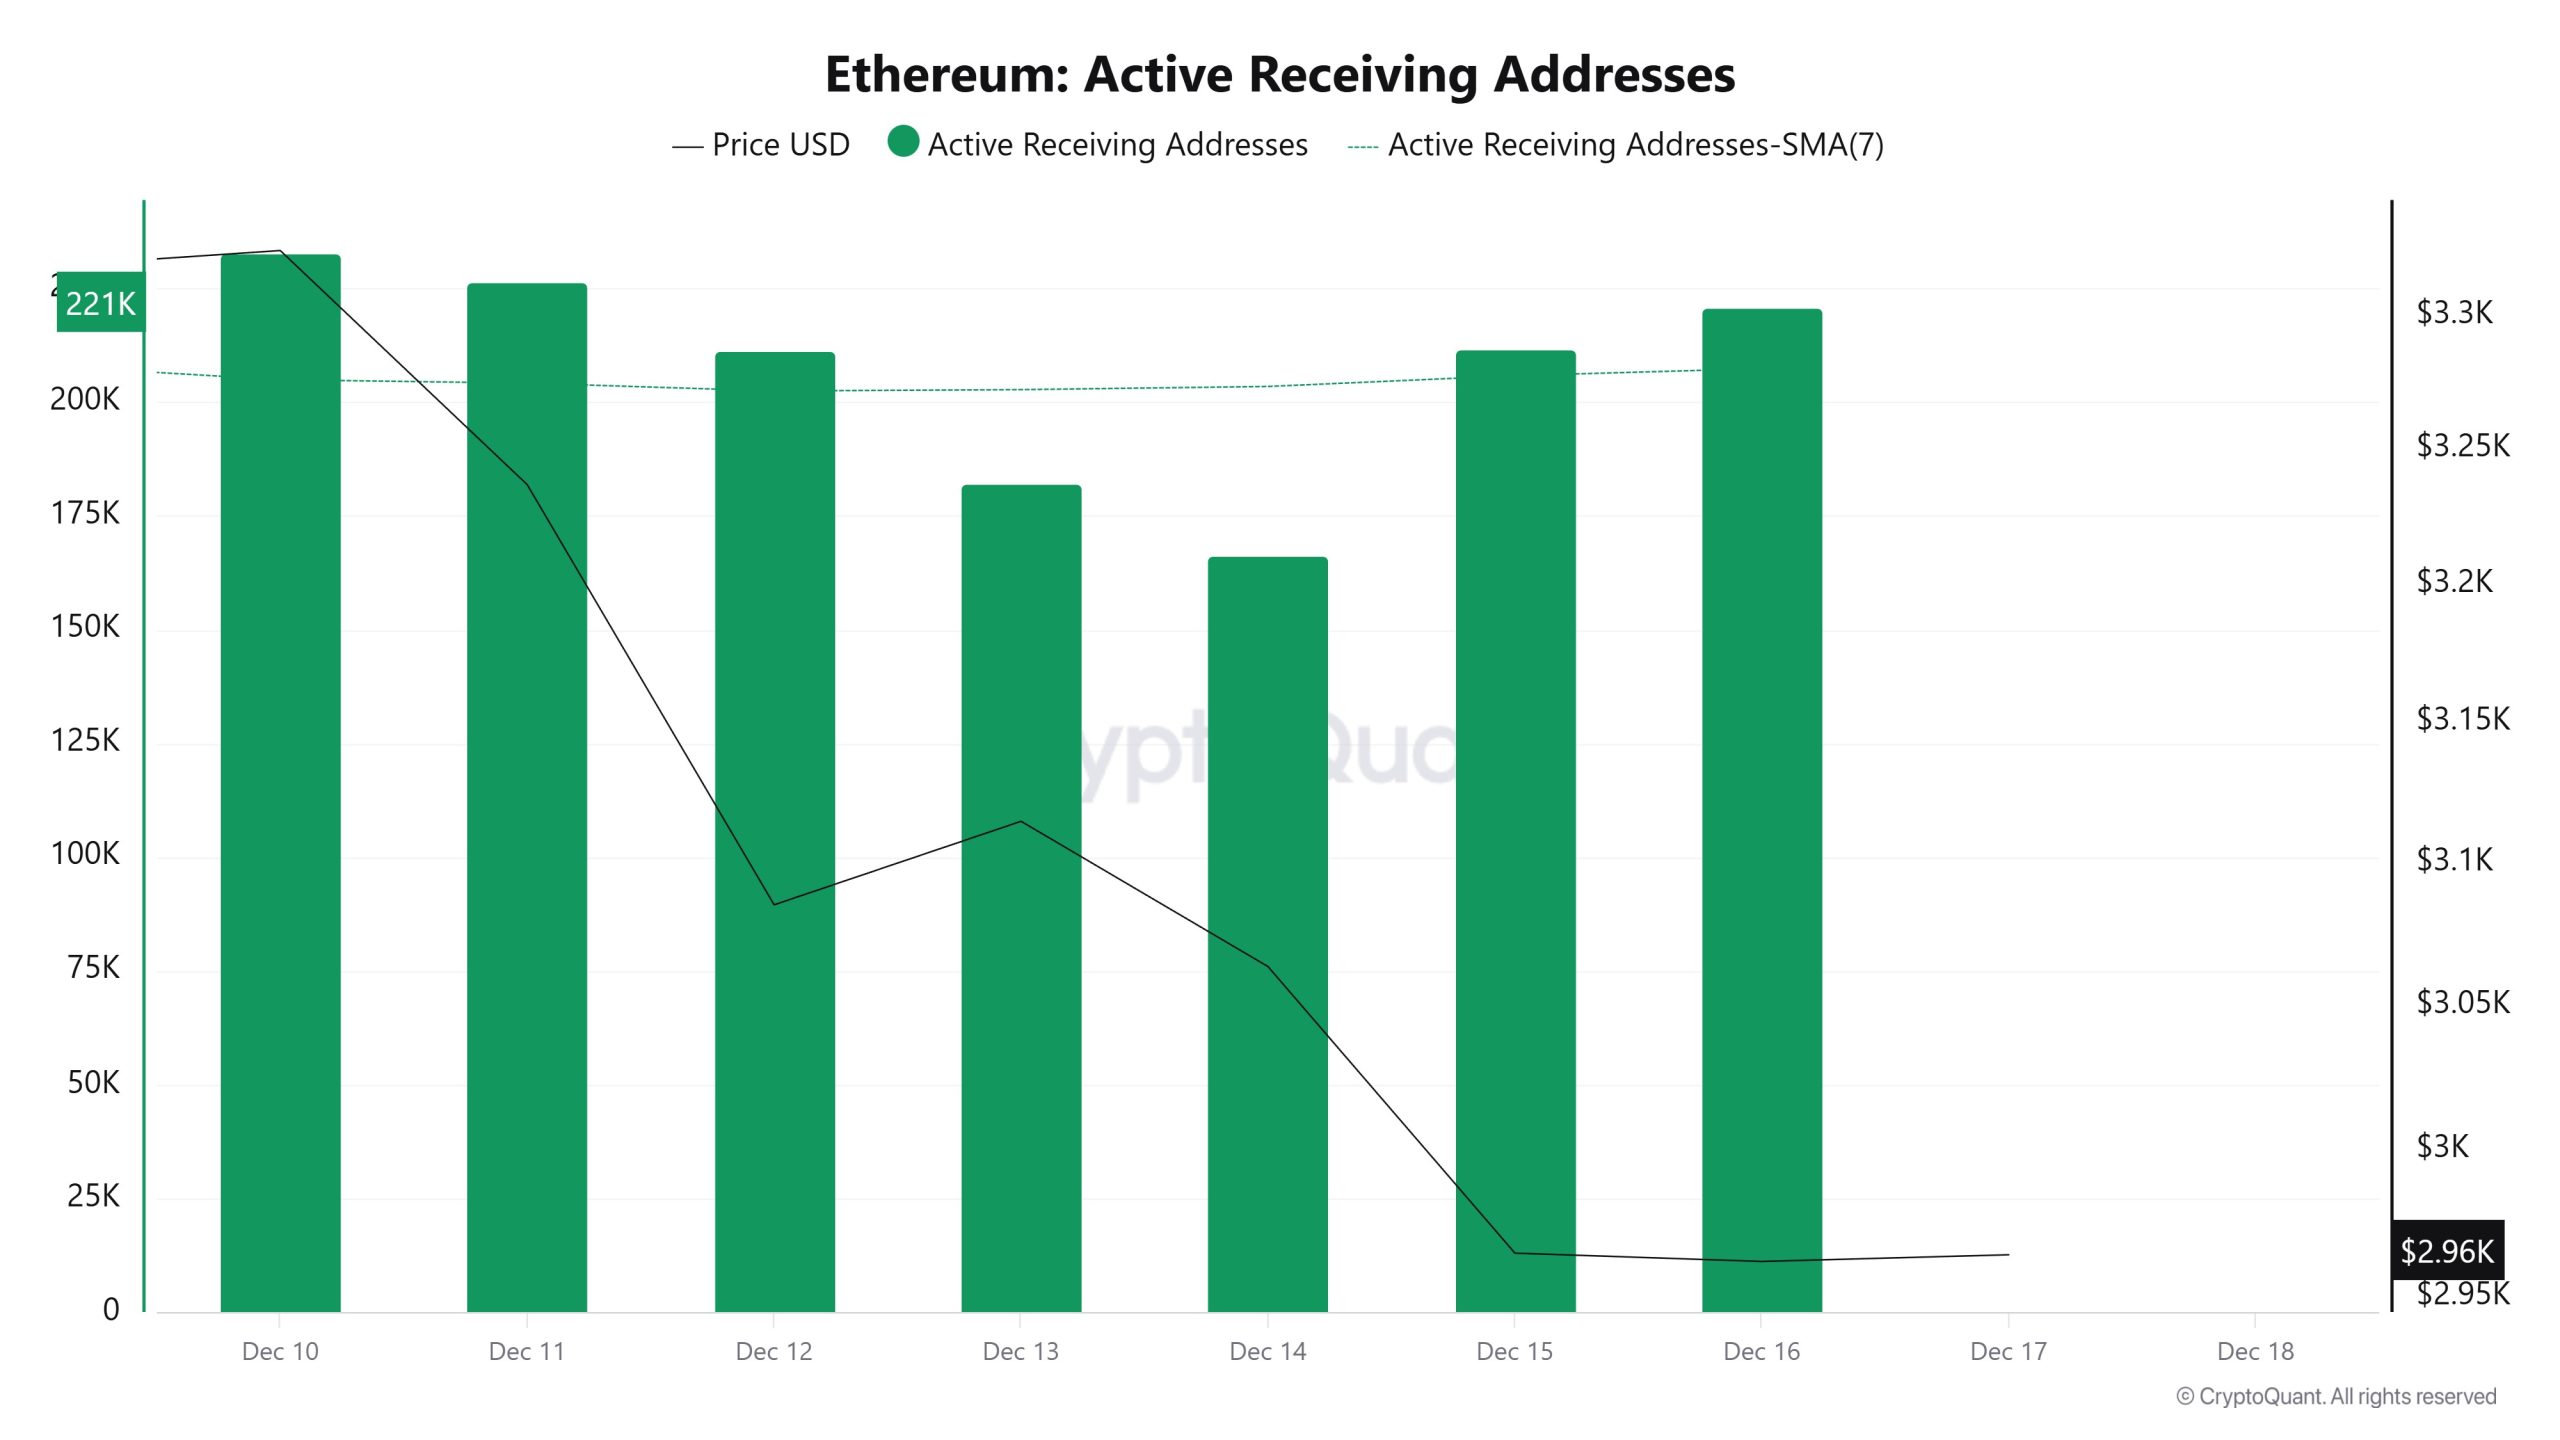
Between December 10 and December 17, while there was no significant increase in active receiving addresses, the price was seen to move downward. On the day the price reached its highest level, active receiving addresses reached 232,813, indicating an increase in purchases.
Total Value Staked
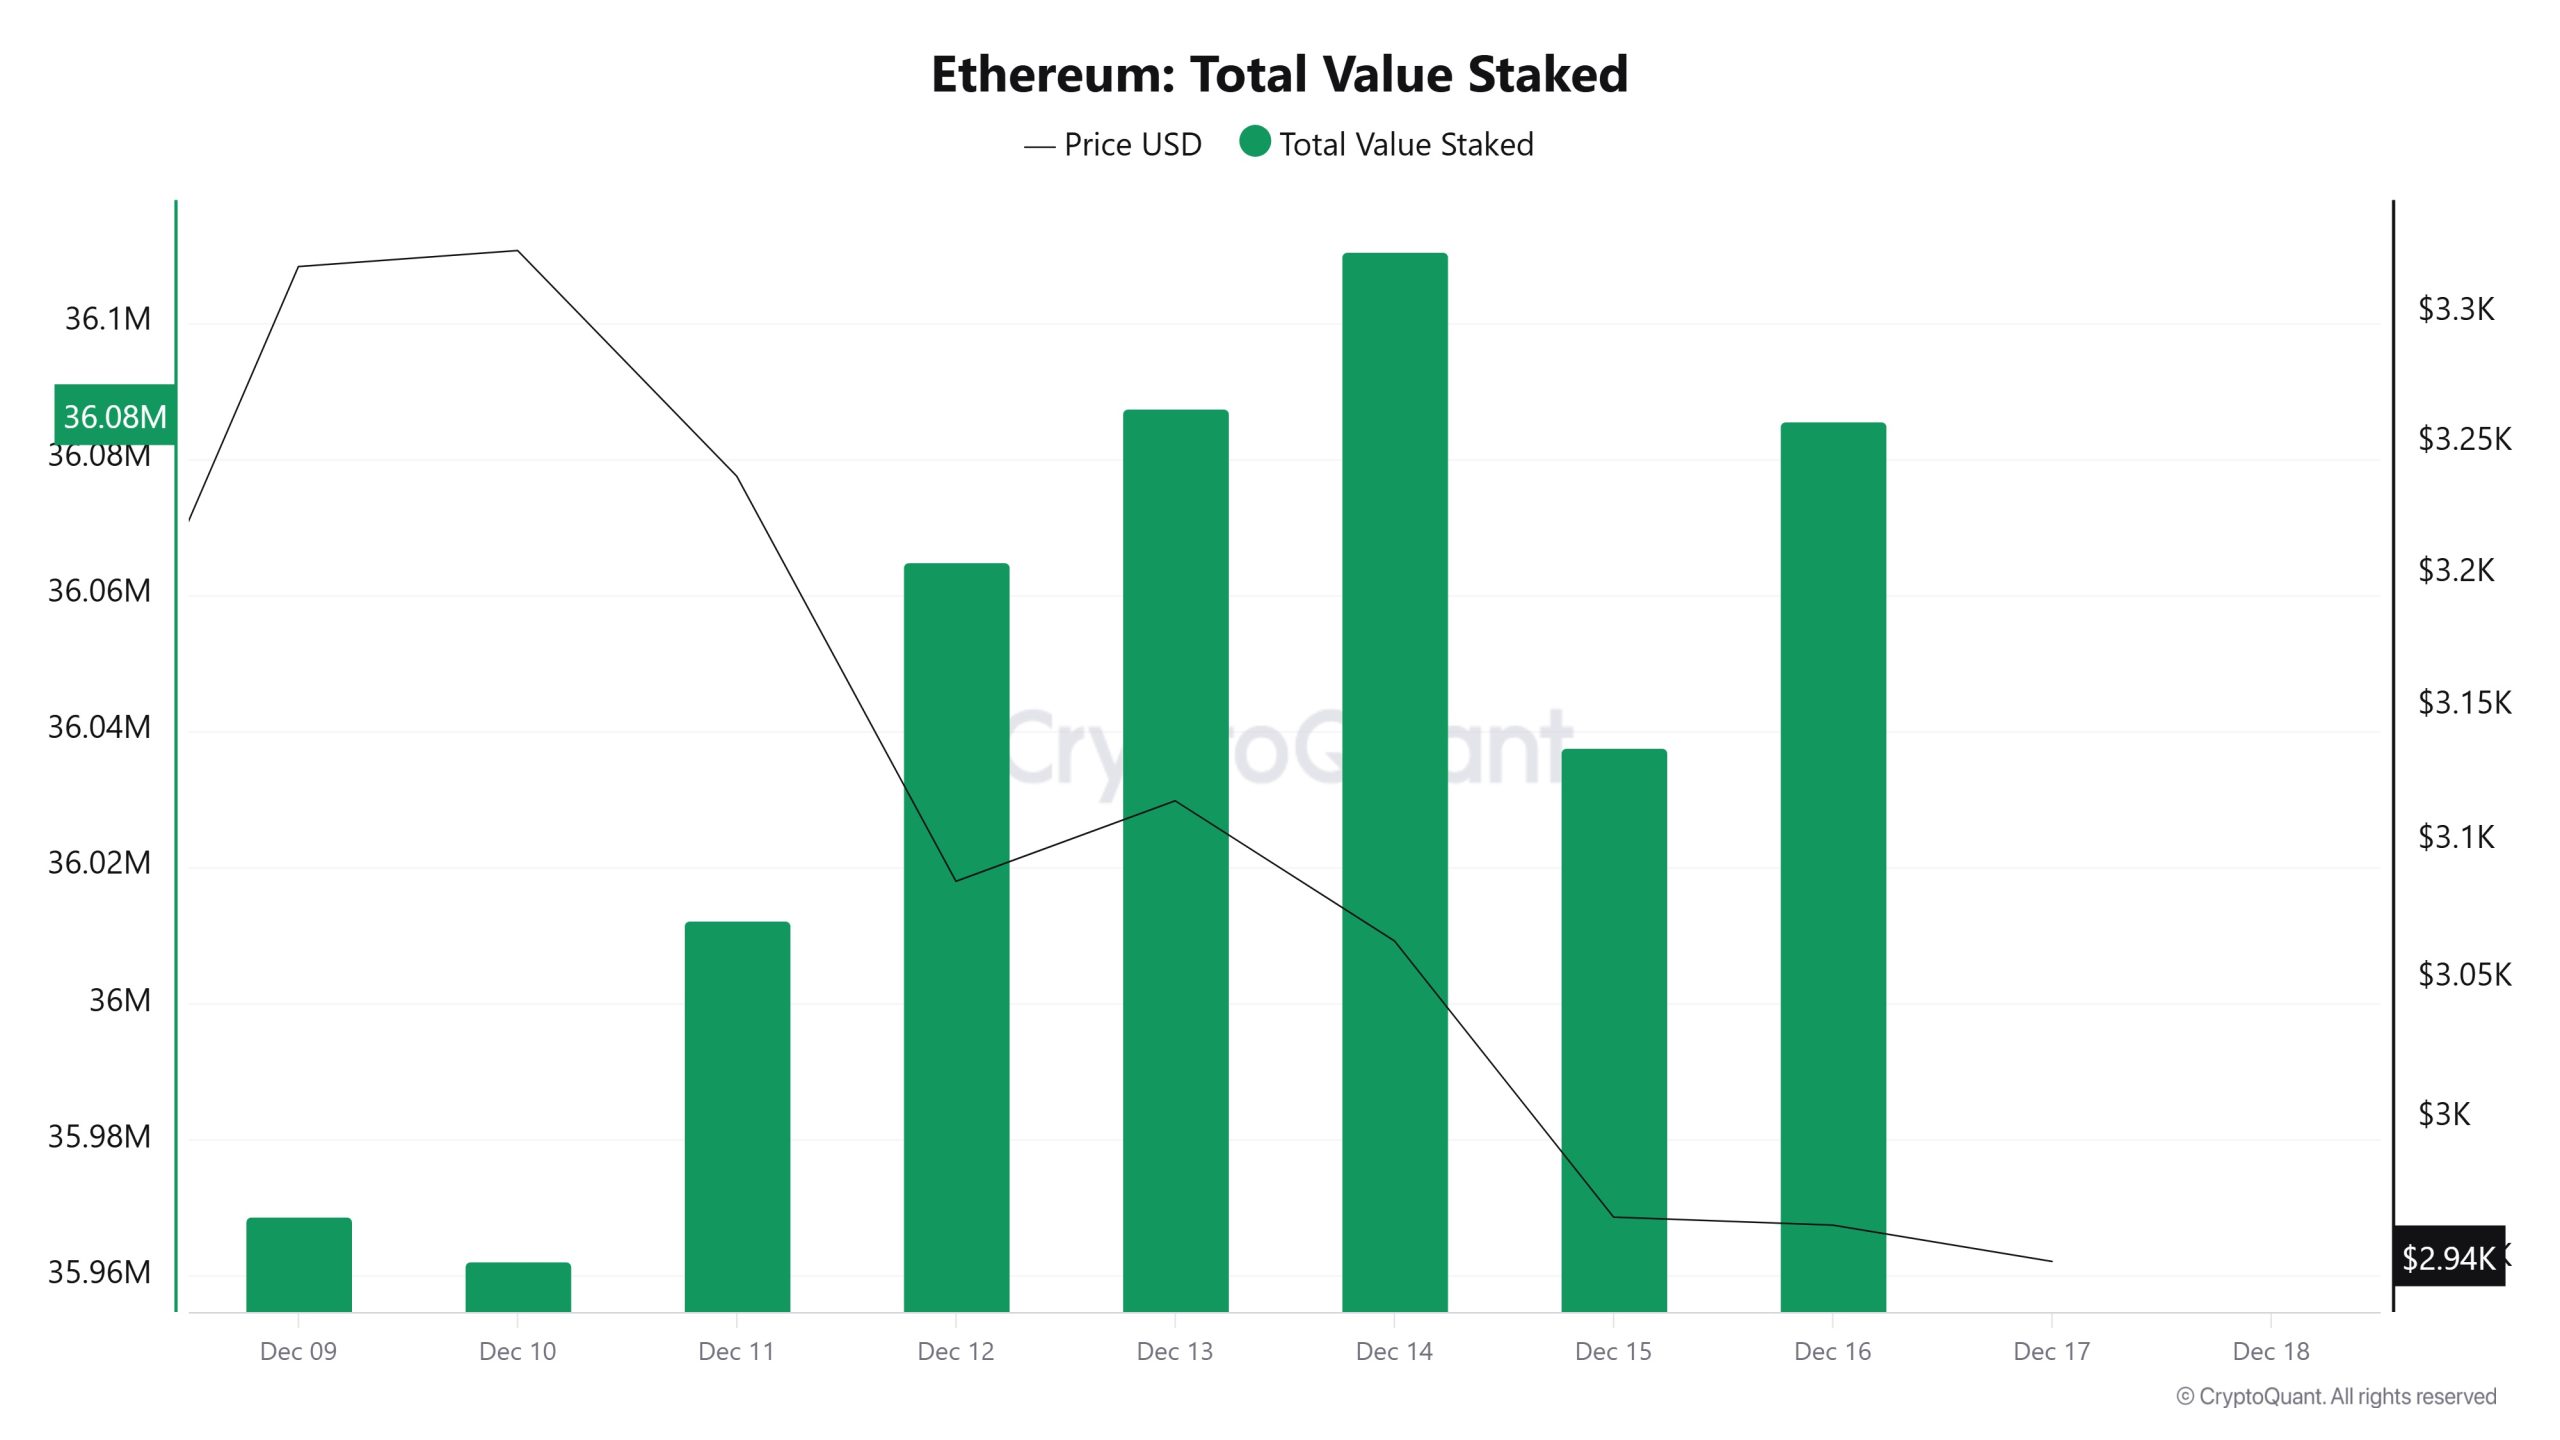
On December 10, while the ETH price was trading at $3,324, the Total Value Staked was at 35,962,104. As of December 16, the ETH price fell to $2,961, recording a 10.92% decline, while Total Value Staked rose to 36,085,699, recording a 0.34% increase.
Staking Inflows
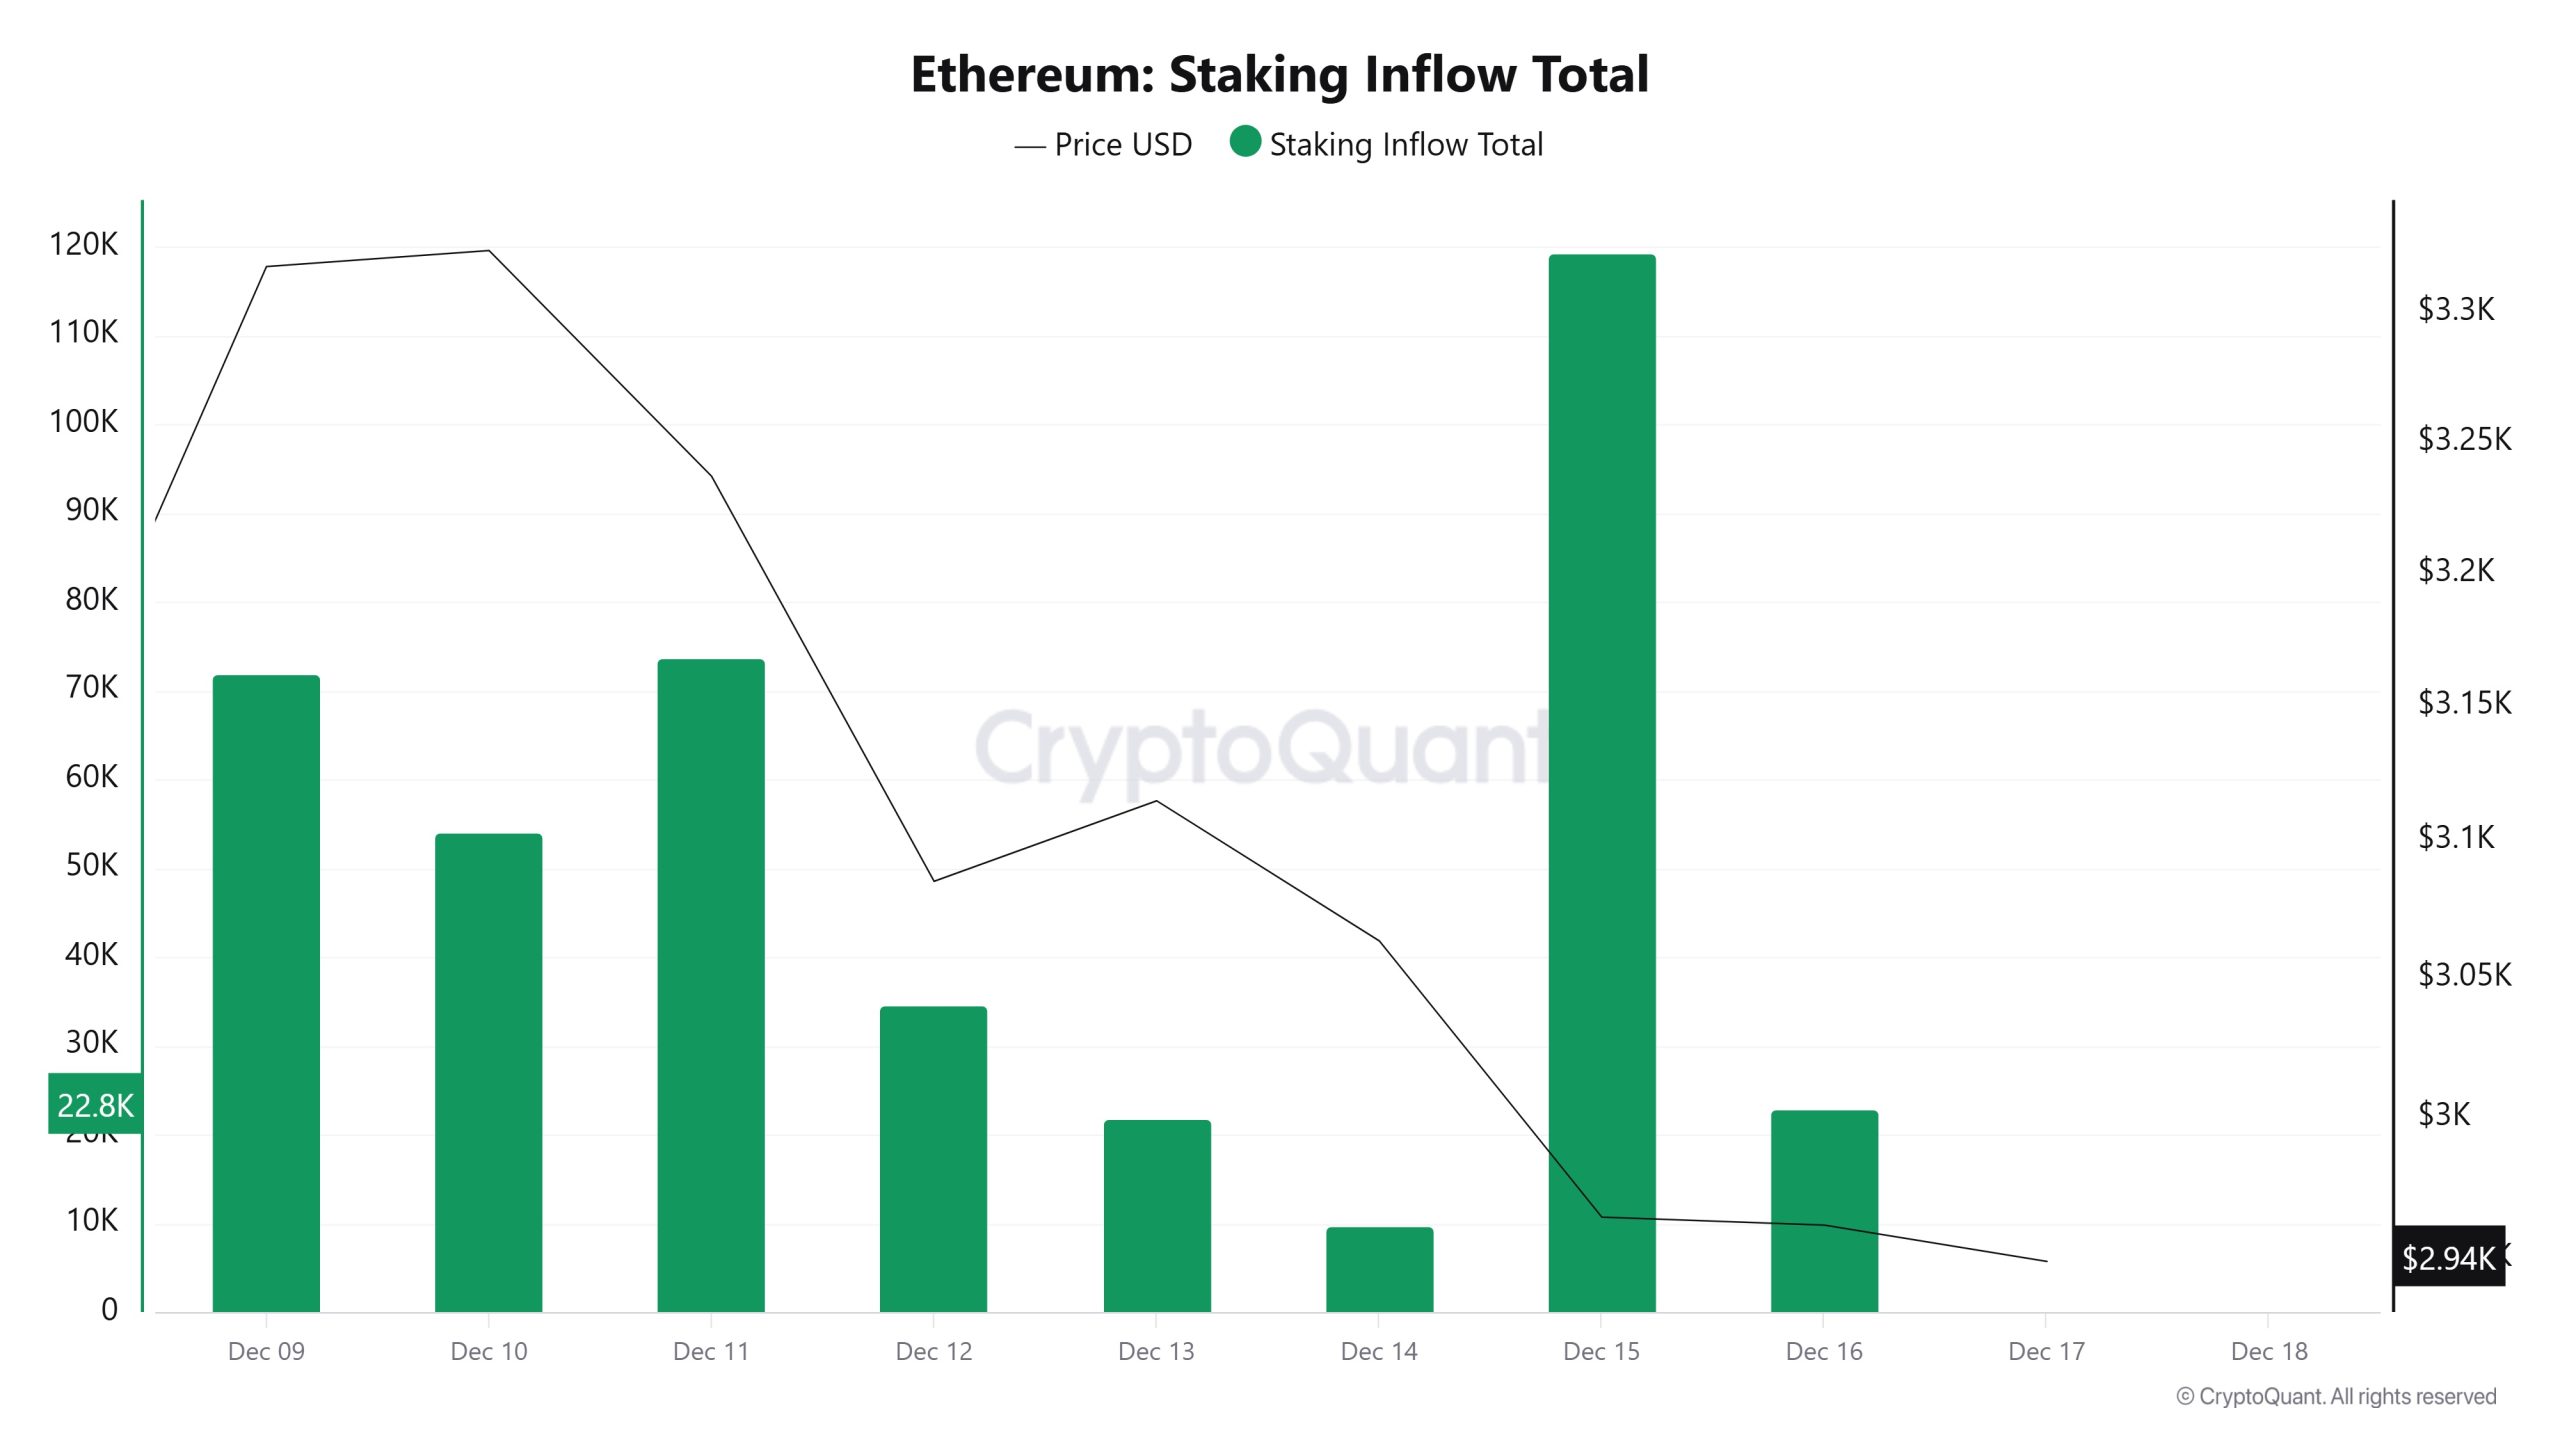
On December 10, while the ETH price was trading at $3,324, Staking Inflow was at 54,083. As of December 16, while the ETH price fell to $2,961, Staking Inflow dropped to 22,870, recording a decrease of 57.72%.
Derivatives
Open Interest
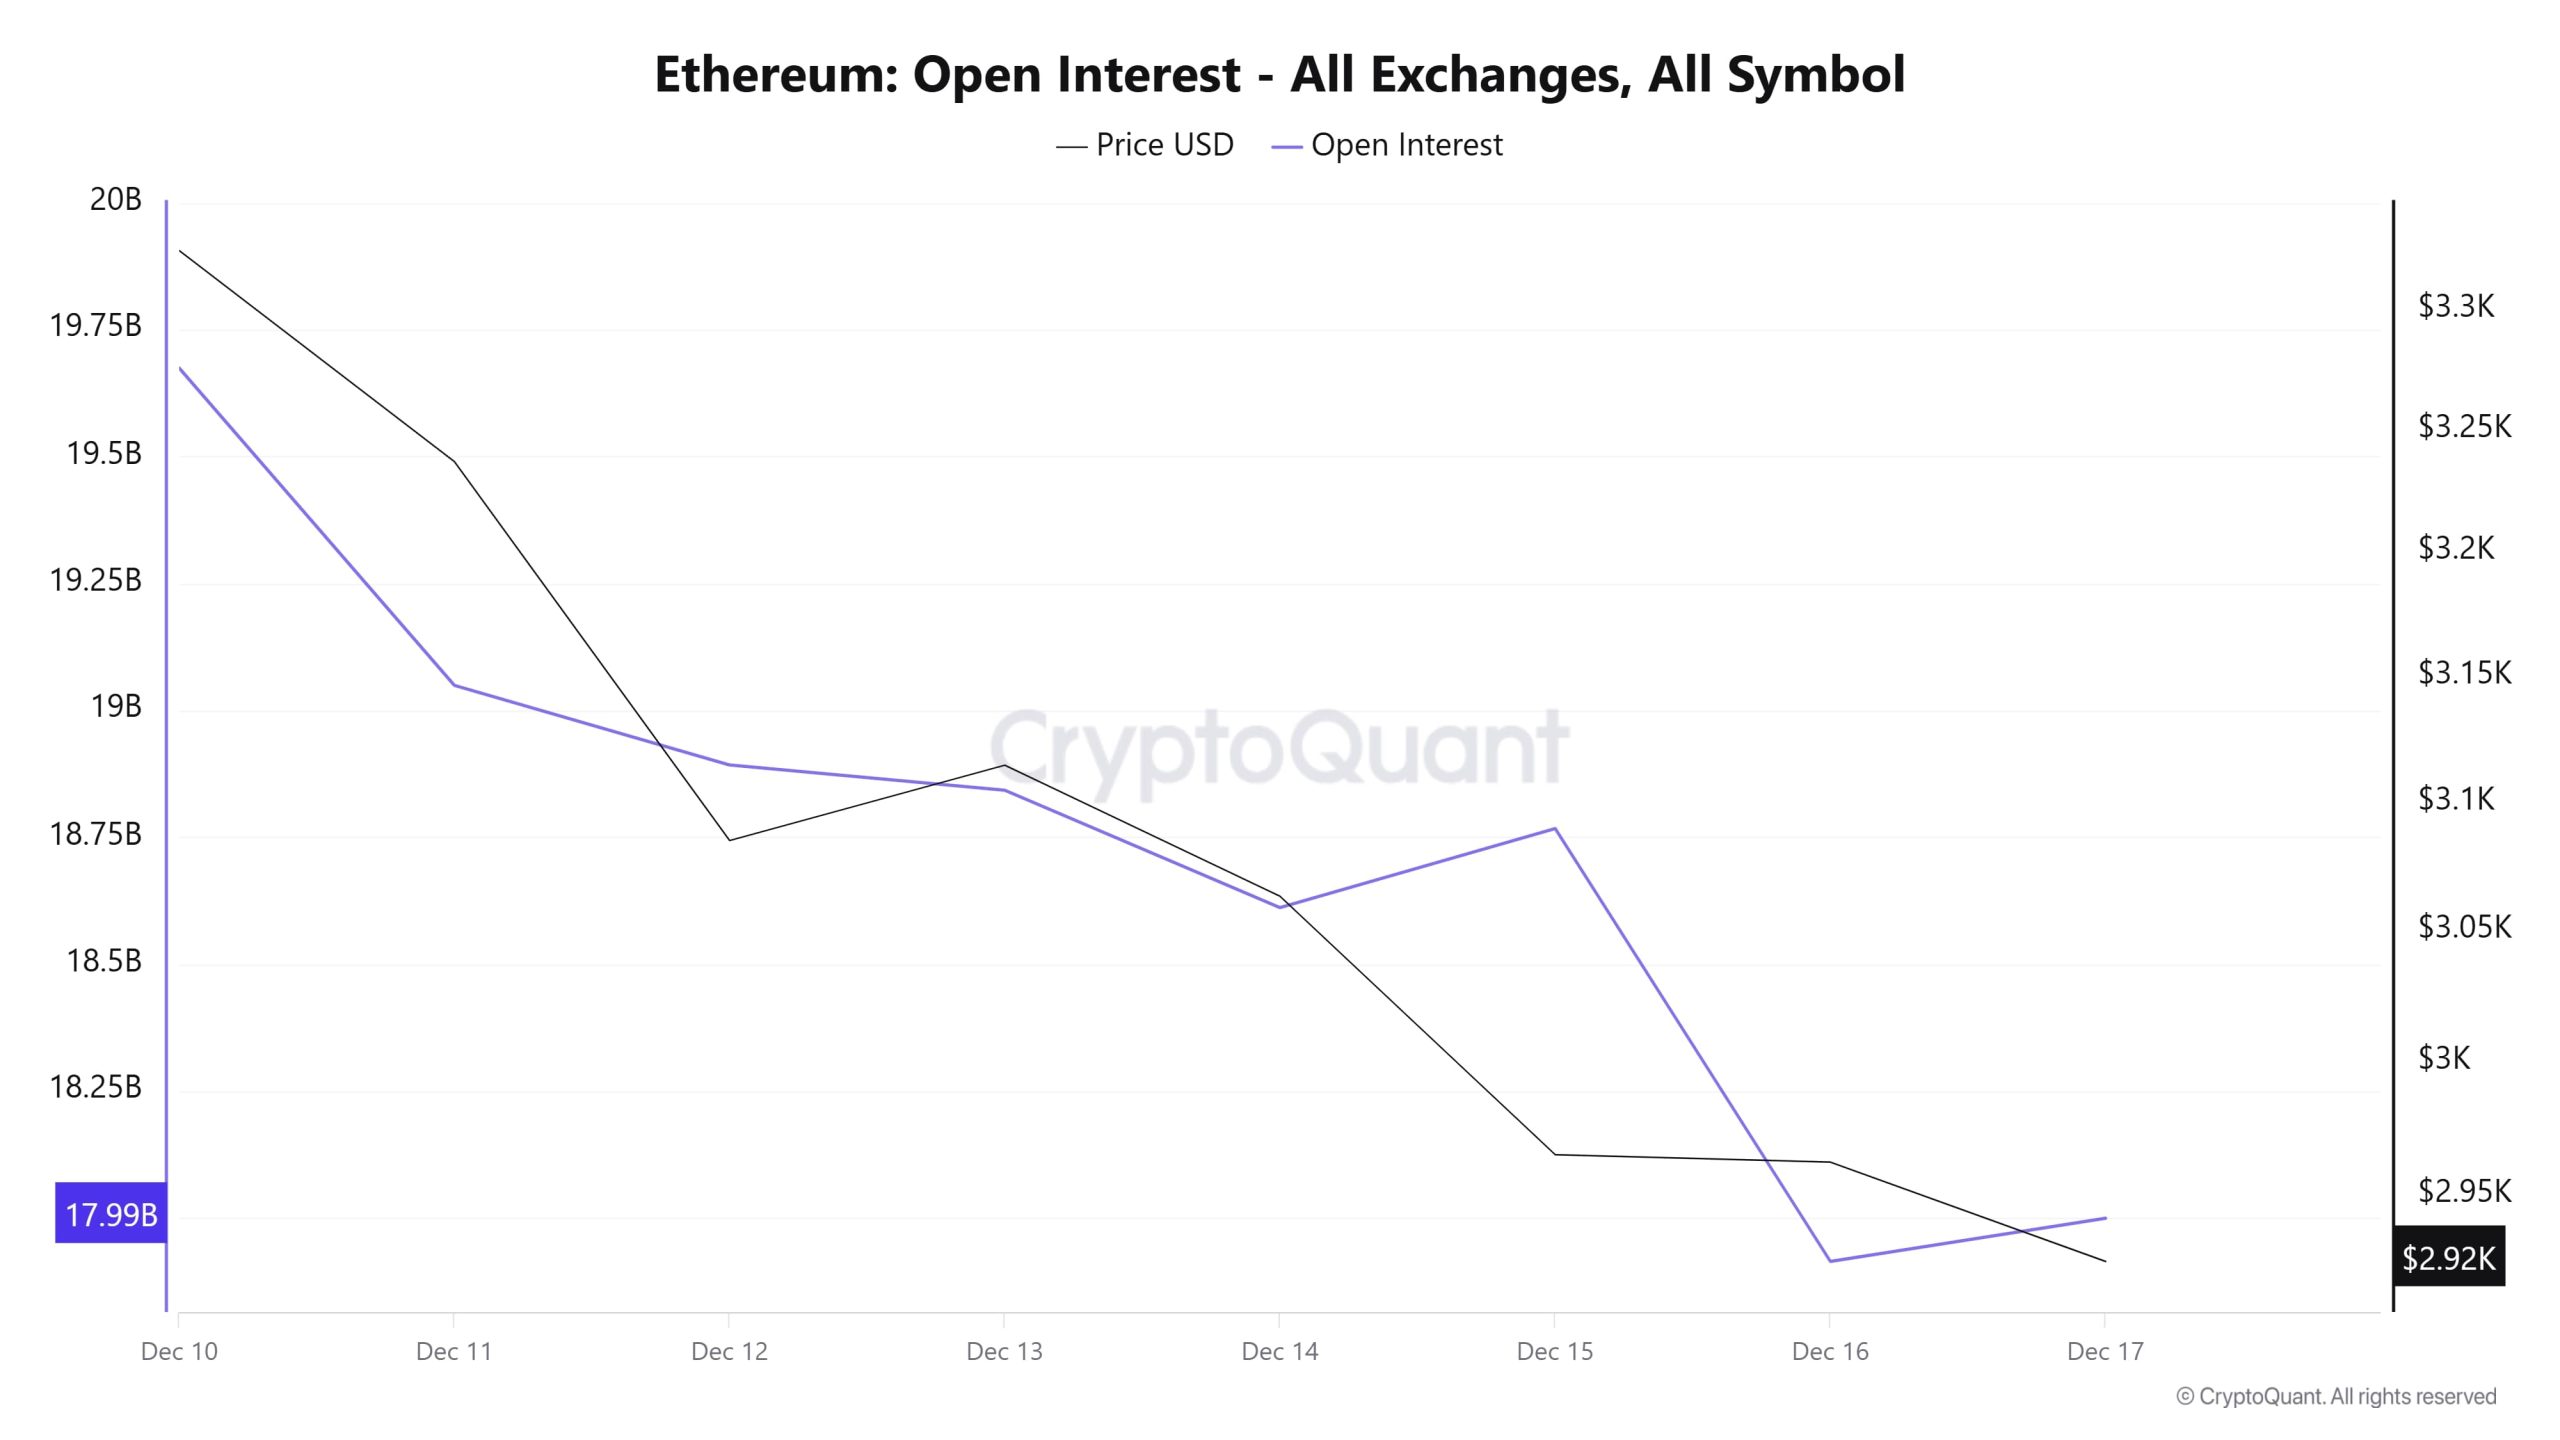
When examining the chart, it is noteworthy that open interest has been moving in a downward direction, correlated with the ETH price since December 10. During this period, the ETH price retreated to the $2,920 level. This volatility indicates that long positions have been closed and the market has shifted to a more cautious stance.
The overall picture reveals that leveraged trading intensity has decreased in the Ethereum market in the short term, and price movements are progressing with a greater emphasis on spot trading.
Funding Rate
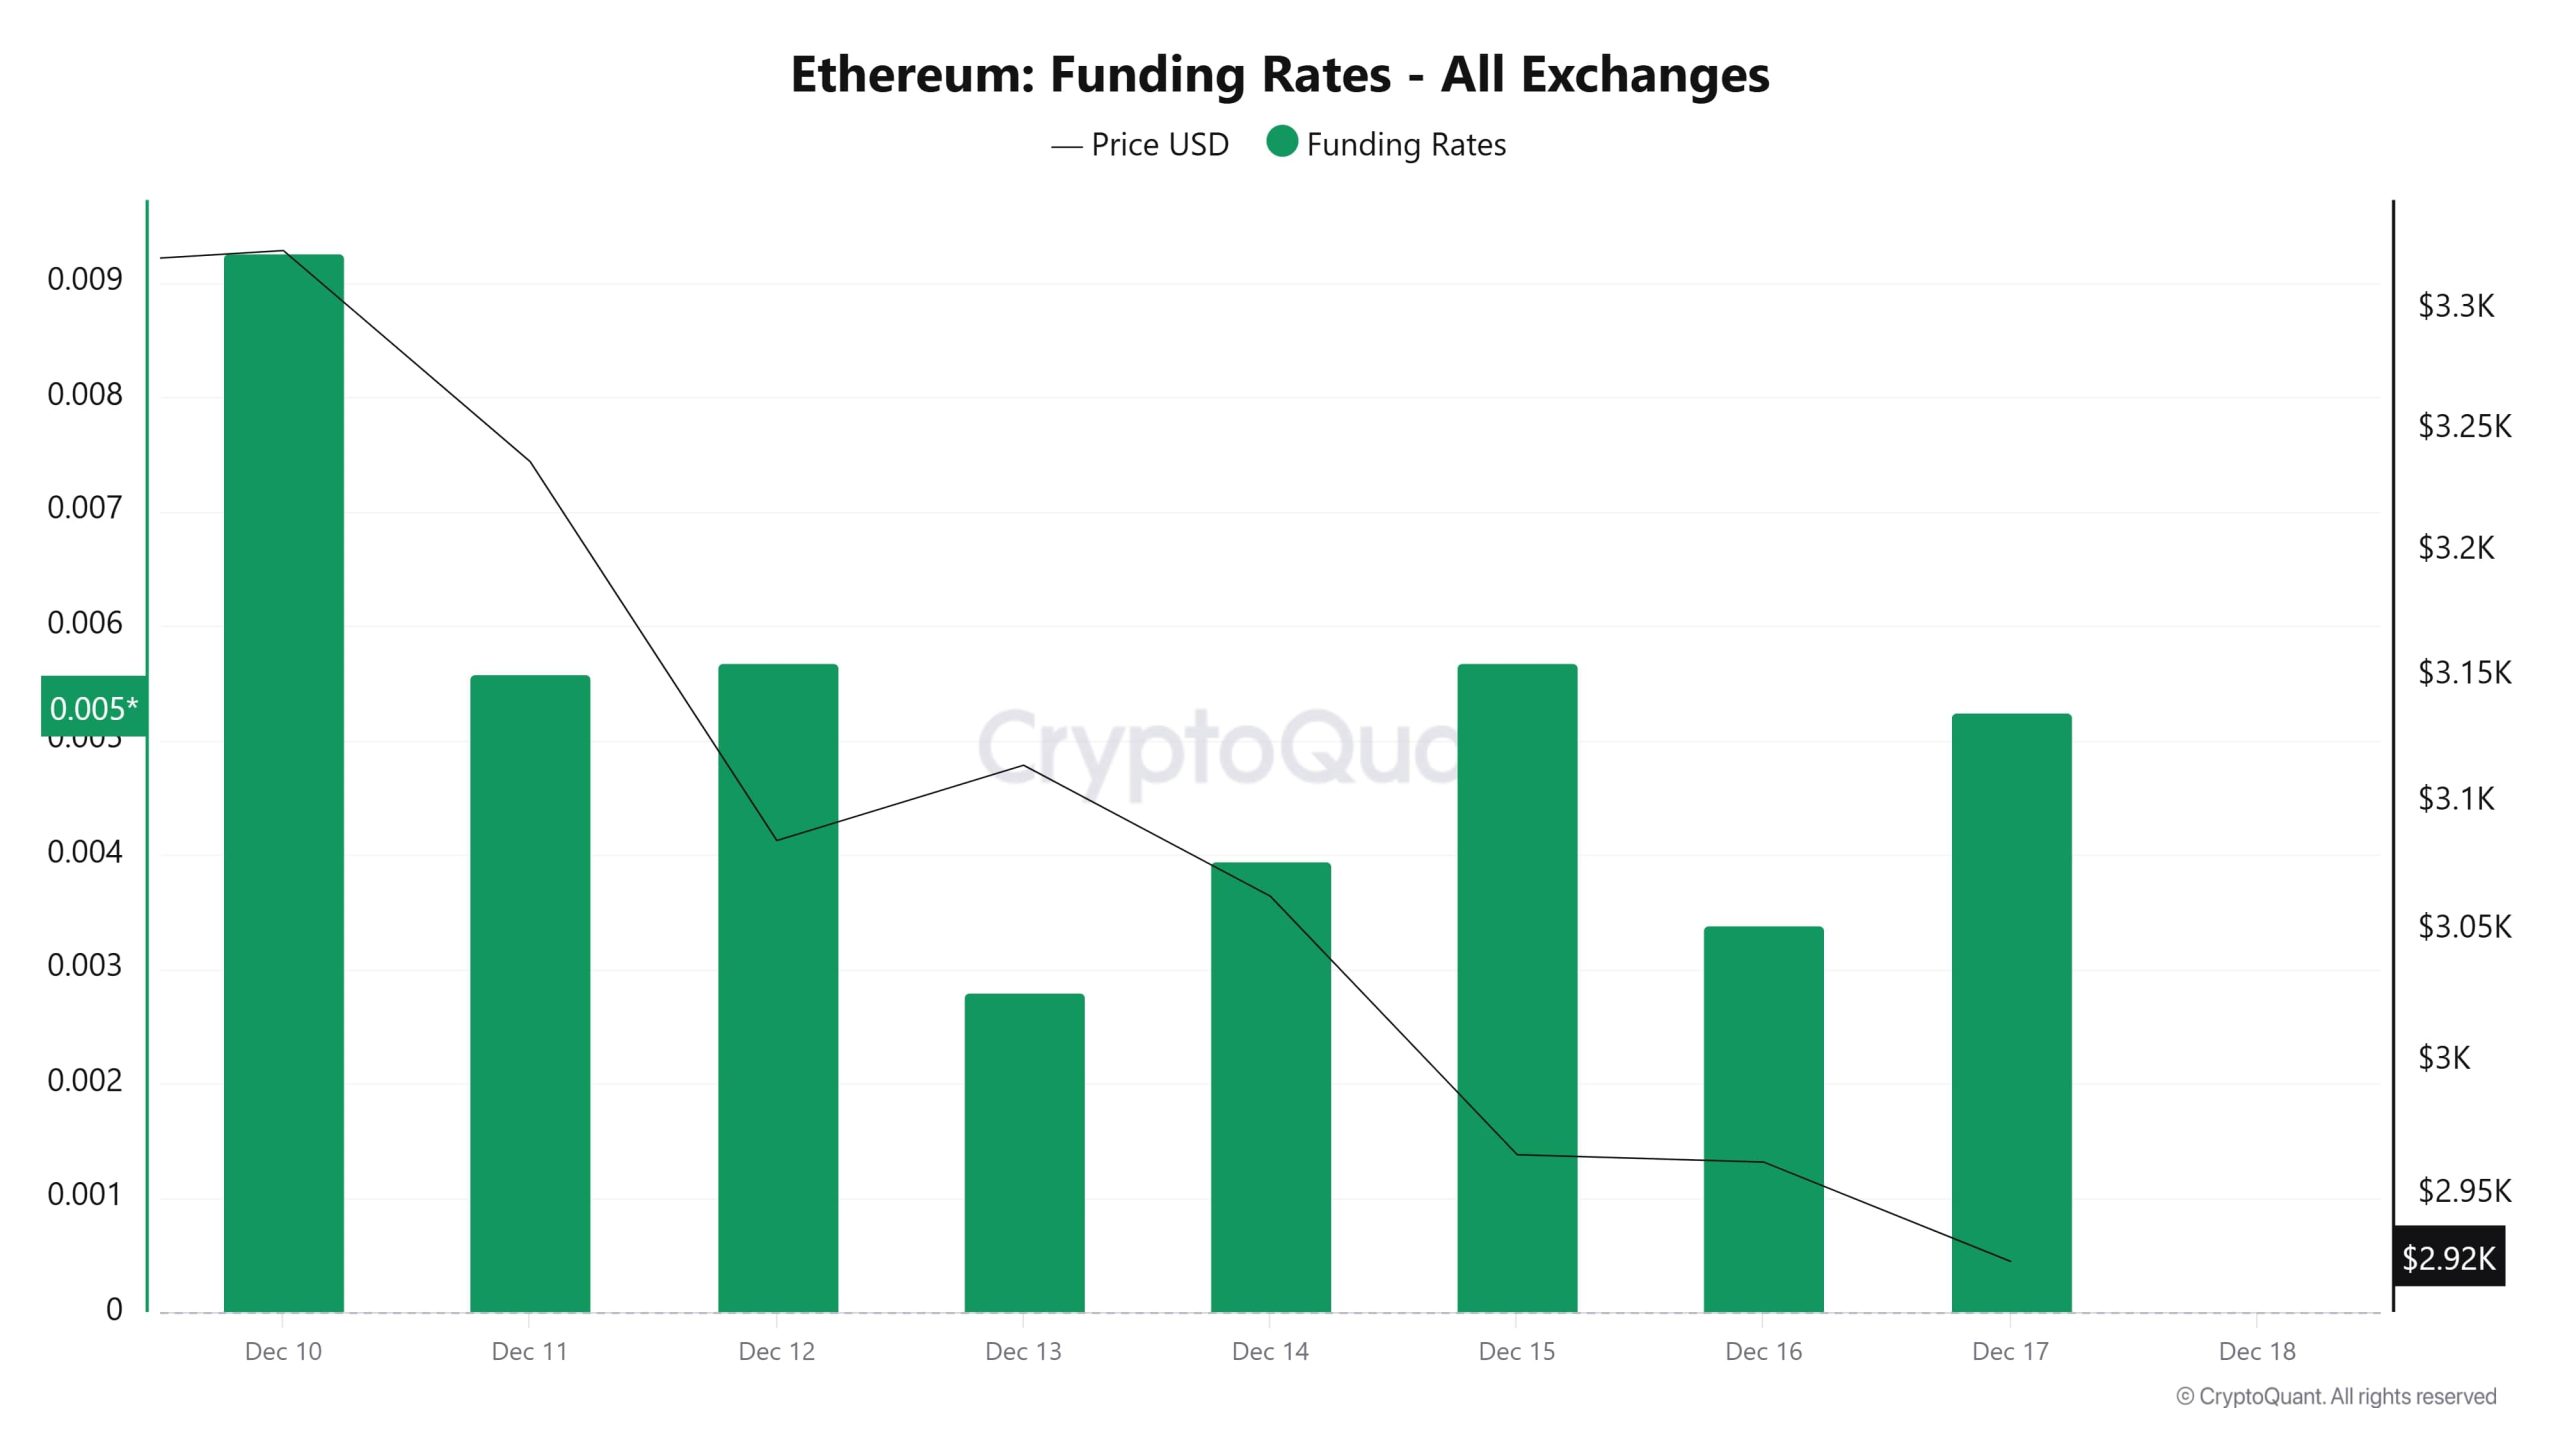
The Funding Rate chart shows that Ethereum funding rates have generally remained positive but have been volatile and weaker compared to previous days. This suggests that long positions are still dominant in the futures markets, but appetite has clearly diminished.
There is a clear pullback in price. The ETH price has fallen from the $3,300 region to around $2,920. Although the funding rate remains positive, the downward movement of the price reveals that buy positions are struggling to carry the price and that the market is still under pressure. The overall picture points to a cautious outlook in the short term and suggests that volatility may continue.
Long & Short Liquidations
With the ETH price falling from around $3,447 to $2,880, approximately $513 million in long positions were liquidated. During the same timeframe, nearly $248 million in short positions were also liquidated.
| Date | Long Amount (Million $) | Short Amount (Million $) |
|---|---|---|
| December 10 | 47.74 | 63.49 |
| December 11 | 124.22 | 38.22 |
| December 12 | 93.87 | 25.07 |
| December 13 | 7.66 | 21.09 |
| December 14 | 29.97 | 8.76 |
| December 15 | 128.67 | 48.51 |
| December 16 | 81.79 | 43.73 |
| Total | 513.92 | 248.87 |
Supply Distribution
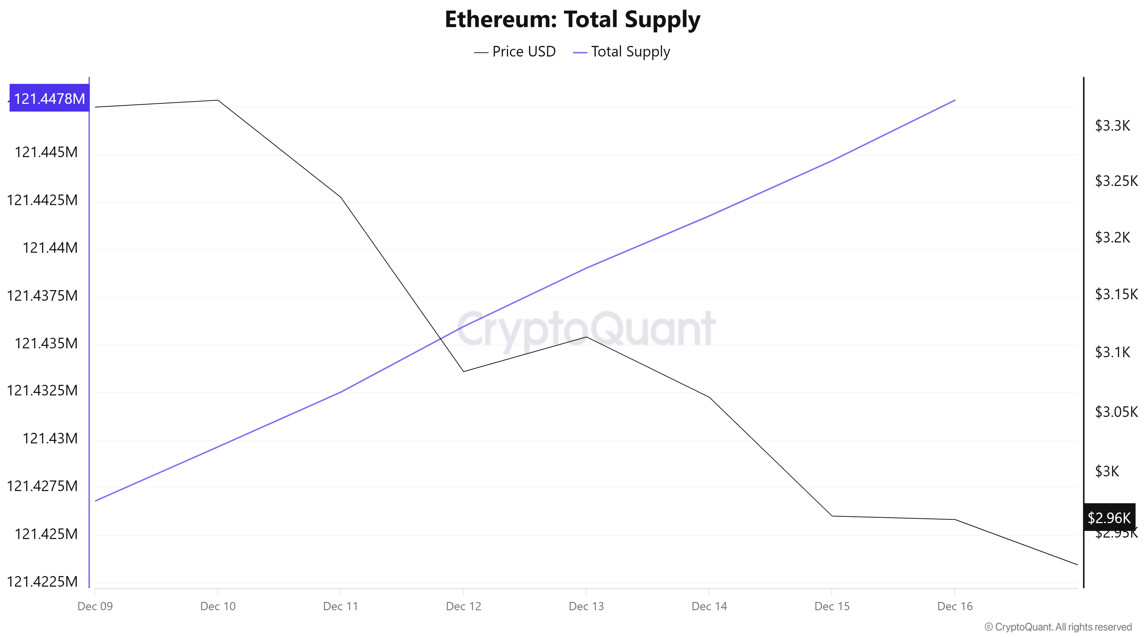
Total Supply: Reached 121,447,820 units, an increase of approximately 0.020% compared to last week.
New Supply: The amount of ETH produced this week was 24,374.
Velocity: The velocity, which was 10.00 last week, reached 9.99 as of December 16.
| Wallet Category | 12/09/2025 | 12/16/2025 | Change (%) |
|---|---|---|---|
| 100 – 1k ETH | 8.4042M | 8.3631M | -0.49 |
| 1k – 10k ETH | 12.1359M | 12.1182M | -0.15% |
| 10k – 100k ETH | 21.4287M | 22.2843M | 3.99 |
| 100k+ ETH | 4.4651M | 4.5149M | 1.12 |
Along with the strong increase recorded in the 10k–100k ETH range, we see that medium-to-large-scale investors are clearly positioned on the buying side. The increase observed in the largest wallets holding 100k+ ETH indicates that major players are adding liquidity back into Ethereum.
Exchange Supply Ratio
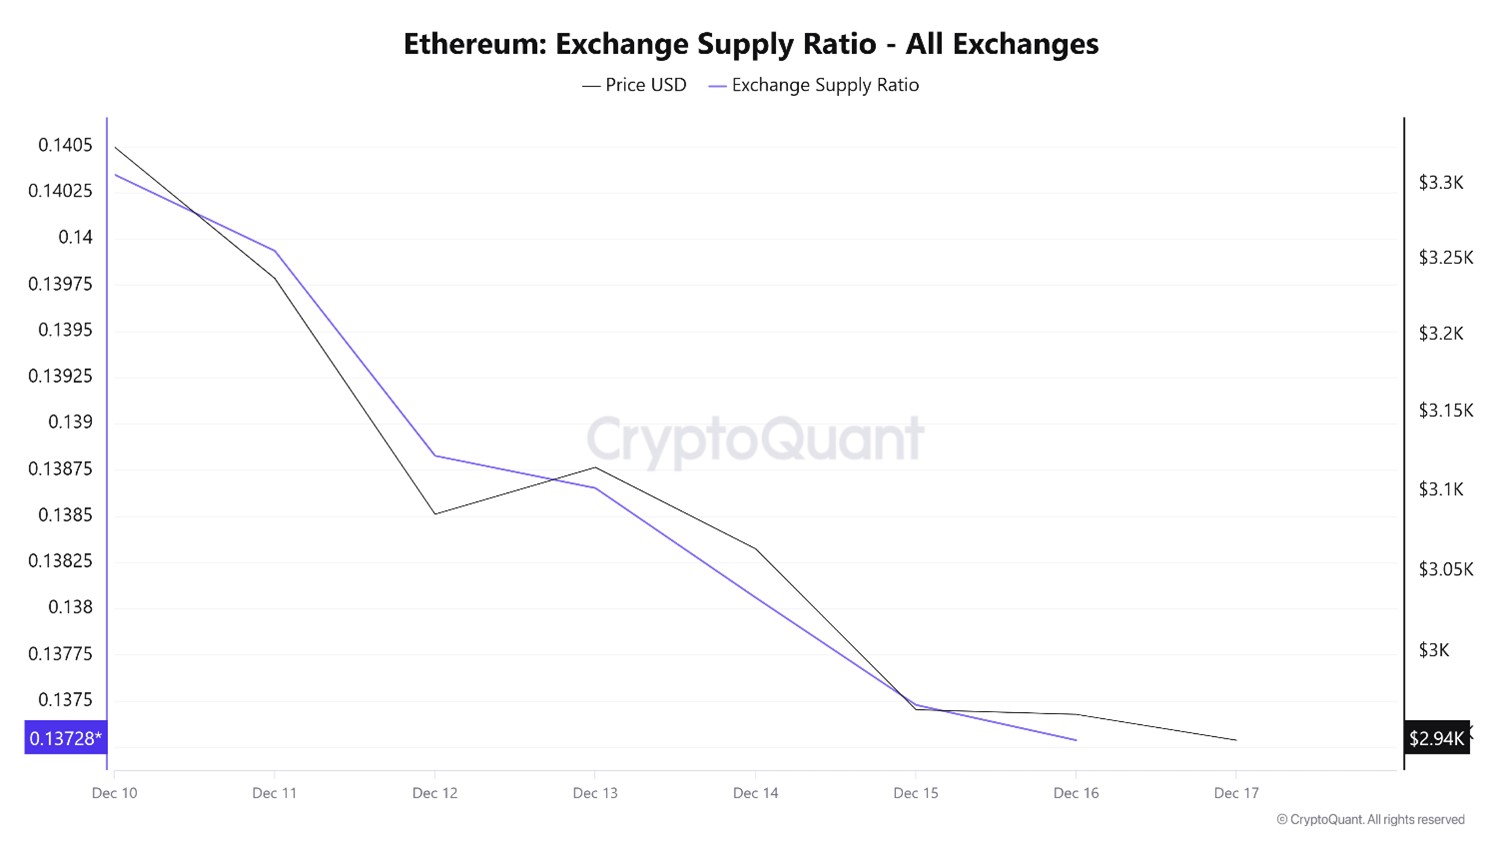
Between December 10 and December 17, the Ethereum Exchange Supply Ratio fell from 0.13993311 to 0.13728826. During this period, the price of Ethereum fell from $3,236 to $2,964. Since December 10, at the point where the price and the Exchange Supply Ratio intersect, the correlation between the price and the Exchange Supply Ratio has turned positive. This indicates that, along with the decline in price, the amount of Ethereum supplied to exchanges has increased and that long-term investors have likely turned to buying Ethereum with their assets. It appears that an overall increase in the price of Ethereum may prevail.
Exchange Reserve
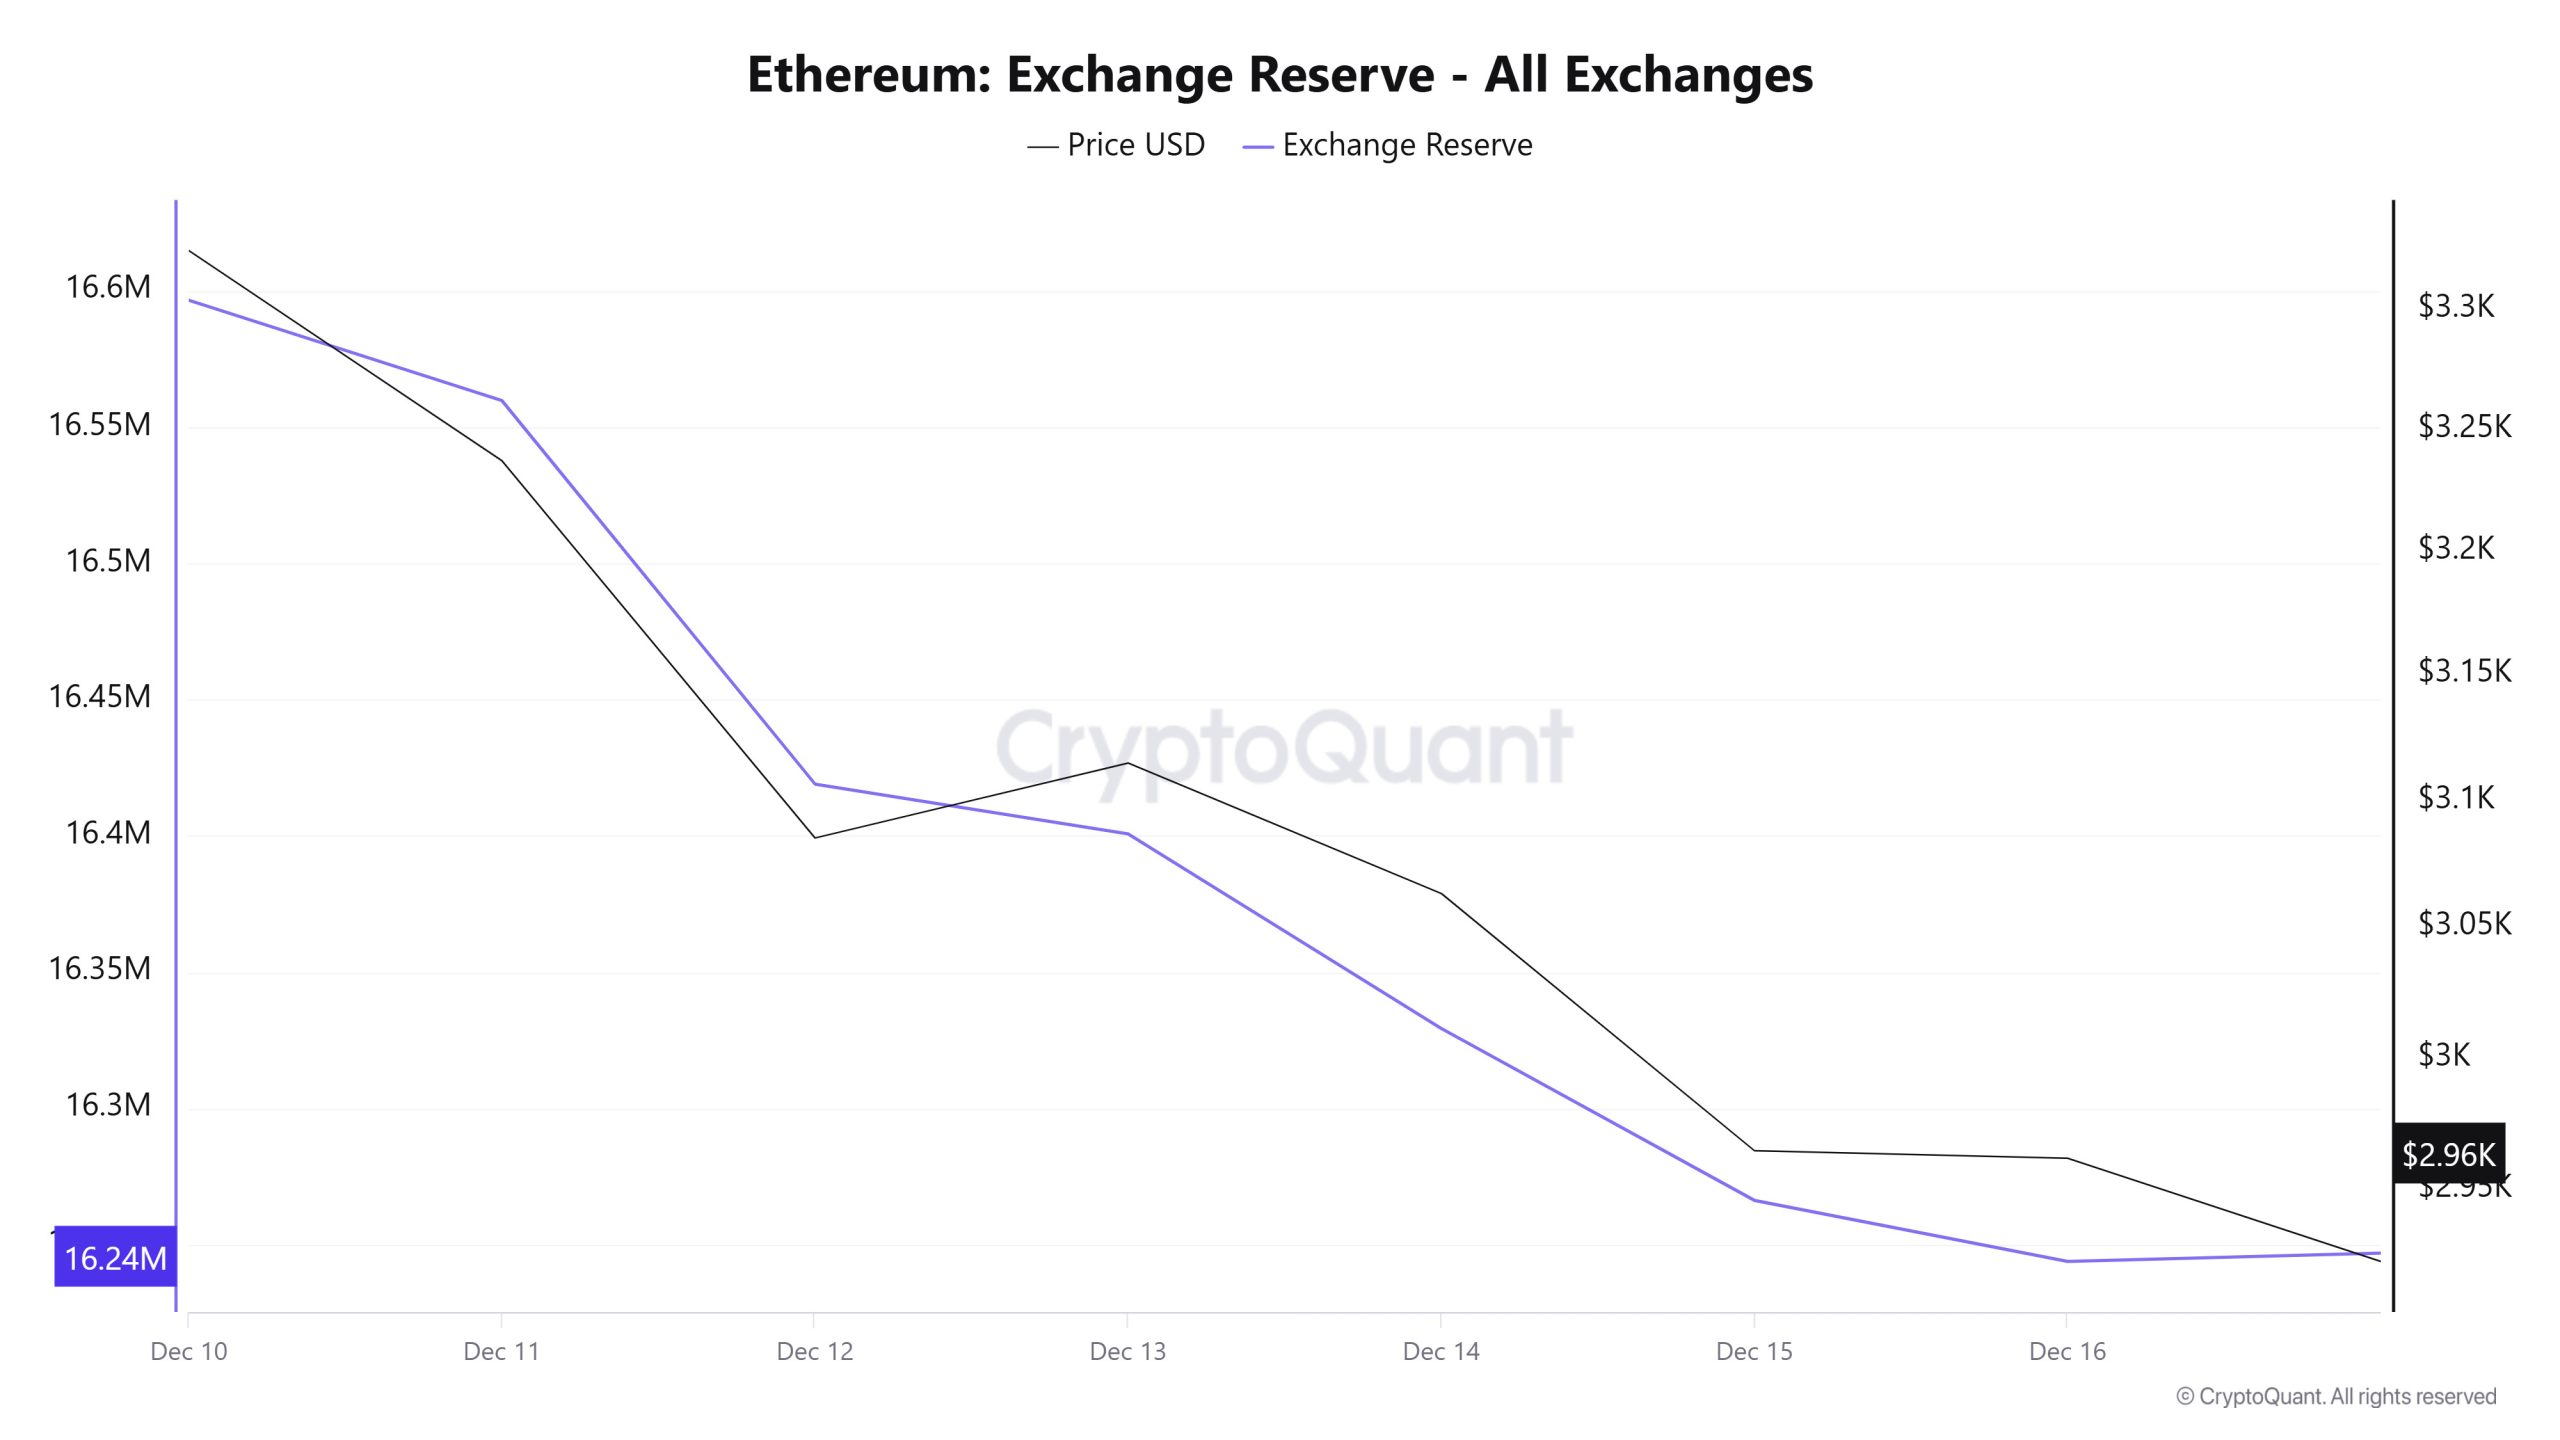
Between December 10-16, 2025, Ethereum reserves on exchanges fell from 16,614,906 ETH to 16,243,808 ETH, resulting in a net outflow of 371,098 ETH. Exchange reserves fell by approximately 2.23%. During the same period, the price of ETH fell from $3,318 to $2,962, losing approximately 10.75% of its value. The continued strong outflows from exchanges during this period of sharp price decline indicated that investors preferred to move their ETH off exchanges rather than sell. In particular, the steady decline in reserves despite the price drop pointed to a cautious and longer-term stance rather than panic selling. Weakness and volatility on the price side may continue in the short term. However, the ongoing outflows from exchanges could create a supportive environment for the price by reducing supply.
| Date | 10-Dec | 11-Dec | 12-Dec | 13-Dec | 14-Dec | 15-Dec | 16-Dec |
|---|---|---|---|---|---|---|---|
| Exchange Inflow | 1,013,509 | 996,558 | 1,176,474 | 271,574 | 424,720 | 1,012,259 | 982,577 |
| Exchange Outflow | 1,031,730 | 1,033,415 | 1,317,276 | 289,860 | 496,151 | 1,075,364 | 1,004,974 |
| Exchange Netflow | -18,221 | -36,858 | -140,801 | -18,285 | -71,431 | -63,104 | -22,397 |
| Exchange Reserve | 16,596,685 | 16,559,828 | 16,419,026 | 16,400,741 | 16,329,310 | 16,266,206 | 16,243,808 |
| ETH Price | 3,318 | 3,237 | 3,085 | 3,115 | 3,063 | 2,965 | 2,962 |
Fees and Revenues
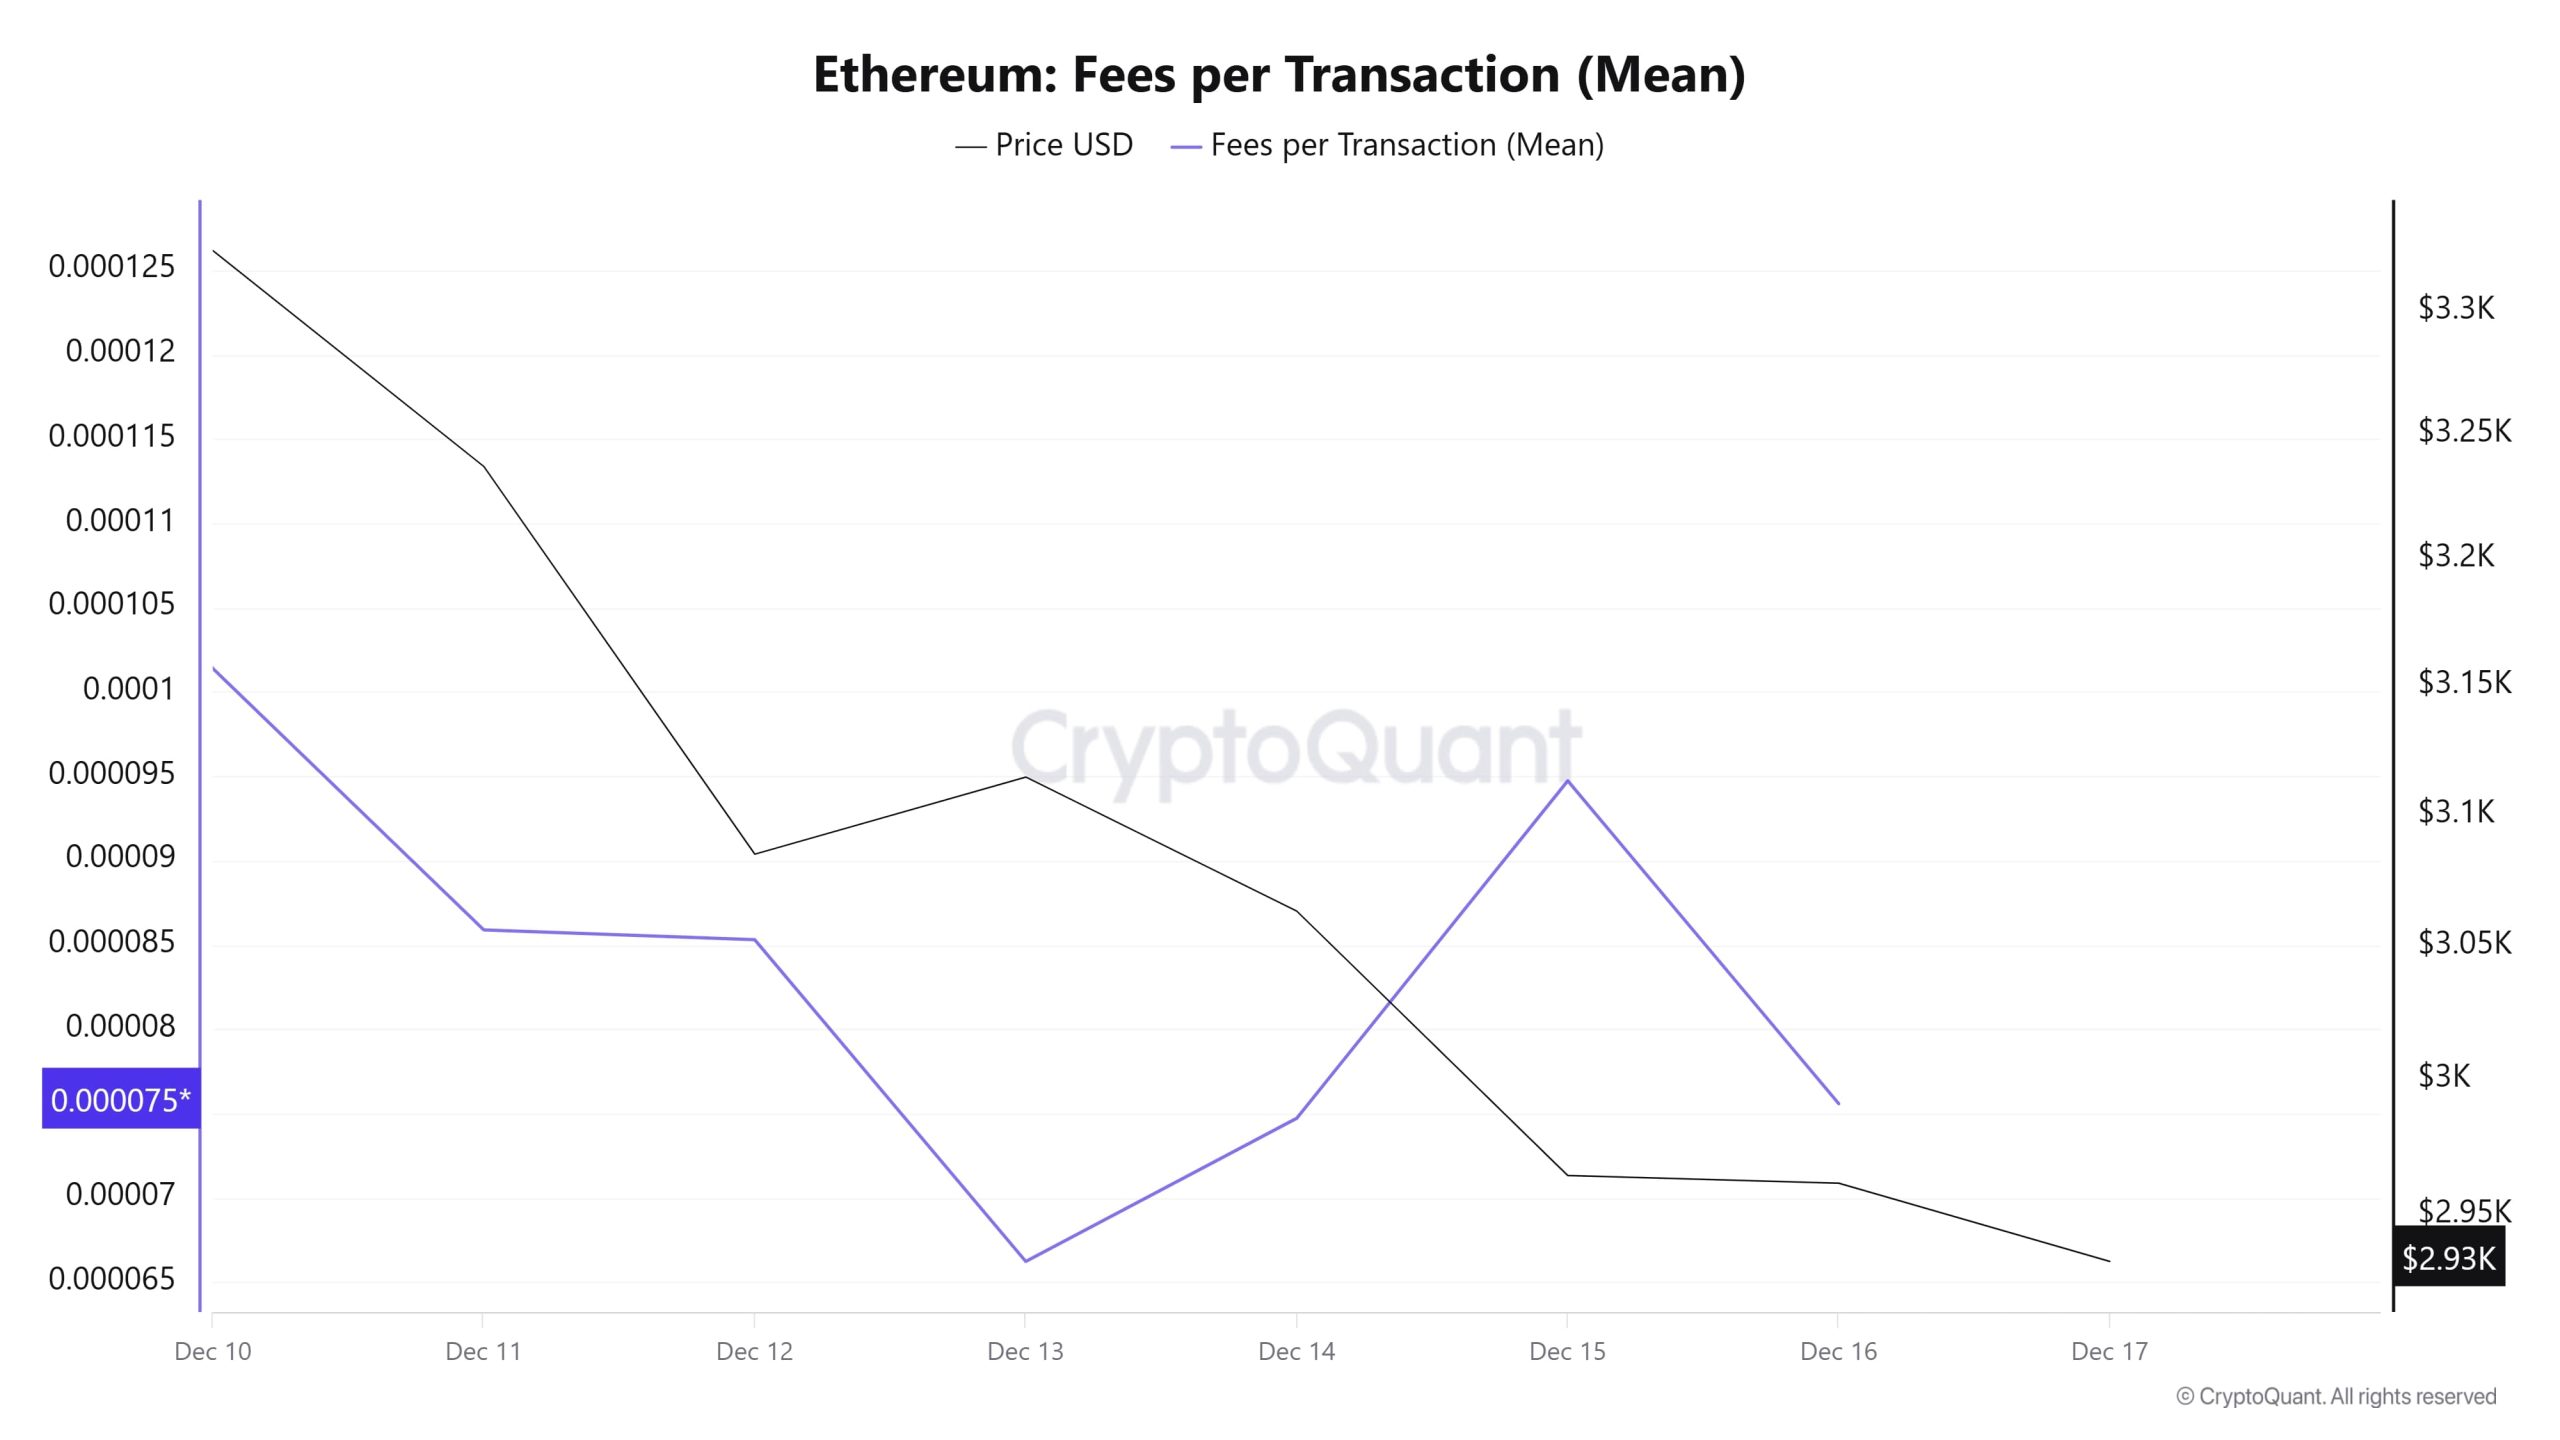
When examining the Ethereum Fees per Transaction (Mean) data for the period between December 10-16, 2025, it was observed that the indicator reached 0.00010139 on December 10, the first day of the week. A fluctuating trend was observed until December 13, when the indicator recorded the week’s lowest value at 0.0000662233. In this context, as a result of the increase in Ethereum price volatility as of December 13, the indicator regained momentum and followed a positive trend due to the impact of price volatility. On December 16, the last day of the weekly period, the indicator closed the week at 0.0000755739.
Ethereum: Fees (Total)
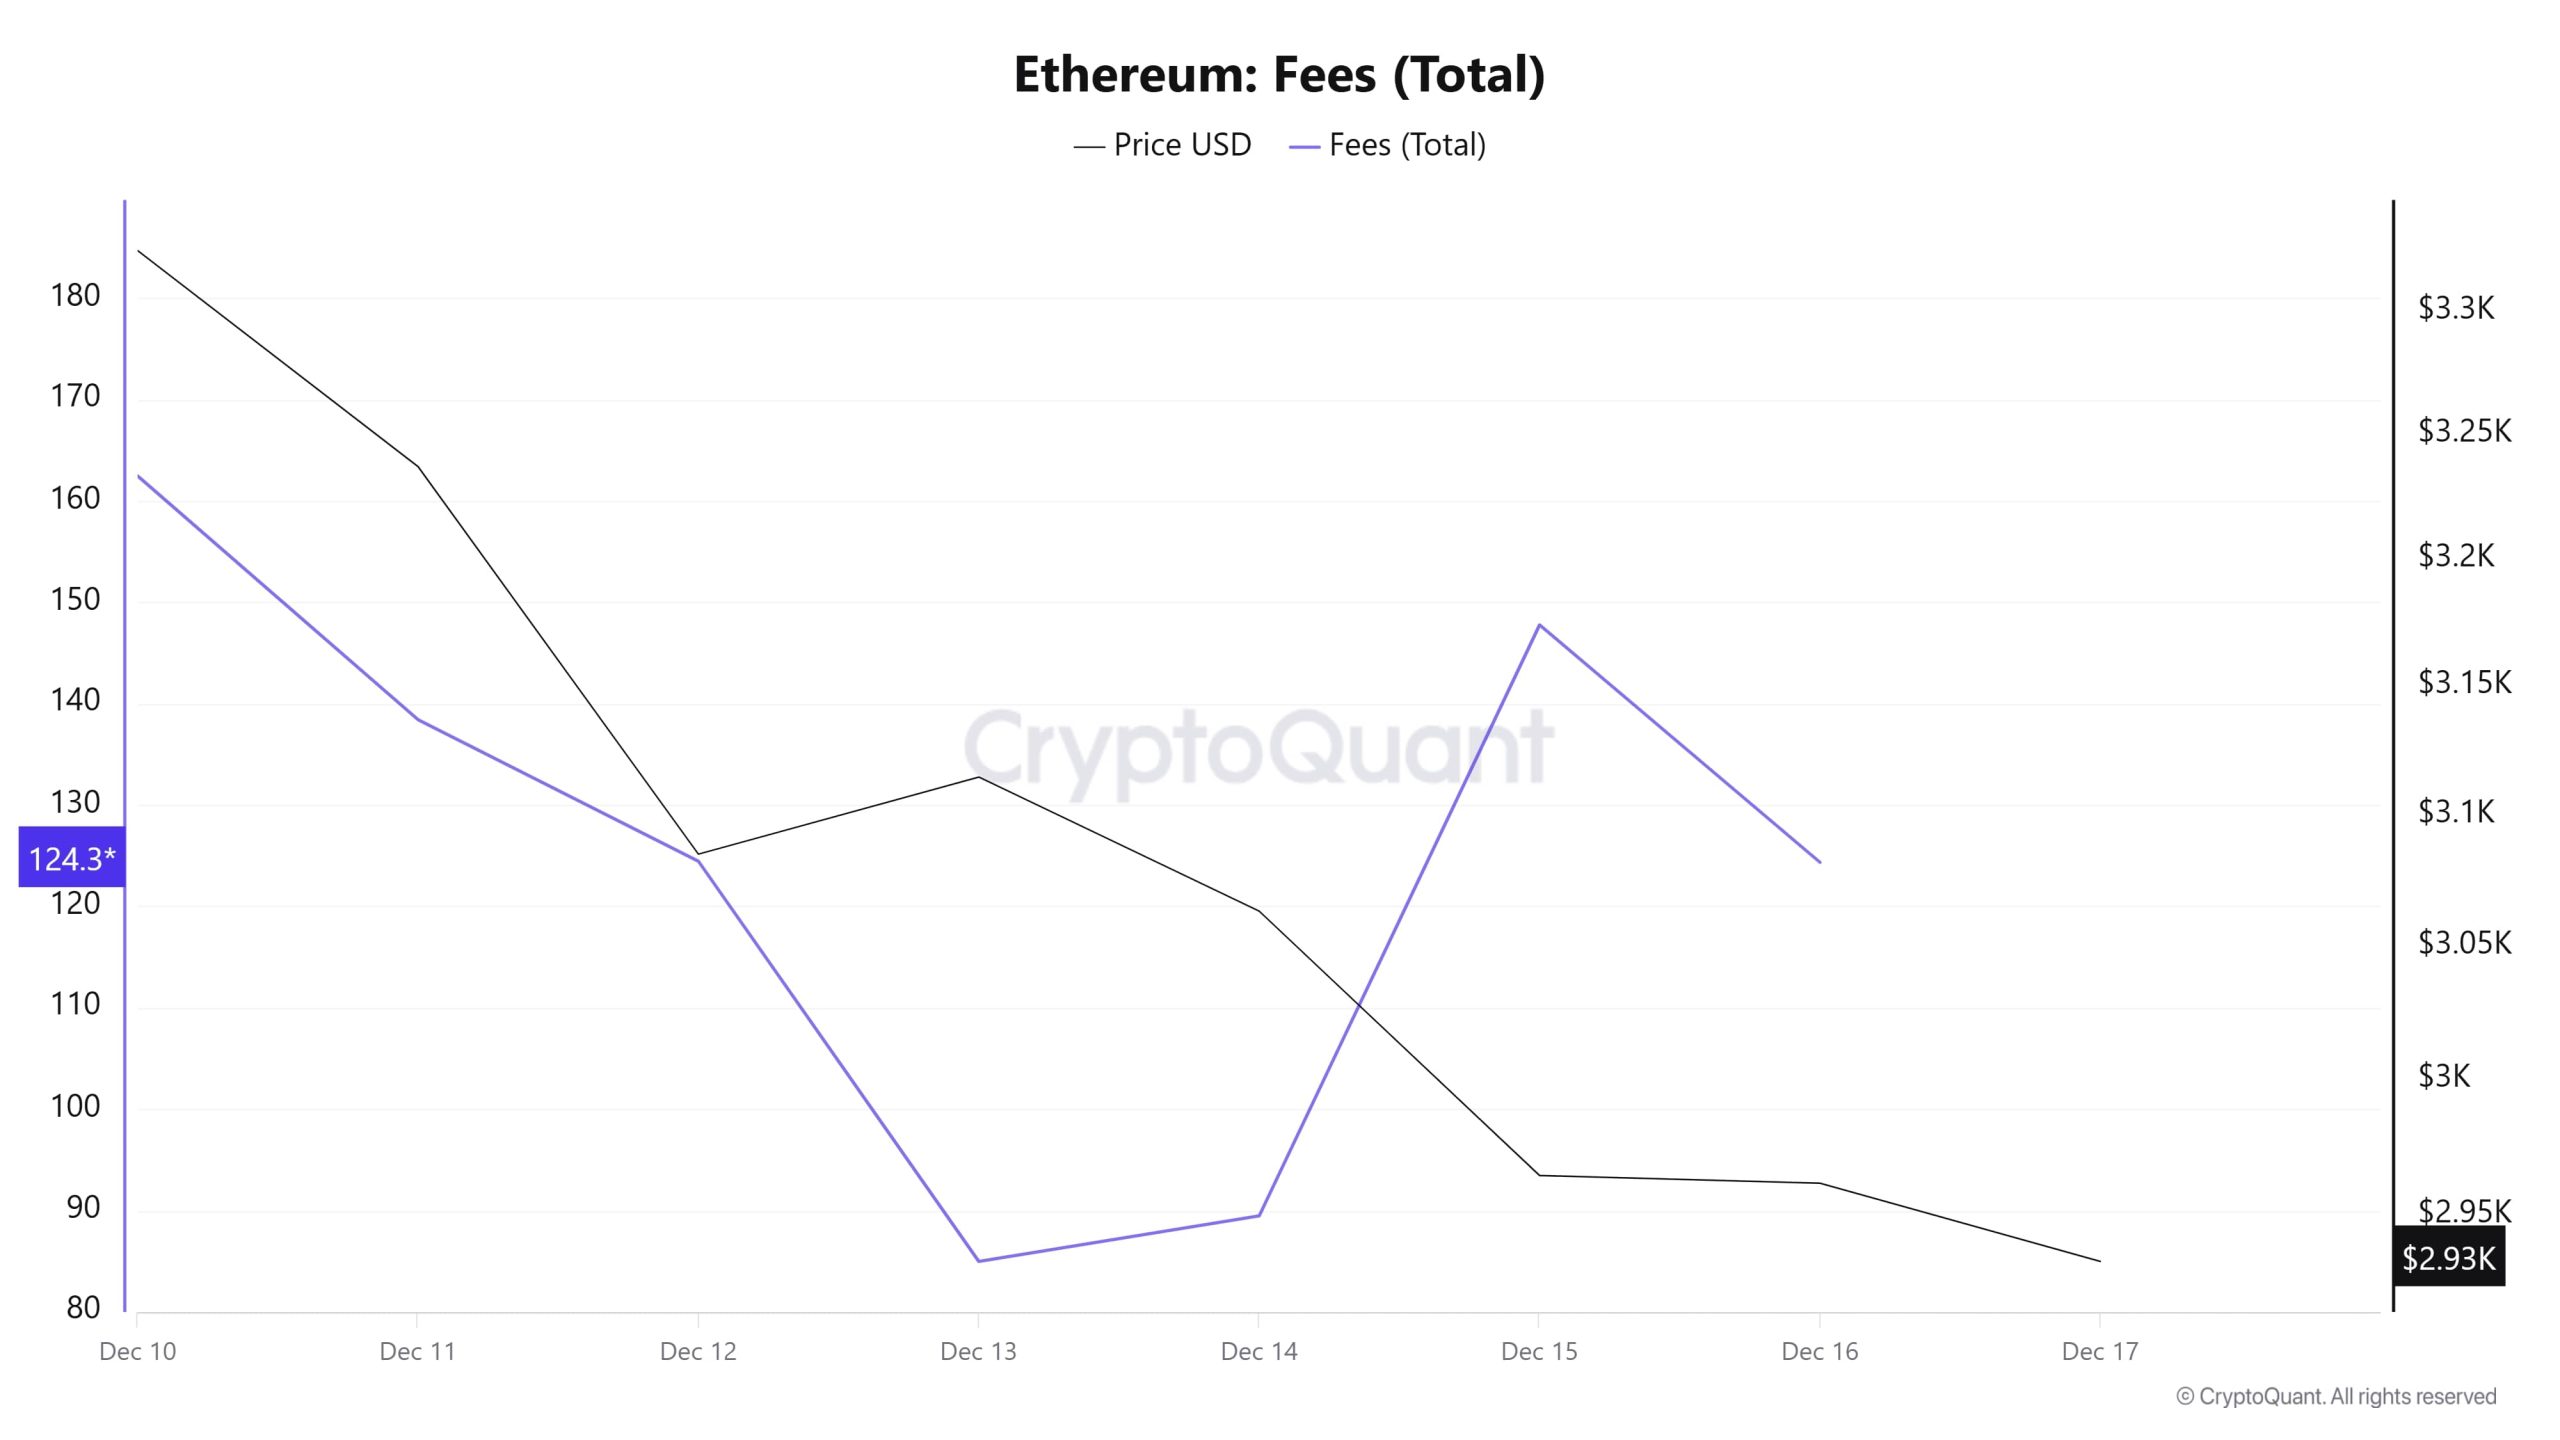
Similarly, when examining the Ethereum Fees (Total) data between December 10-16, 2025, the indicator stood at 162.461026 on December 10, the first day of the week. A fluctuating trend was observed until December 13, when the indicator recorded the week’s lowest value at 84.9771457. In this context, as a result of the increase in Ethereum price volatility as of December 13, the indicator regained momentum and followed a positive trend due to the impact of price volatility. On December 16, the last day of the weekly period, the indicator closed the week at 124.3426814.
Blocks Mined
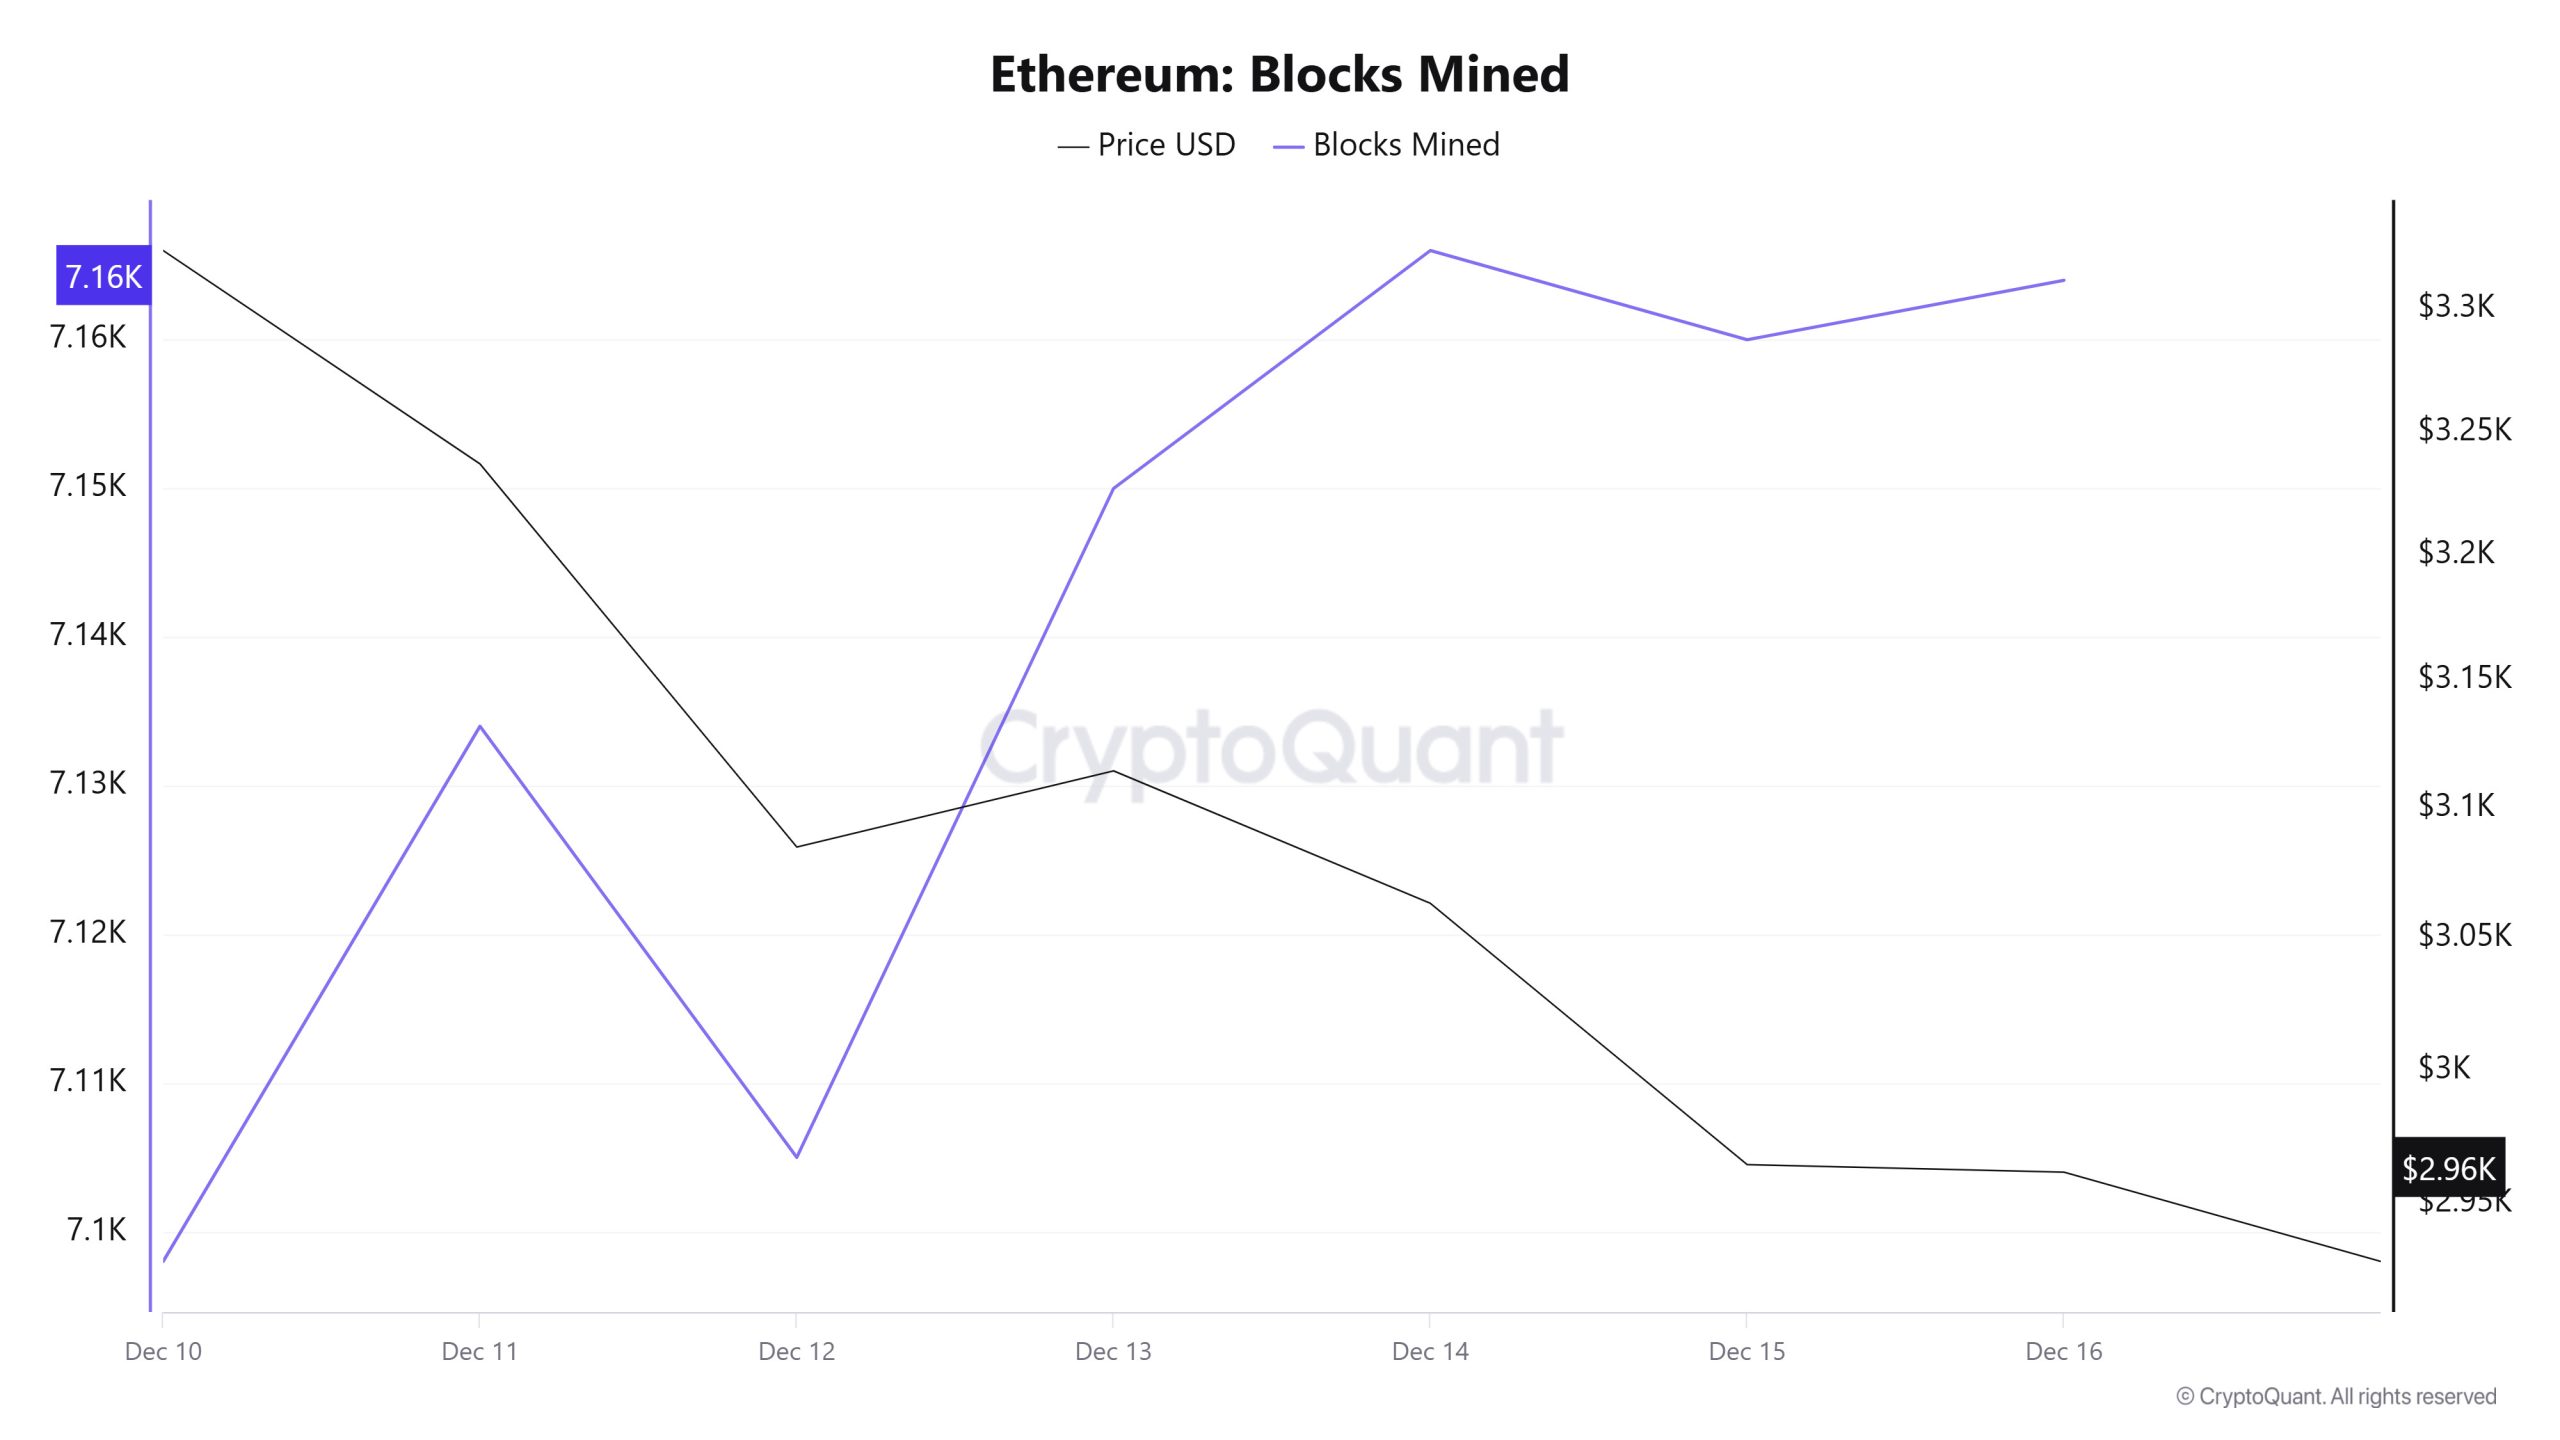
When examining Ethereum block production data between December 10 and 16, an increase was observed throughout the week. While 7,098 blocks were produced on December 10, this number rose to 7,164 by December 16.
During the period in question, a time-dependent correlation structure was observed between the Ethereum price and the number of blocks produced. However, the general trend reveals that a negative correlation between these two variables is dominant.
Block Size
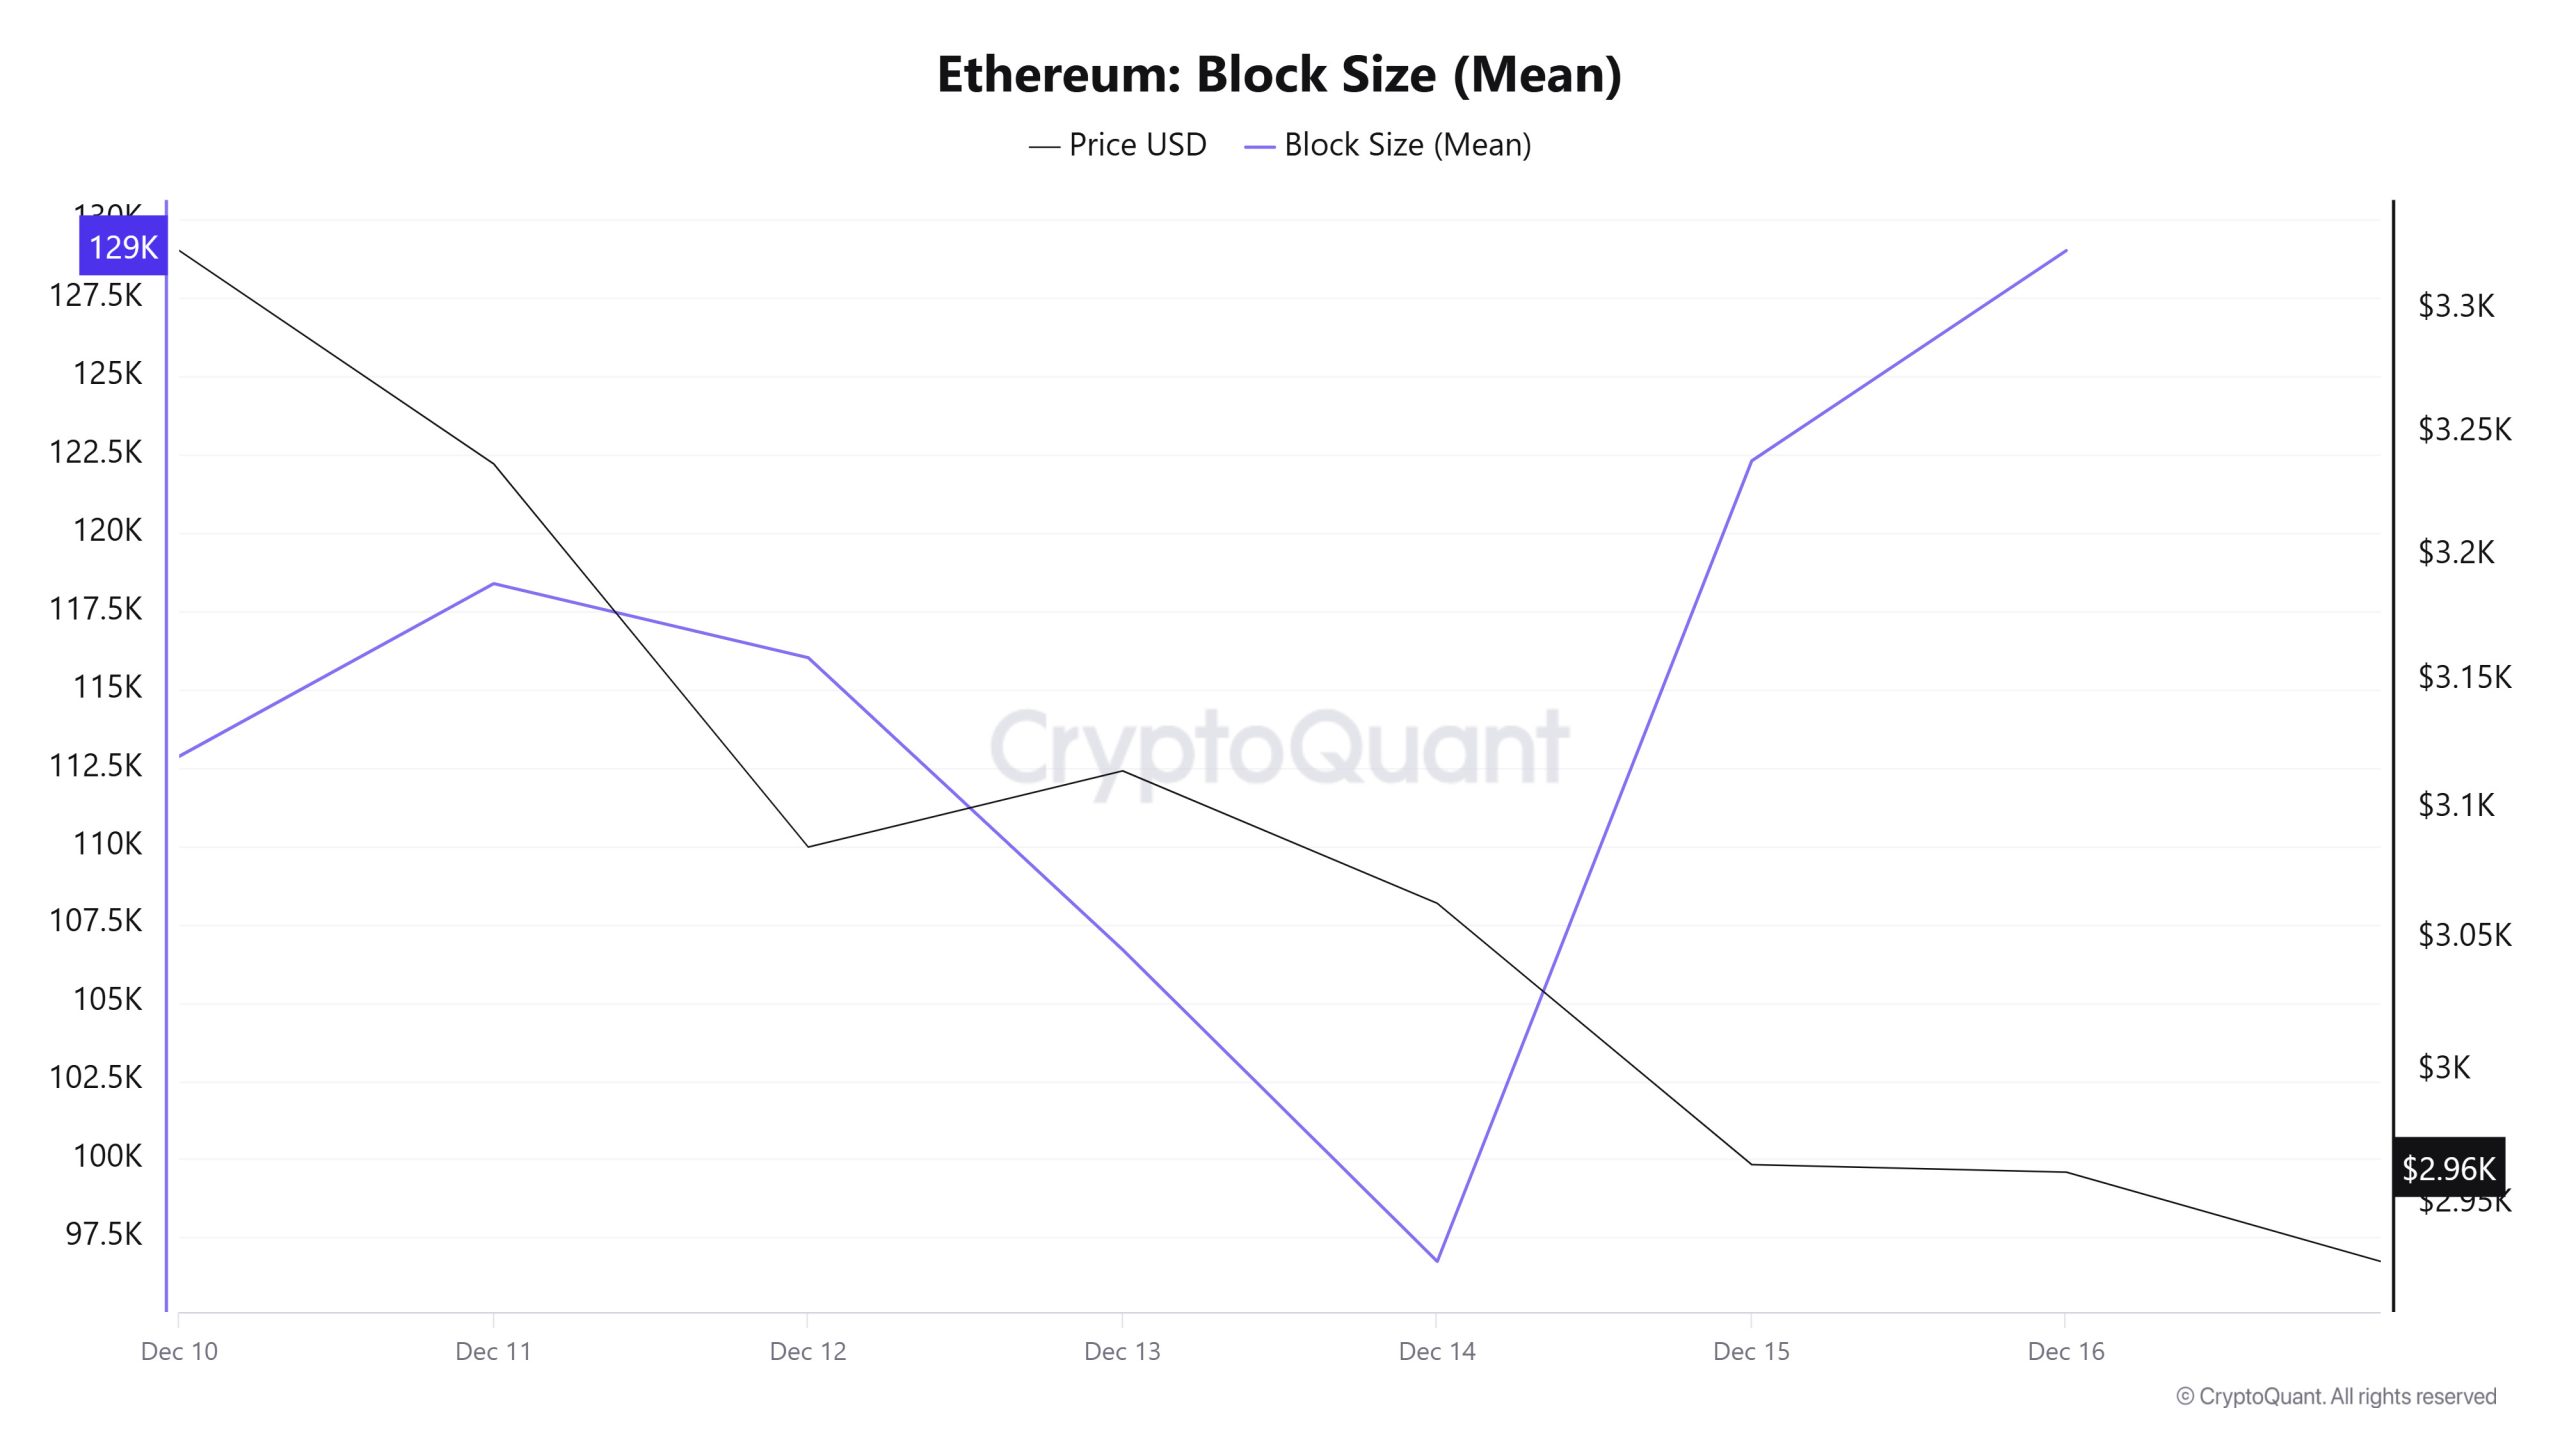
When examining Ethereum block size data between December 10 and 16, an increase was observed throughout the week. While the average block size was measured at 112,867 bytes on December 10, this value rose to 129,024 bytes as of December 16.
During the relevant period, a time-dependent correlation structure was observed between block size and Ethereum price. However, the general trend reveals that a positive correlation between these two variables is dominant.
Block Interval
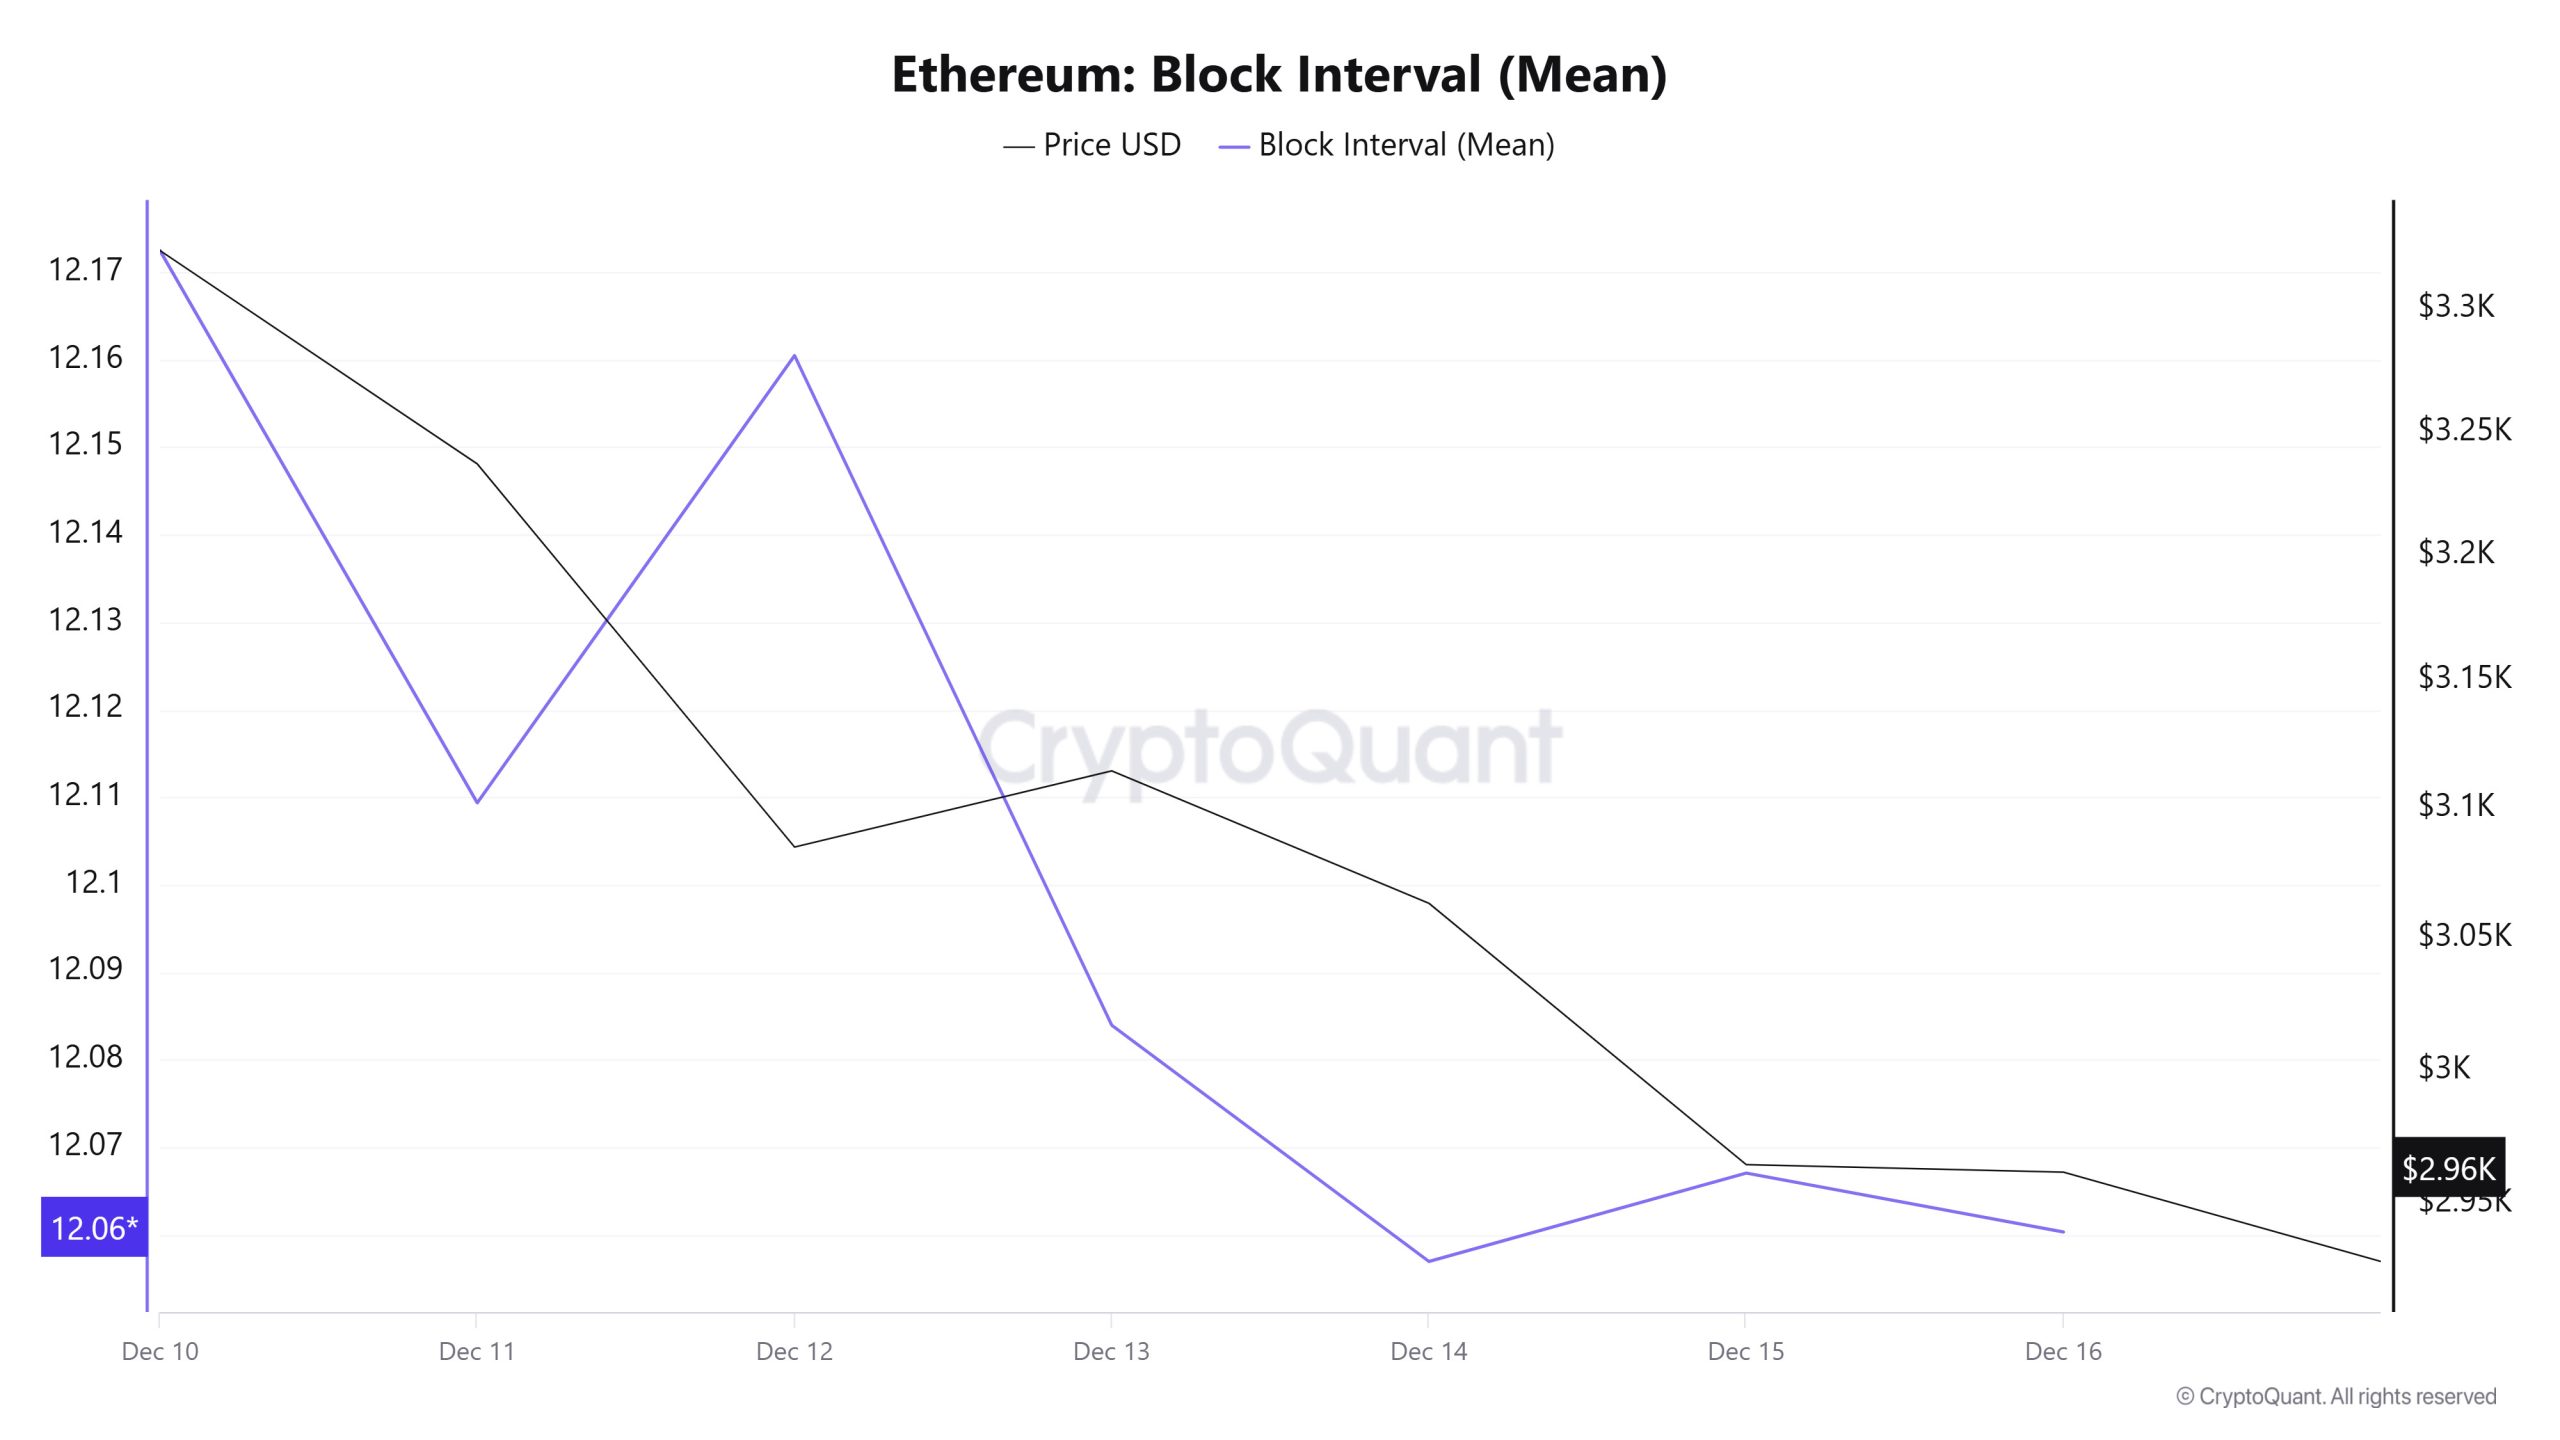
When examining the Ethereum block time between December 10 and 16, a decline was observed throughout the week. While the average block time was recorded as 12.17 seconds on December 10, this time decreased to 12.06 seconds as of December 16.
During this period, a time-dependent correlation structure was observed between the Ethereum block time and price movement. However, the general trend indicates that a positive correlation between these two variables is dominant.
Transaction
![]()
While 10,613,654 transactions were executed on the Ethereum network last week, this week the number of transactions declined by approximately 2.4% to 10,357,973. The highest transaction volume of the week was recorded on December 16 at 1,645,312, while the lowest volume was recorded on December 14 at 1,197,528. The correlation between transaction volume and price fluctuated throughout the week, forming balanced correlations. However, the decline in network activity compared to the previous period indicates a slowdown in Ethereum’s transaction momentum.
Tokens Transferred
The total amount of ETH transferred last week was 9,887,336 ETH, while this week the value rose to 12,093,526 ETH, recording an increase of approximately 22.3%. The highest transfer volume during the period occurred on December 12 at 2,173,327 ETH, while the lowest value was recorded on December 13 at 684,746 ETH.
When the 300% fluctuation in daily transfers is considered alongside the decline in the number of transactions, it appears that the average amount of ETH transferred per transaction has increased significantly compared to the previous period. This suggests that major players were more active on the Ethereum network throughout the week. The high level of 1.1675 for the Ethereum/transaction ratio on the network also supports this interpretation. However, looking at the relationship between price movements and the amount of Ethereum transferred, it is noteworthy that negative correlations were dominant throughout the week. This picture raises the possibility that high-volume transfers may have been sales-oriented rather than pushing the price up, meaning that some large players may have gradually liquidated their Ethereum positions.
Estimated Leverage Ratio
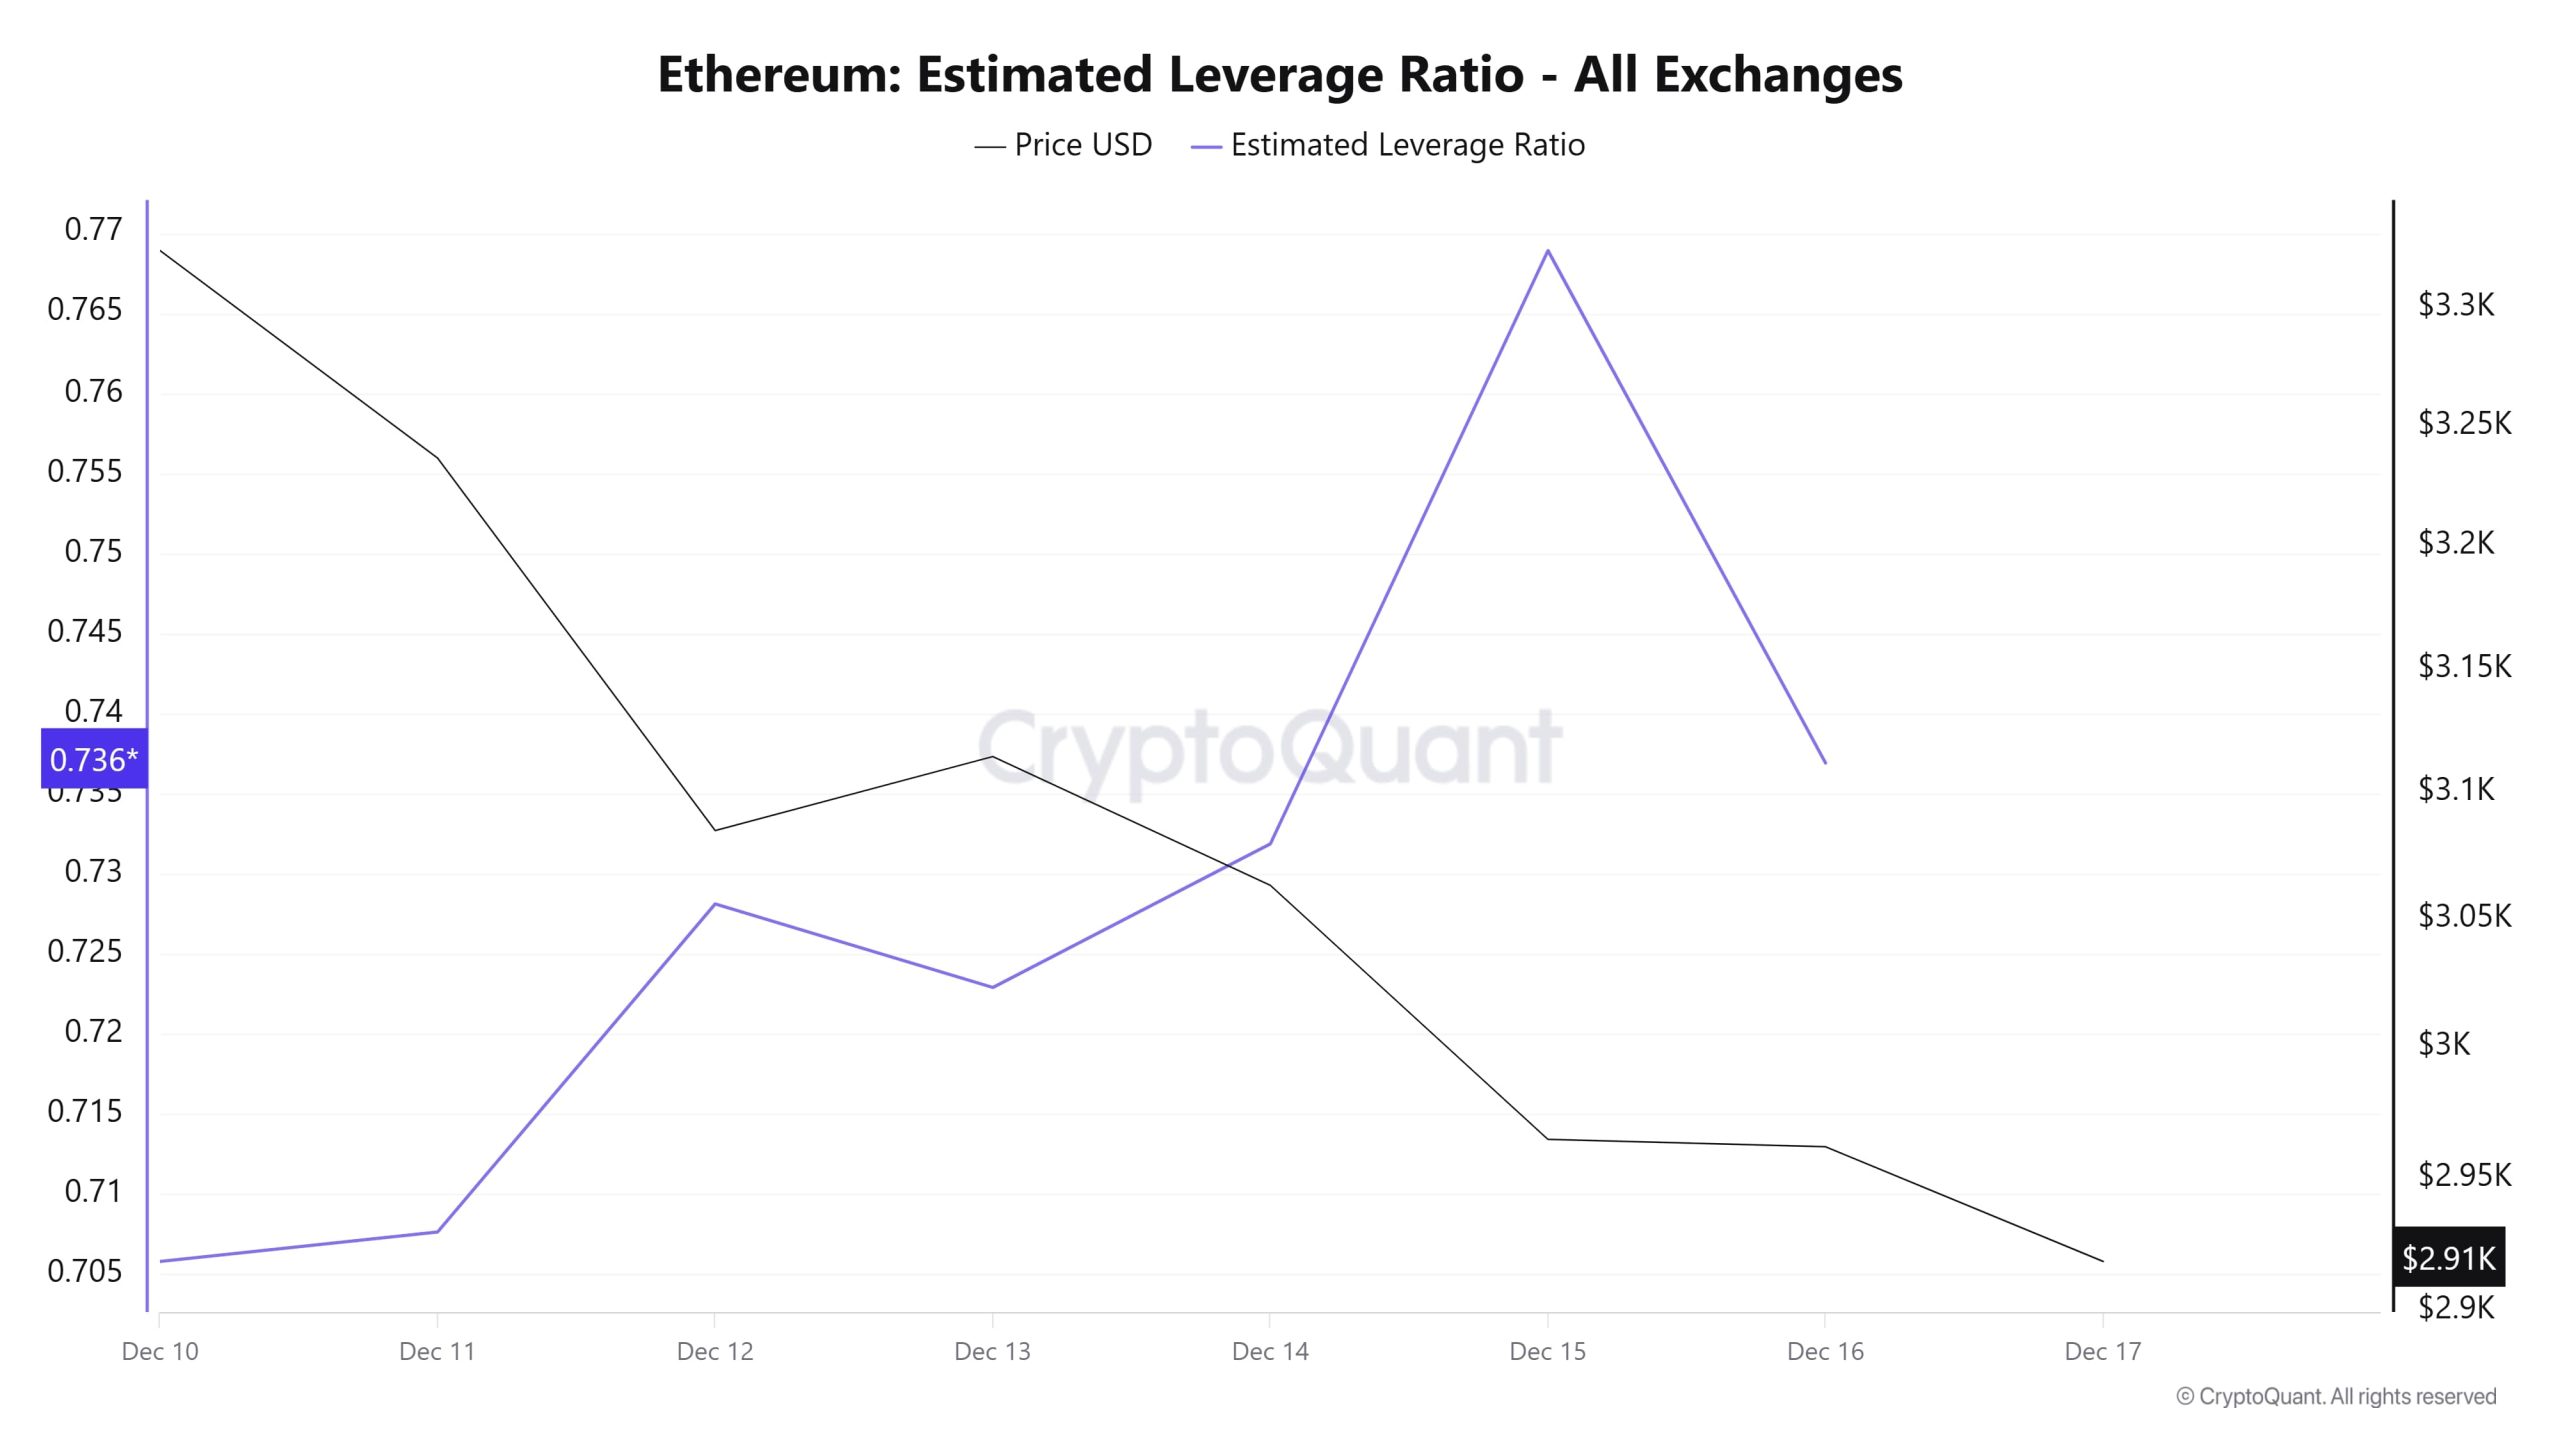
The metric rose throughout the 7-day period until the last day of the process. On December 10, the first day of the process, the metric stood at 0.705, which was also the lowest point of the process. It then rose until December 15, reaching 0.768, the highest point of the process, indicating increased risk appetite. At the time of writing, the metric is declining, standing at 0.736, indicating a decrease in investor appetite compared to the rest of the process. A higher ELR means participants are more willing to take on risk and generally indicates bullish conditions or expectations. Uptrends can also be driven by a decrease in reserves. Looking at Ethereum reserves, there were 16.60 million reserves at the beginning of the process, but this figure declined during the rest of the process and currently stands at 16.25 million. At the same time, Ethereum’s Open Interest was $40.40 billion at the beginning of the process. As of now, volume has decreased during the process, and the open interest value has fallen to $37.19 billion. With all this data, the ELR metric followed an upward trend for most of the process. The price of the asset fluctuated between $3,320 and $2,920 with all this data. As a result, the overall decline in open interest data throughout the process, coupled with a steady decline in reserves, indicated that the ELR metric showed an artificial increase, signaling a decrease in risk appetite rather than an increase.
ETH Onchain Overall
| Metric | Positive 📈 | Negative 📉 | Neutral ➖ |
|---|---|---|---|
| Active Addresses | ✓ | ||
| Total Value Staked | ✓ | ||
| Derivatives | ✓ | ||
| Supply Distribution | ✓ | ||
| Exchange Supply Ratio | ✓ | ||
| Exchange Reserve | ✓ | ||
| Fees and Revenues | ✓ | ||
| Blocks Mined | ✓ | ||
| Transaction | ✓ | ||
| Estimated Leverage Ratio | ✓ |
*The metrics and guidance provided in the table do not alone explain or imply any expectation regarding future price changes in any asset. Digital asset prices can fluctuate based on numerous variables. The on-chain analysis and related guidance are intended to assist investors in their decision-making process, and basing financial investments solely on the results of this analysis may lead to unfavorable outcomes. Even if all metrics produce positive, negative, or neutral results simultaneously, the expected outcomes may not materialize depending on market conditions. It would be beneficial for investors reviewing the report to take these warnings into consideration.
Legal Notice
The investment information, comments, and recommendations contained in this document do not constitute investment advisory services. Investment advisory services are provided by authorized institutions on a personal basis, taking into account the risk and return preferences of individuals. The comments and recommendations contained in this document are of a general nature. These recommendations may not be suitable for your financial situation and risk and return preferences. Therefore, making an investment decision based solely on the information contained in this document may not result in outcomes that align with your expectations.
NOTE: All data used in Ethereum on-chain analysis is based on CryptoQuant.
