
Technical Analysis
BTC/USDT
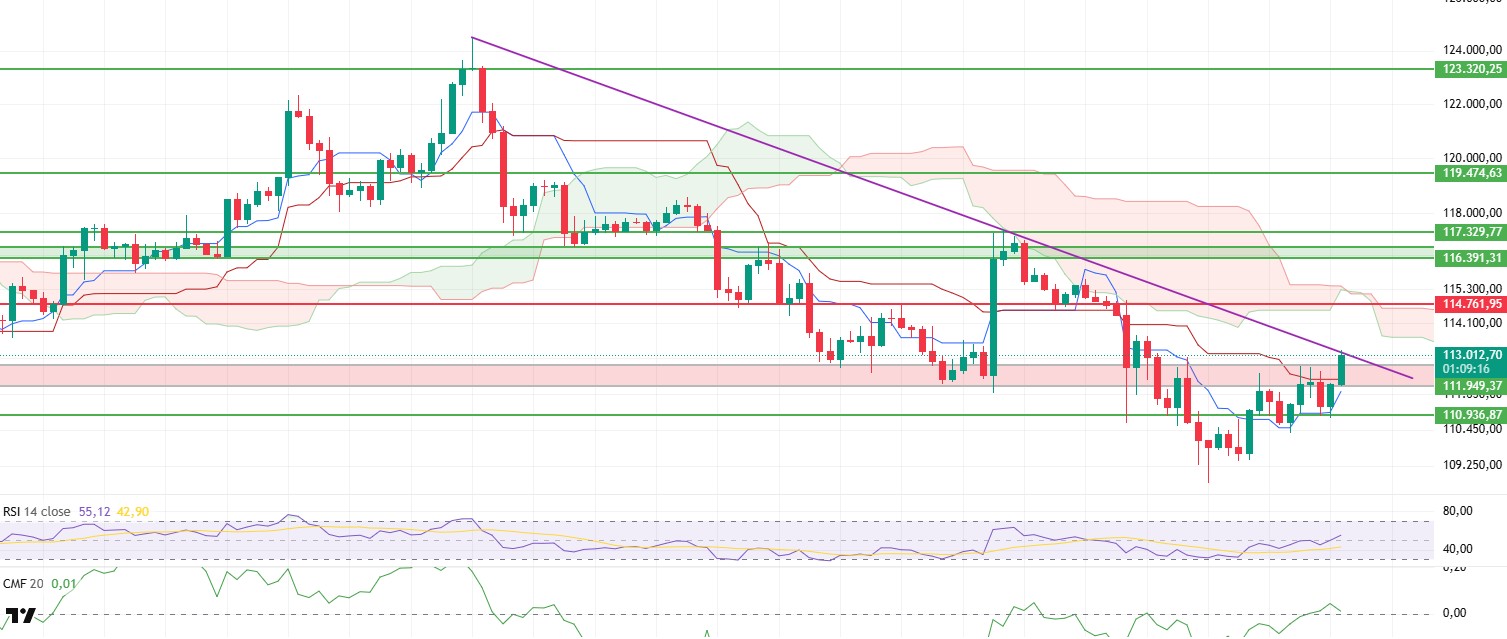
Bitcoin rose to the upper band of the resistance zone marked with a red rectangle on the chart yesterday evening but then retreated to the $110,936 level. It found strong support at this level in the morning hours, and a rapid recovery occurred as buyers stepped in. As a result of this movement, the price climbed to the downtrend line shown in purple.
The Relative Strength Index (RSI) indicator rose above the 50 level and remained above its moving average. This structure indicates that momentum has strengthened and buyers have become dominant in the short term. However, the RSI approaching overbought territory could increase the risk of a correction. Therefore, it is important to monitor the slope of the RSI and any potential divergences.
CVD data indicates that positive buying continues on both the spot and futures sides. This reveals that the uptrend is fueled not only by leveraged trading but also by spot demand. The increase in the funding rate raises the cost of long positions and can create pressure when one-sided accumulations occur. The Chaikin Money Flow (CMF) indicator remaining in positive territory confirms that capital inflows into the market are continuing and buyer interest is sustained.
In the Ichimoku indicator, the price taking the kijun level, the tenkan line moving upward, and the kumo cloud thinning upward reinforce the short-term positive outlook. The kumo cloud widening further will be an important signal for the uptrend to solidify.
In technical scenarios, a break of the purple trend line could push the price up towards $114.761. A loss of the 111.949 level on the downside would increase selling pressure and could pull the price back down to $110.936. These levels play a critical role in the short term.
Support levels: 111,949 – 110,936 – 107,886
Resistance levels: 114,761 – 116,391 – 117,329
ETH/USDT
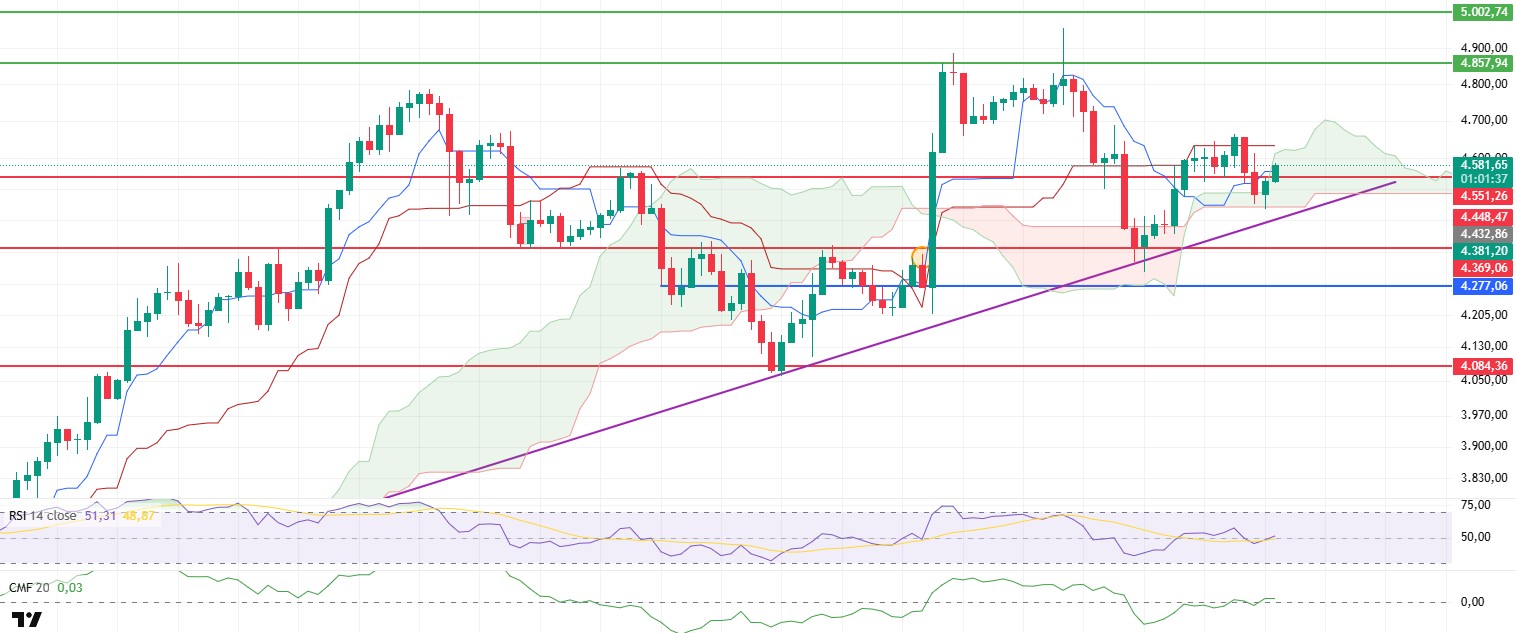
The ETH price faked out above the kijun level yesterday evening and then experienced a rapid pullback under pressure from sellers. The price retreated to the upper band of the kumo cloud. In the morning, there was a rebound from this area, and with buyers stepping in, first the 4,551 intermediate support level and then the tenkan line were taken upward. This movement indicates that short-term momentum has rebounded.
From an Ichimoku perspective, the price regaining the Tenkan level indicates positive short-term momentum. While the Tenkan line reflects short-term dynamics, the Kijun represents medium-term equilibrium. The price still moving within the kumo indicates that the trend is not yet fully clear, and daily closes above the $4,635 level are needed for a definitive confirmation of a reversal. Sustained closes above the kijun would facilitate a break of the kumo upper band and provide solid confirmation of strengthening buying momentum.
The Chaikin Money Flow (CMF) indicator remaining in positive territory confirms that capital inflows into the market are continuing, albeit limited, and that buyer appetite persists. A positive Chaikin Money Flow (CMF), especially when supported by increasing trading volume, makes upward attempts more reliable. However, relatively weak Chaikin Money Flow (CMF) values indicate that the uptrend may be fragile. Therefore, the trend-supporting power of Chaikin Money Flow (CMF) should be evaluated in conjunction with volume.
The Relative Strength Index (RSI) has crossed above the 50 level and is positioned above its moving average, technically supporting the buyers’ intent to take control.
Different scenarios should be considered. If net closes above $4,635 occur, an upward trend continuation and expansion of buying pressure are likely. Otherwise, daily closes below $4,551 could reignite selling pressure. If the lower band of the cloud at $4,476 is broken downward, sharp pullbacks may be seen.
Top of Form
Below the Form
Support levels: 4,551 – 4,369 – 4,277
Resistance levels: 4,857 – 5,000 – 5,346
XRP/USDT
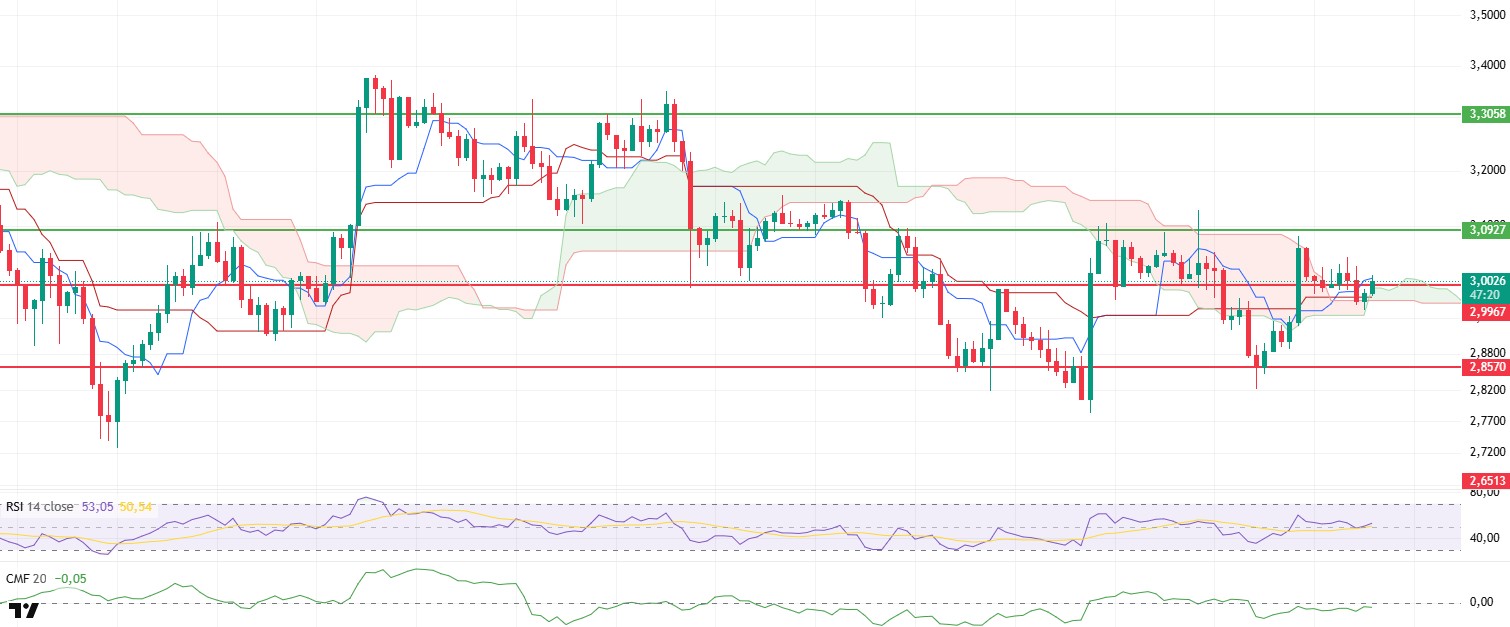
The XRP price continues its sideways movement with low volume at the edge of the cloud. After yesterday evening’s dip, which saw a pullback to the lower band of the cloud, buyers stepped in and pushed the price above the key support level of $2.99. With volume remaining weak, upward momentum is struggling to gain traction for now. Sustained movement above $2.99 is emerging as the primary condition for the continuation of the short-term recovery.
Chaikin Money Flow (CMF) maintains its horizontal trend in negative territory, indicating limited fresh money inflows and that buyer appetite has not yet strengthened. If CMF settles above the zero threshold, upward attempts could become more sustainable. The Relative Strength Index (RSI) is edging slightly higher, supported around the 50 level, suggesting a gradual recovery in the short term. An RSI rise into the 55–60 range could be monitored as a second confirmation that momentum is shifting in favor of prices.
The TK crossover formed by the Tenkan-sen cutting above the Kijun-sen on the Ichimoku indicator and the price’s attempt to hold above the Kumo cloud continue to generate positive signals. The strength of this signal increases as the price maintains its position above the upper band of the Kumo cloud and the Chikou Span settles above the price. As long as the price remains above the Tenkan line, the short-term trend is considered upward, while the Kijun line should be monitored as a dynamic support level in case of potential pullbacks.
In the short term, the intermediate resistance levels of $3.05 and $3.09 stand out. If $3.09 is clearly broken and hourly closes occur above it, an area towards $3.14 and $3.21 could form. Below, $2.99 is the first line of defense. Losing this level could trigger a pullback first to $2.94, then to the lower band of the cloud and the $2.90 area. Sustained trading below $2.90 would weaken the short-term positive scenario and bring the $2.86–$2.82 range into focus.
In summary, holding above $2.99 and breaking through $3.09 with volume support are the necessary conditions for the uptrend to continue. The CMF turning positive and the RSI settling above 55 would confirm this movement. A daily close below $2.99, however, could deepen the decline.
Supports: $2.9967 – $2.8570 – $2.6513
Resistances: 3.0927 – 3.3058 – 3.6554
SOL/USDT
Play Solana handheld gaming device will be released in October.
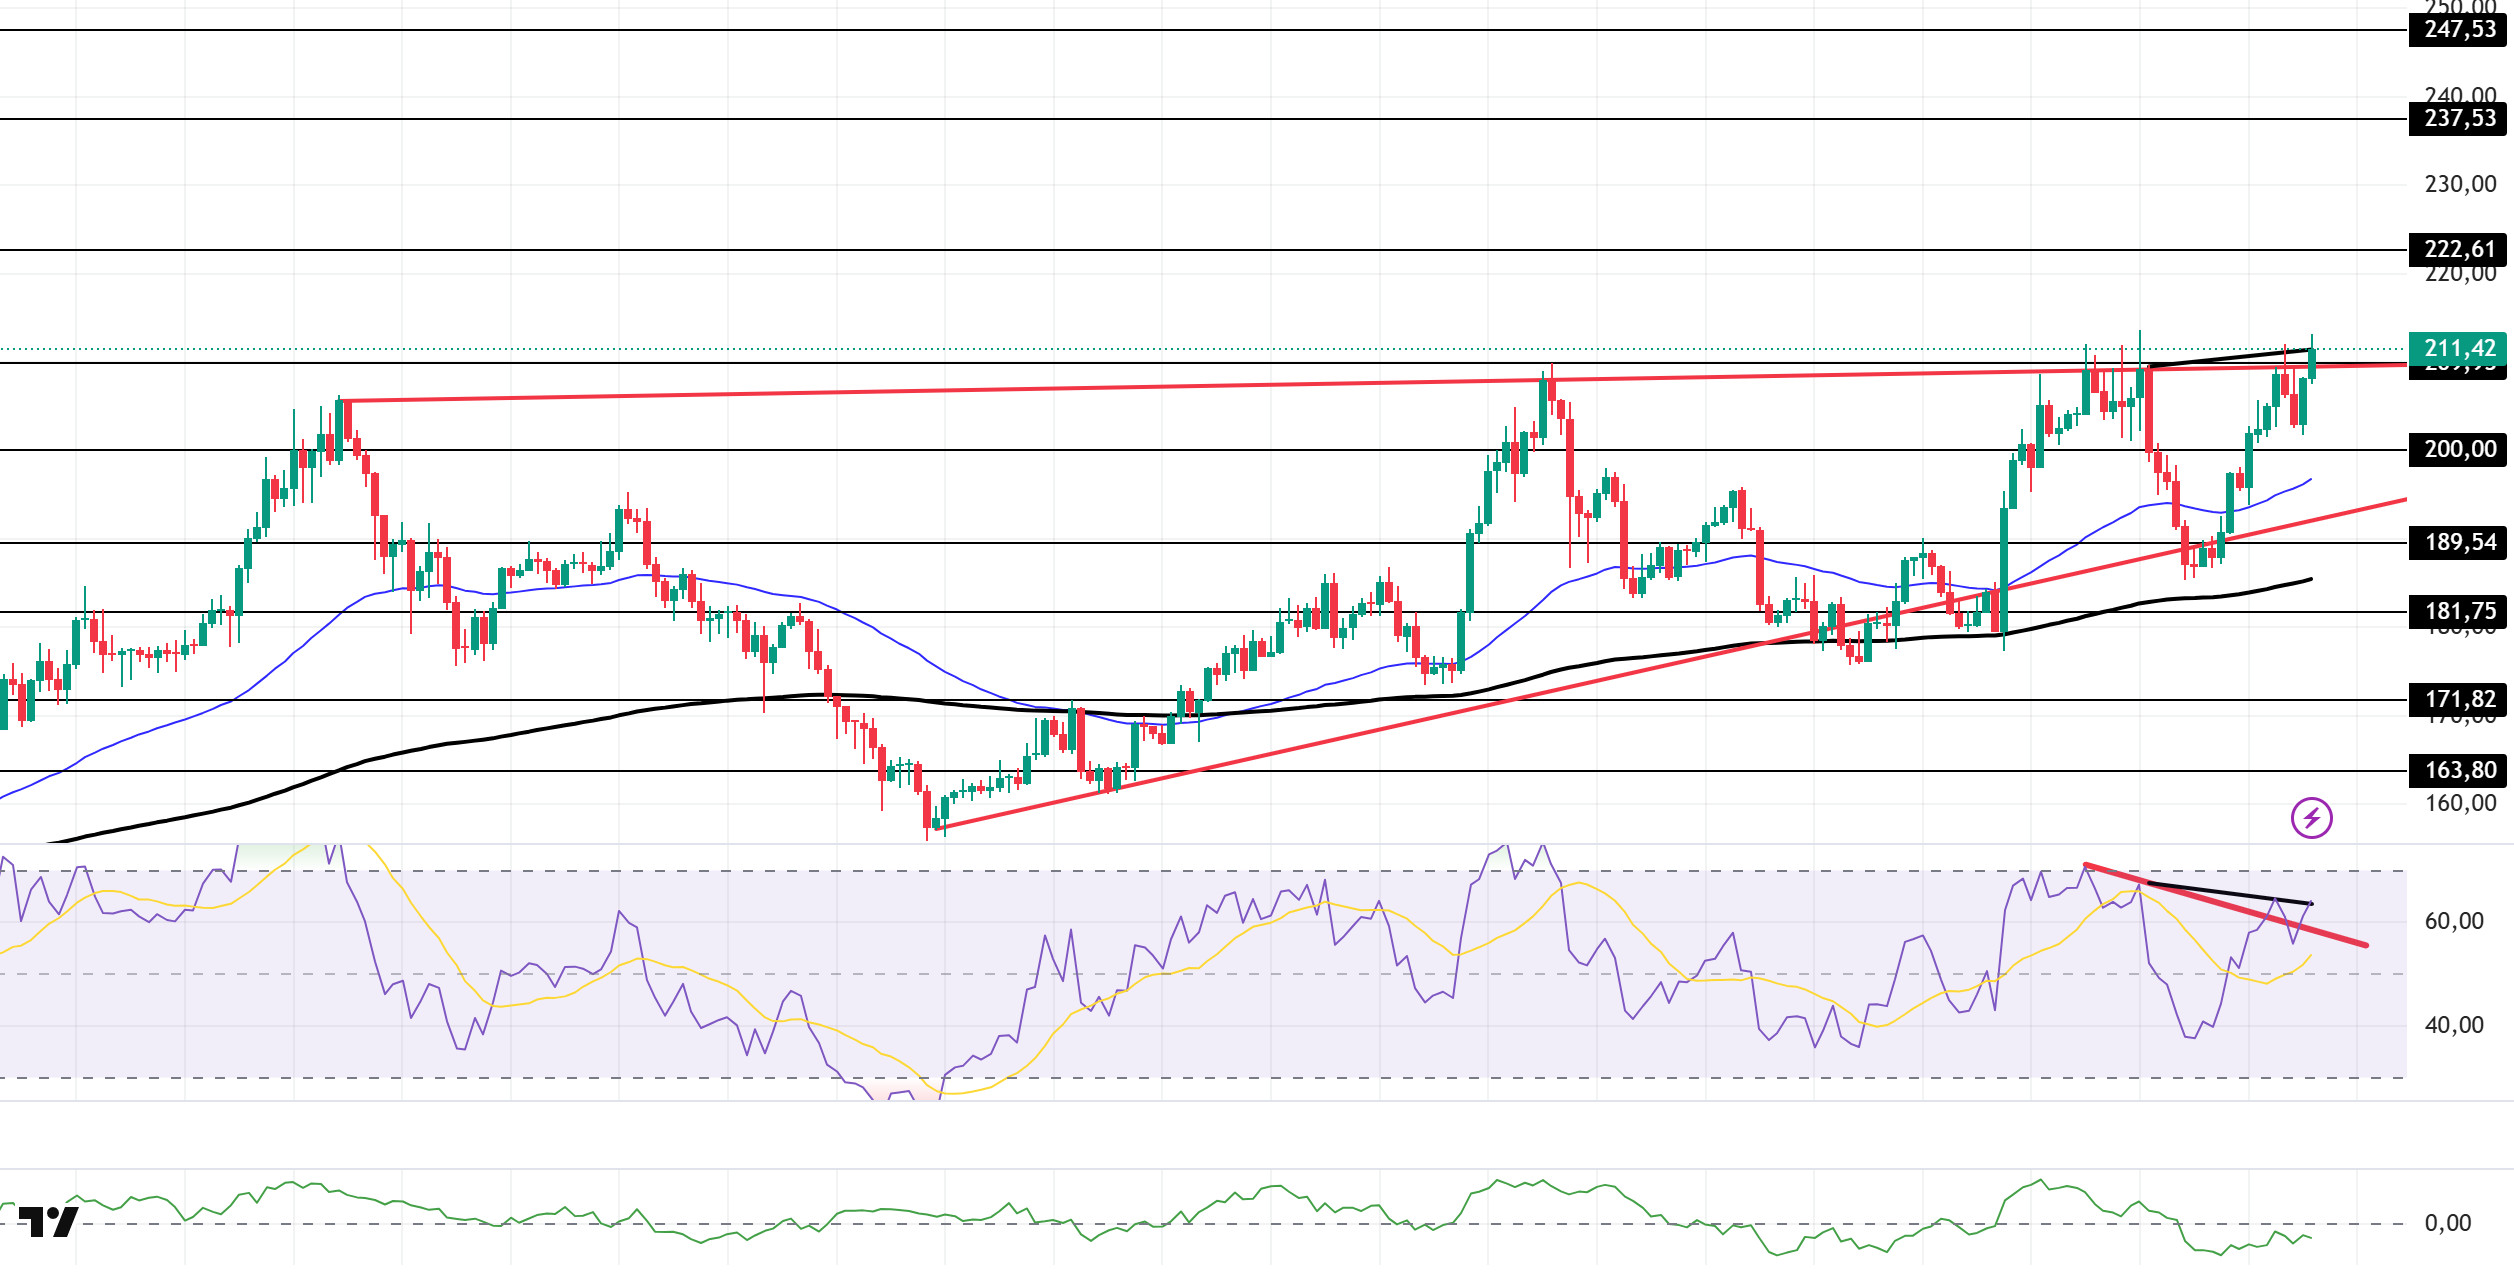
The SOL price continued its upward trend. The asset is currently testing the resistance level of the rising wedge formation that began on August 2. The $222.61 level can be monitored for bullish candle closes above this resistance. If a pullback begins, the $200.00 level could be retested as support.
On the 4-hour chart, the 50 EMA (Exponential Moving Average – Blue Line) remained above the 200 EMA (Black Line). This indicates that the upward trend could continue in the medium term. At the same time, the price being above both moving averages shows us that the market is trending upward in the short term. The Chaikin Money Flow (CMF-20) remained in negative territory. However, an increase in money inflows could push the CMF into positive territory. The Relative Strength Index (RSI-14) broke the downward trend that began on August 24, signaling buying pressure. However, bearish divergence could cause a pullback. In the event of an uptrend driven by macroeconomic data or positive news related to the Solana ecosystem, the $222.61 level stands out as a strong resistance point. If this level is broken upwards, the uptrend is expected to continue. In the event of pullbacks due to developments in the opposite direction or profit-taking, the $200.00 level could be tested. A decline to these support levels could increase buying momentum, presenting a potential opportunity for an uptrend.
Supports: 200.00 – 189.54 – 181.75
Resistances: 209.93 – 222.61 – 237.53
DOGE/USDT
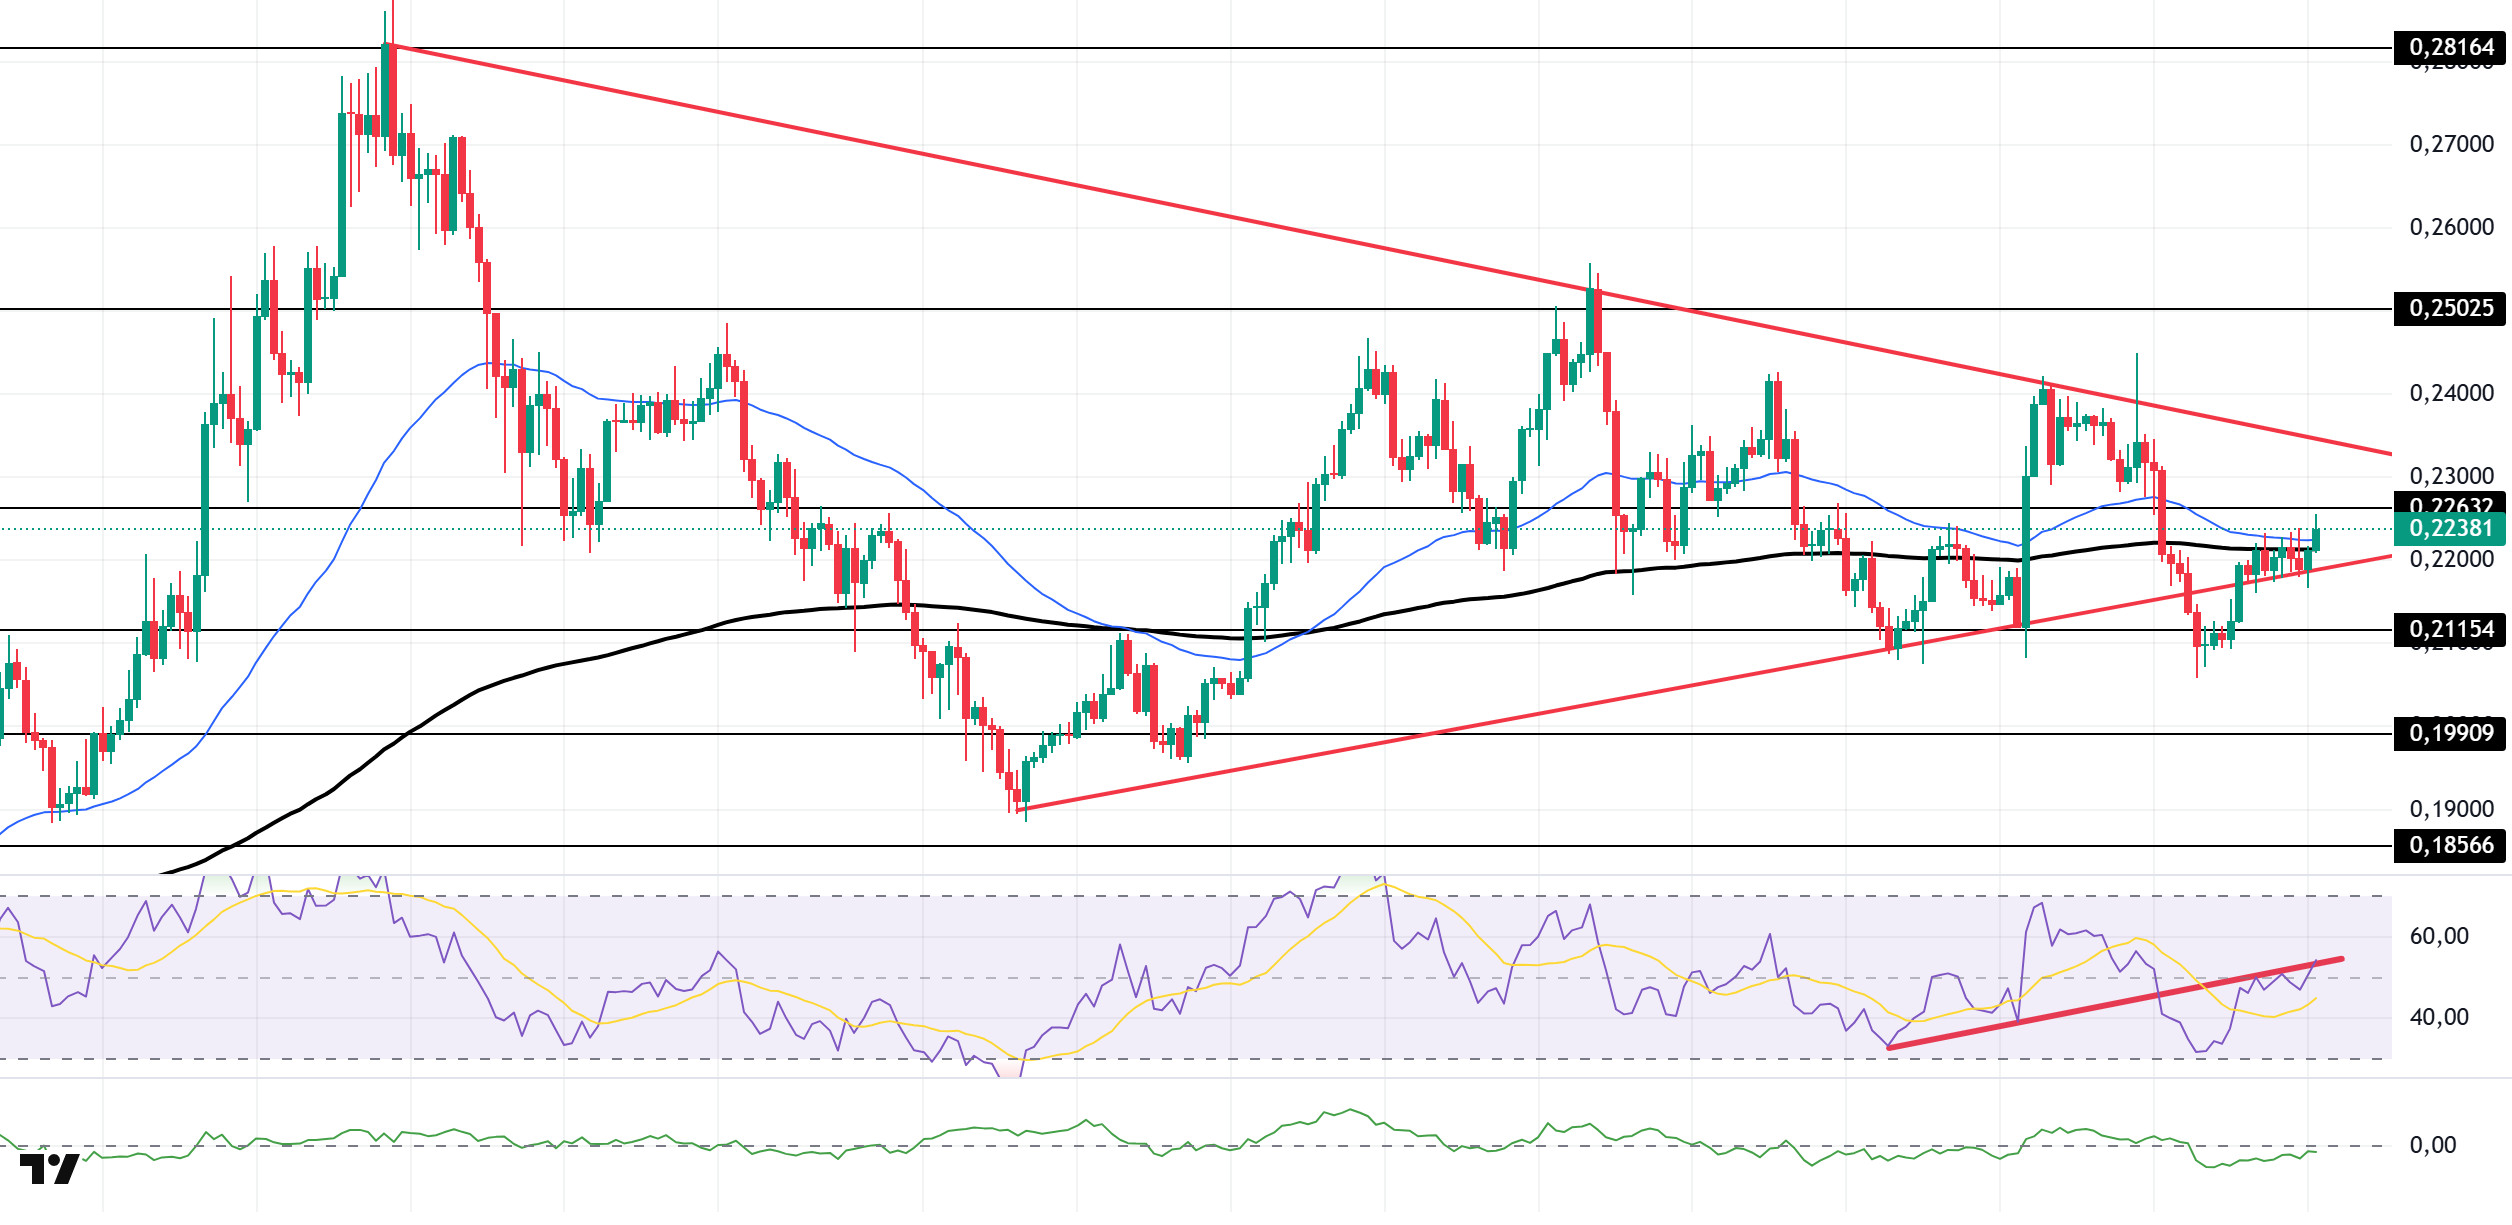
The DOGE price traded sideways. The asset continued to remain within the symmetrical triangle formation that began on August 2. Currently testing the 50 EMA (Exponential Moving Average – Blue Line) and 200 EMA (Black Line) moving averages as resistance, the price could test the $0.22632 level if it closes above the moving averages with a bullish candl . In case of a pullback, the $0.21154 level should be monitored.
On the 4-hour chart, the 50 EMA (Blue Line) continues to remain above the 200 EMA (Black Line). This indicates that the asset is in an upward trend in the medium term. The price being below both moving averages indicates that the asset is also trending downward in the short term. The Chaikin Money Flow (CMF-20) remained in negative territory. Additionally, a decrease in money inflows could push the CMF deeper into negative territory. The Relative Strength Index (RSI-14) rose into positive territory. At the same time, it is currently testing the resistance level of the upward trend that began on August 19. If it breaks through, upward pressure may increase. In the event of an upward movement driven by political developments, macroeconomic data, or positive news flow in the DOGE ecosystem, the $0.22632 level stands out as a strong resistance zone. Conversely, in the event of negative news flow, the $0.21154 level could be triggered. A decline to these levels could increase momentum and potentially initiate a new upward wave.
Supports: $0.21154 – $0.19909 – $0.18566
Resistances: 0.22632 – 0.25025 – 0.28164
TRX/USDT
As of August 27, 2025, the total amount of TRX staked is 45,359,909,082, which is 47.92% of the circulating supply. Thus, nearly half of the circulating supply is locked, keeping supply pressure limited.
Additionally, a total of 6,002,254 TRX was burned yesterday, permanently removing 2,086,542 TRX from the circulating supply. This contributes to reducing inflationary pressure on the Tron network.
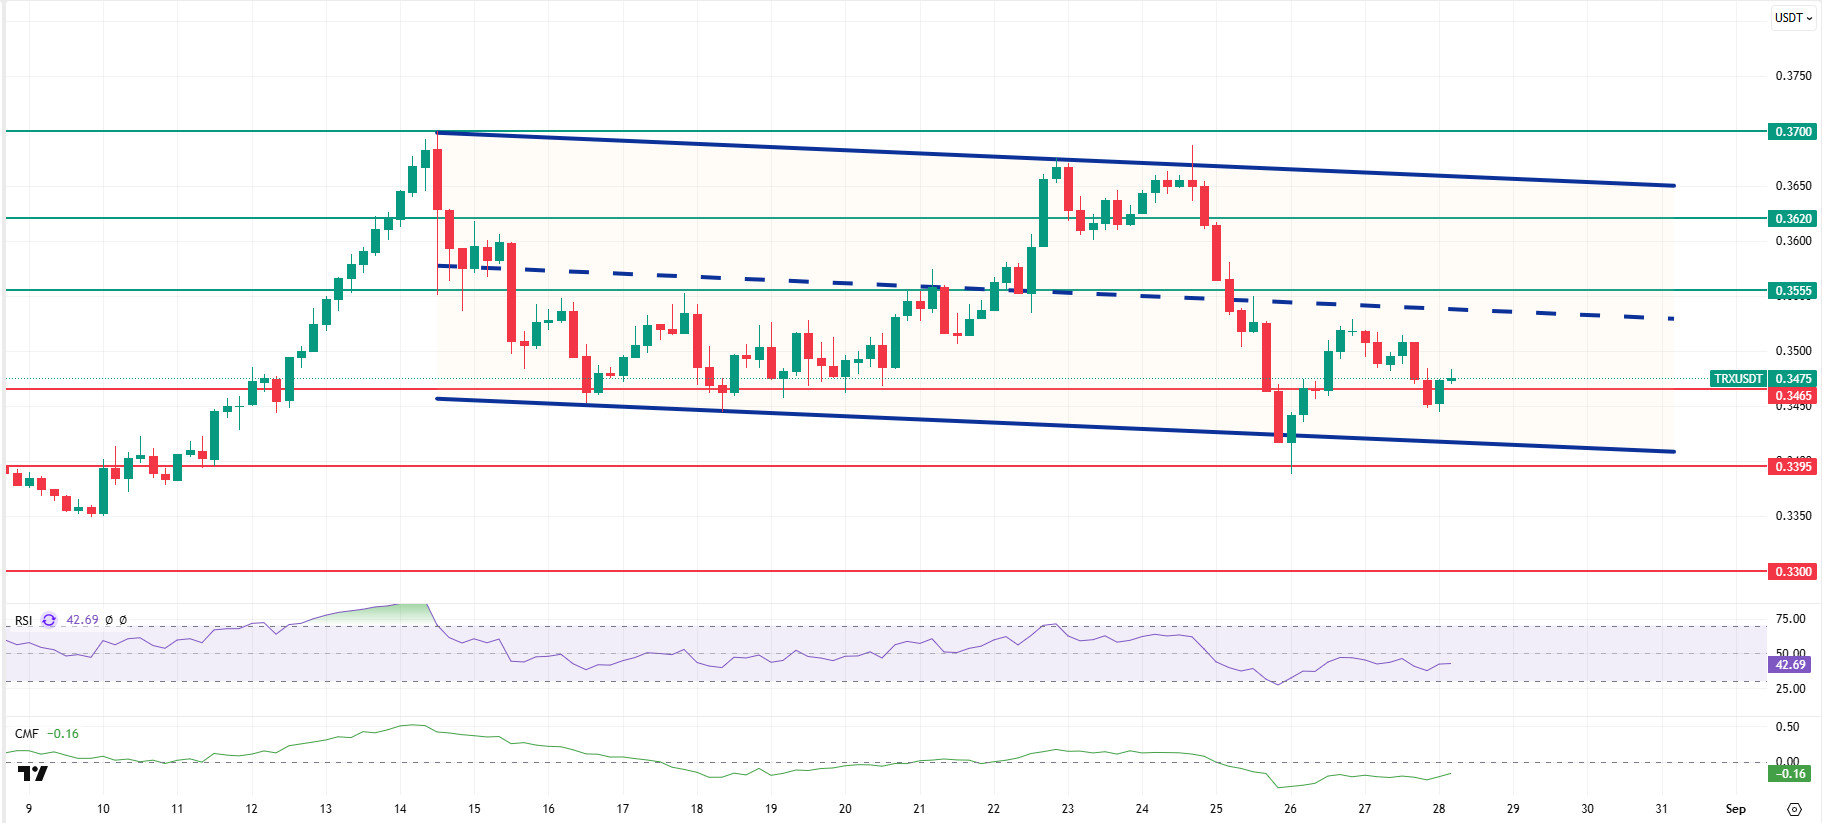
Technically speaking, TRX closed at 0.3451 yesterday after a decline near the close and rose slightly in the morning hours, currently trading at 0.3475. Currently trading near the lower band of the bearish channel, TRX is priced just above the 0.3465 support on the 4-hour chart. The Relative Strength Index (RSI) value is 42, indicating a sell zone. In addition, the Chaikin Money Flow (CMF) indicator is also in negative territory at -0.16, indicating a decrease in cash inflows. This situation signals that buyer pressure in the market is weakening and that selling movements may gain short-term strength.
In light of all these indicators, TRX may rise slightly in the first half of the day, testing the 0.3555 resistance level based on its current zone and RSI value. If it closes above this resistance level, it may continue to rise and move towards the upper band of the channel, testing the 0.3620 resistance level. If it fails to close above the 0.3555 resistance level and the CMF continues its negative trend, the resulting selling pressure could push it towards the lower band of the bearish channel, testing the 0.3465 and 0.3395 support levels in sequence.
On the 4-hour chart, 0.3300 is an important support level, and as long as it remains above this level, the upward momentum is expected to continue. If this support is broken, selling pressure may increase.
Supports: 0.3465 – 0.3395 – 0.3300
Resistance Levels 0.3555 – 0.3620 – 0.3700
SUI/USDT
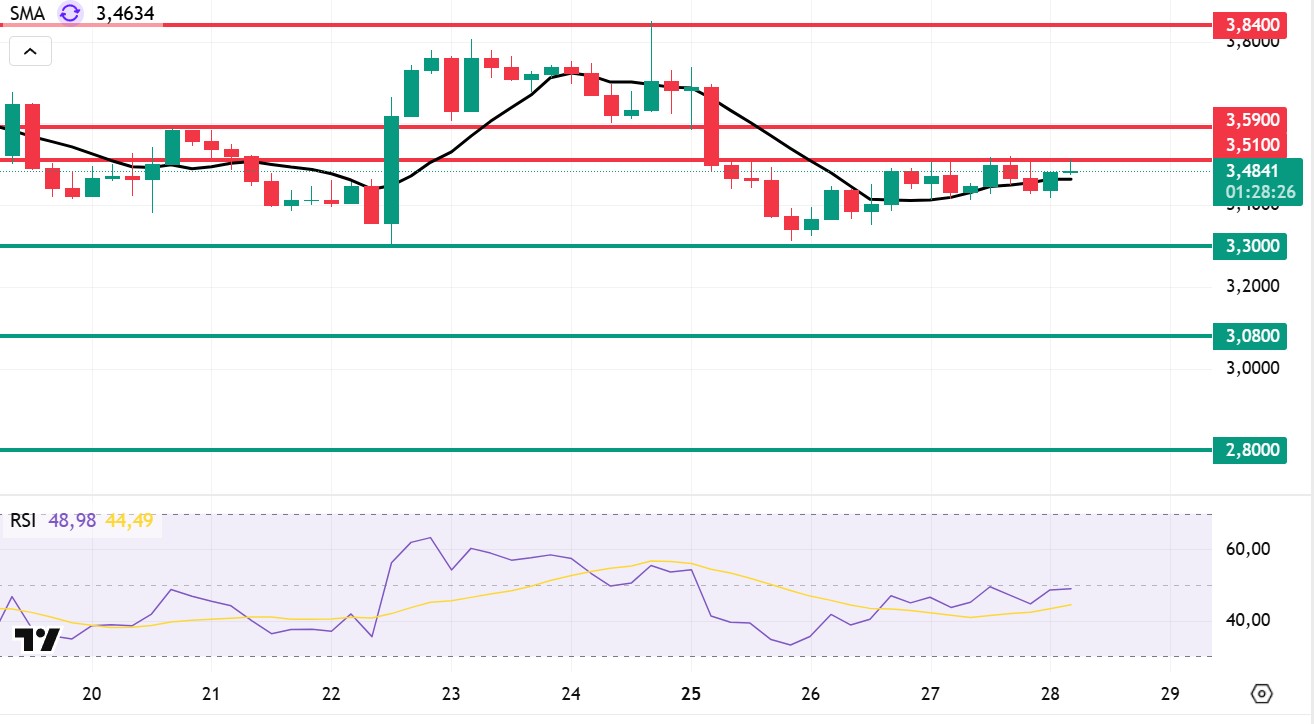
Looking at Sui’s technical outlook, we see that the price has fallen on a weekly basis to around $3.48, influenced by fundamental developments. The Relative Strength Index (RSI) is currently in the 48.98 – 44.49 range. This range indicates that the market is trading close to the sell zone; however, if the RSI weakens and falls to the 30.00 – 35.00 range, it could signal a potential buying point. If the price moves upward, the resistance levels of $3.51, $3.59, and $3.84 can be monitored. However, if the price falls to new lows, it could indicate that selling pressure is intensifying. In this case, the $3.30 and $3.08 levels stand out as strong support zones. In particular, in the event of a sharp sell-off, a pullback to $2.80 appears technically possible.
According to Simple Moving Averages (SMA) data, Sui’s average price is currently at the $3.46 level. The price remaining below this level indicates that the current downtrend could technically continue. The downward trend of the SMA also supports this situation.
Supports: 2.80 – 3.08 – 3.30
Resistances: 3.51 – 3.59 – 3.84
Legal Notice
The investment information, comments, and recommendations contained herein do not constitute investment advice. Investment advisory services are provided individually by authorized institutions taking into account the risk and return preferences of individuals. The comments and recommendations contained herein are of a general nature. These recommendations may not be suitable for your financial situation and risk and return preferences. Therefore, making an investment decision based solely on the information contained herein may not produce results in line with your expectations.


