
Technical Analysis
BTC/USDT
It was announced that the White House’s first cryptocurrency policy report will be published on July 30. Bo Hines, Executive Director of Trump’s Digital Assets Advisory Committee, stated that this report is the product of the 180-day work of the Digital Asset Task Force. The White House also announced a new plan to support the rapid construction of artificial intelligence data centers. President Trump said tariffs ranging from 15% to 50% would be imposed on most countries. According to Tesla’s second quarter report for 2025, the company’s Bitcoin assets reached 11,509, while the total value of these assets was recorded as $ 1.2 billion.
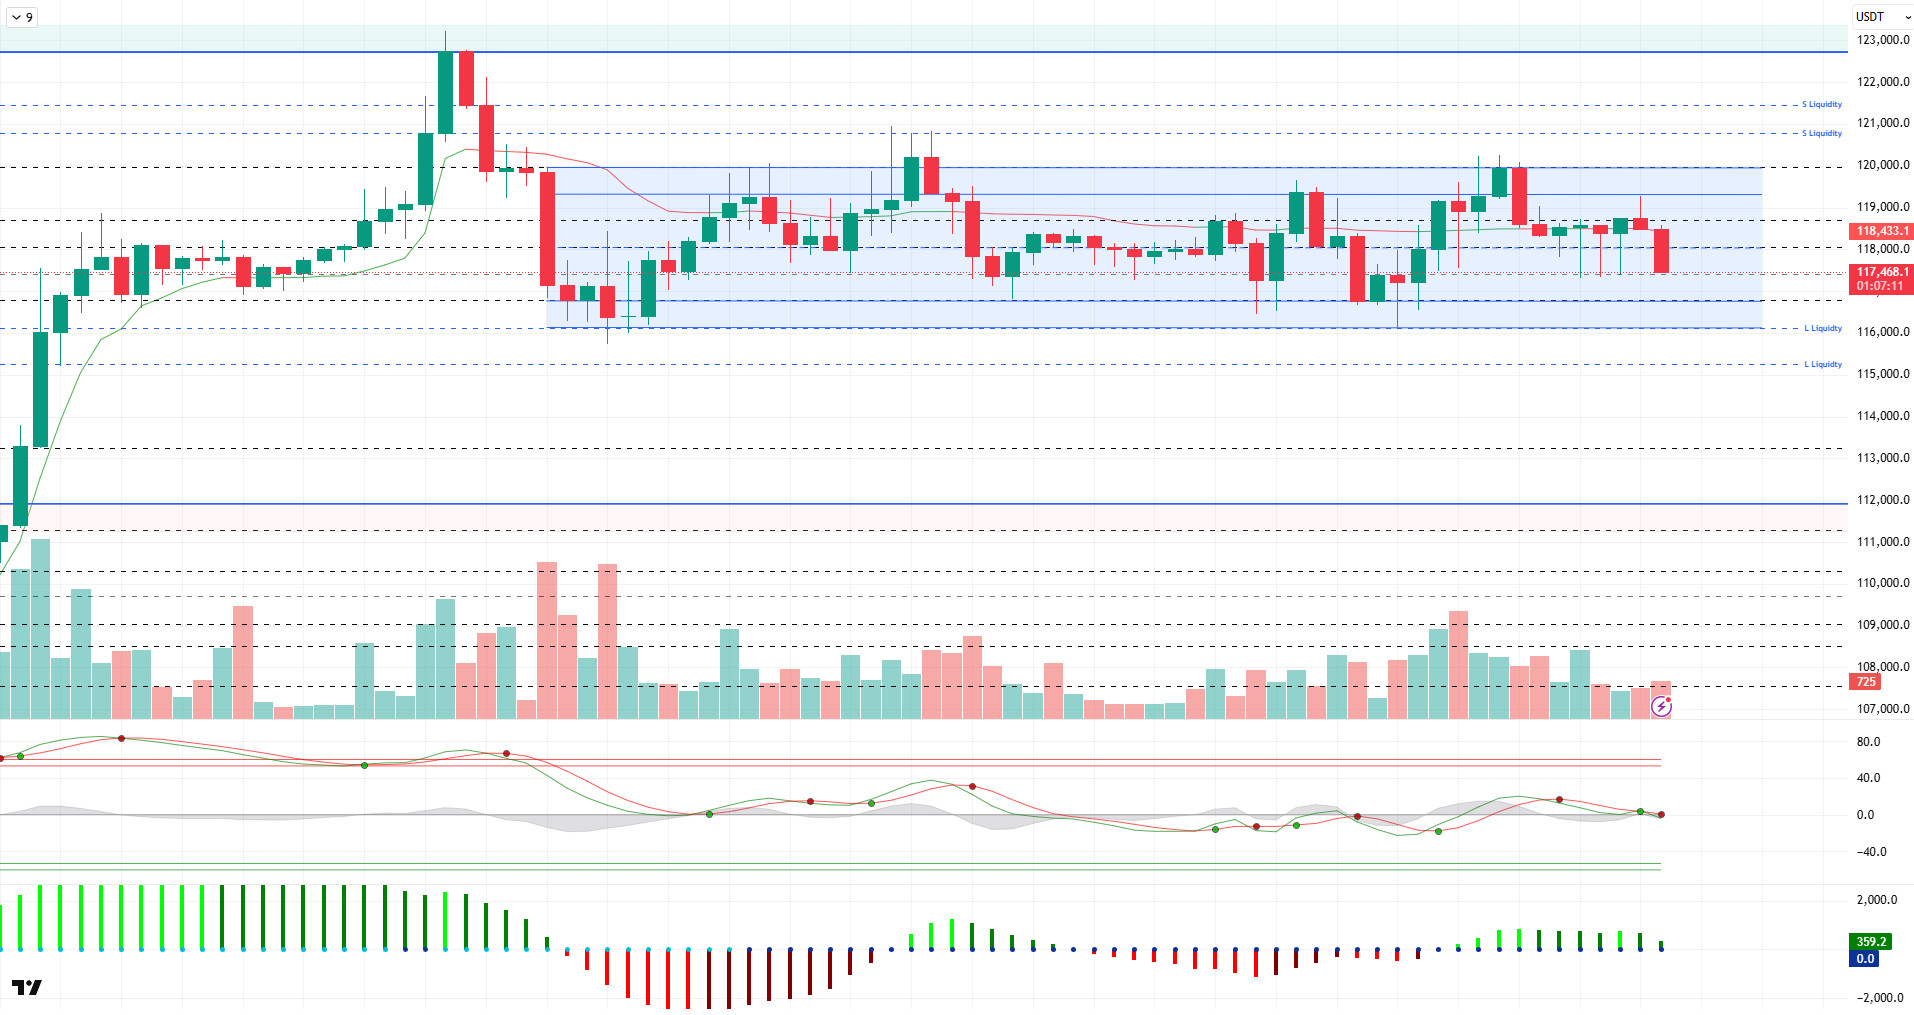
Looking at the technical outlook, BTC price continues to consolidate horizontally near the ATH level. BTC, which has been moving in the 116,000 – 119,000 band for a while, is rebalancing within this range, although it occasionally sags outside these levels. BTC, which occasionally pins at the 117,350 level, continues to trade at 117,600 with slight sellers compared to the previous analysis.
Looking at the technical indicators, the Wave Trend (WT) oscillator continues to move in the mid-channel band with the recent decline, while weakening. The histogram on the Squeeze momentum (SM) indicator regained momentum and moved into the positive zone, but did not gain momentum. The Kaufman moving average is just above the price at 118.450.
When the liquidity data is analyzed, 115,000 – 116,000 stands out as the buying level, while the selling level seems to intensify above 120,000. The liquidity zones of the price stand out as areas expected to receive a reaction.
In summary, the price continues to consolidate near the ATH level as fundamental developments continue to contribute positively to pricing. While the technical outlook causes horizontal movements with an unstable structure in the short term, liquidity data determines the limits of price movements. In the continuation of the rise, closes above the 120,000 minor resistance point may bring new ATH levels to the agenda. In a possible selling pressure, closures below the 118,600 support level may lead the price towards the 115,000 liquidity level.
Supports 118,600 – 117,500 – 116,800
Resistances 120,000 – 121,000 – 123,300
ETH/USDT
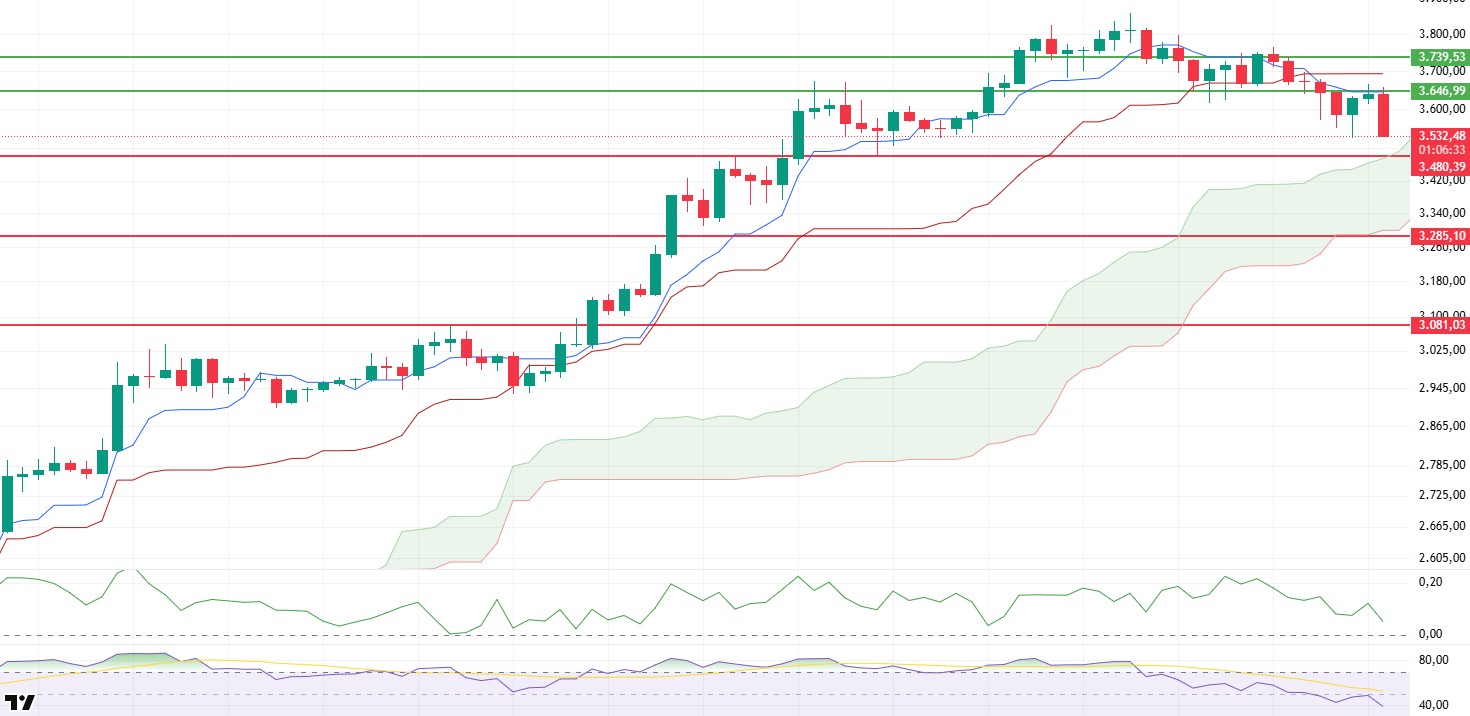
Despite a net inflow of $332 million into spot ETH ETFs yesterday, the strong demand was insufficient to push the price higher. With the loss of the $3,646 level, ETH experienced a sharp pullback as expected and fell as low as $3,530. With the short-term buying reaction in this region, a re-test towards the $ 3,646 level took place in the night hours. However, with the sales coming from this critical resistance level, the ETH price started a downward trend again.
When technical and on chain indicators are analyzed, it is seen that the open interest data, which is the total value of open positions in the futures market, decreased to $ 23.66 billion. This decline indicates that especially long positions have been closed and investors have adopted a cautious stance. This suggests that the market does not have the strength to sustain the rise for the time being.
Looking at the Ichimoku indicator, a sell signal has been formed as the tenkan level, a short-term directional indicator, crosses the kijun level, a more medium-term indicator, downwards. While this technical structure is still valid, it shows that the price may decline to the upper band of the kumo cloud. The $ 3,480 region, which corresponds to this level, stands out as the most critical support in the short term. The loss of this support indicates that the market will maintain the downward momentum, especially despite spot demand, and the decline may deepen more sharply.
On the liquidity side, the Chaikin Money Flow (CMF) indicator remains in positive territory, but continues to decline. This indicates that money inflows to the market have slowed down and started to be replaced by outflows. This negative structure of CMF indicates that short-term liquidity has weakened and selling pressure has started to increase.
On the momentum side, both Momentum and Relative Strength Index (RSI) indicators continue to produce weakness signals. In particular, the fact that the RSI level remains below its underlying moving average and breaks the 50 threshold level downwards indicates that the decline has gained momentum in technical terms and the pressure continues.
As of the general outlook, it seems quite possible that the ETH price may retreat to the $3,480 level during the day. If a strong buyer’s reaction does not occur at this level, a structure where deeper and faster retracements may occur. On the other hand, the negative technical outlook will remain valid unless the $3,646 level is exceeded again. However, exceeding this level in volume may disrupt the downward trend and pave the way for the resumption of an upward trend. In this respect, the $3,646 level is very critical in terms of both the direction of the trend and the break threshold of the market structure.
Top of Form
Below the Form
Supports 3,480 – 3,825 – 3,081
Resistances 3,646 – 3,739 – 4,084
XRP/USDT
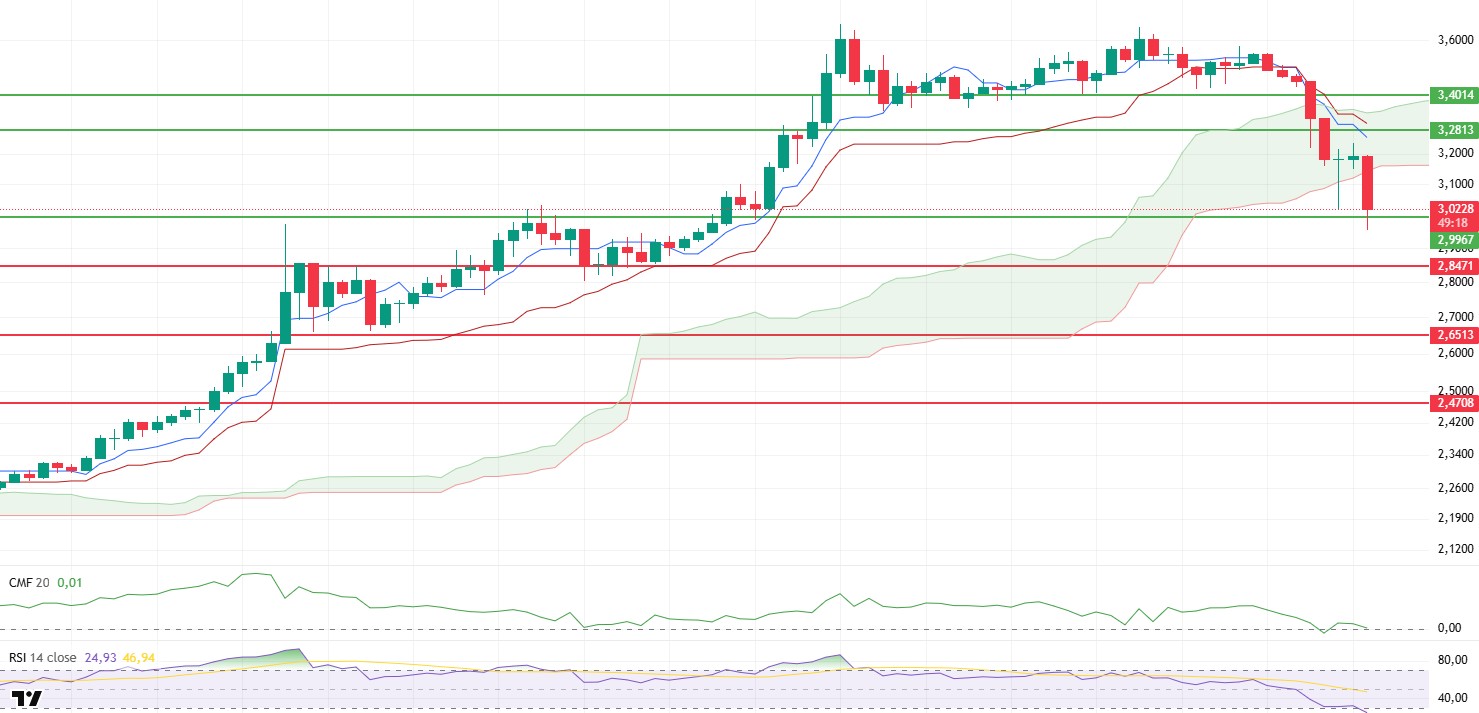
XRP accelerated its decline by losing the intermediate support zone at $3.28 in the evening hours yesterday and fell to the main support line at $2.99. Although this region seems to be trying to hold the price momentarily as it is a region where strong buying reactions have historically come from, the technical outlook is still weak and the bearish trend remains dominant.
Looking at the Ichimoku indicator, the short-term directional indicator tenkan crossed kijun, a more intermediate-term indicator, on the downside, signaling a strong sell signal. However, the price dipped below the kumo cloud, indicating a confirmation of the negative trend. Structures priced below the kumo cloud generally indicate that the bearish trend may deepen further, and this technical structure is currently valid for XRP.
On the momentum side, the outlook is also negative. The Relative Strength Index (RSI) indicator has entered oversold territory. Although this level is usually an area where short-term reactions can occur, the RSI entering this zone is not a turn signal on its own. Rather, it shows that the momentum of the current bearish move is still strong and the market continues to weaken. The RSI spending more time in this zone suggests that the pressure on the price may continue.
The overall technical outlook suggests that XRP is likely to continue its decline and retreat to the next support area at $2.84, given the breakouts at the support levels and the weakness in the indicators. If this level is reached, the reaction of the price here could be decisive for the direction of the trend. On the other hand, if the price reacts from the current levels and breaks the lower band of the kumo cloud upwards again, this movement may be interpreted as a correction and the possibility of the upward trend regaining strength may come to the table. However, for this scenario to be valid, the price needs to break through both the lower band of the cloud and the short-term resistances in volume. For now, the weight is in favor of a continuation of the downtrend.
Supports 2.9967 – 2.8471 – 2.6513
Resistances 3.2813 – 3.4014 – 3.8615
SOL/USDT
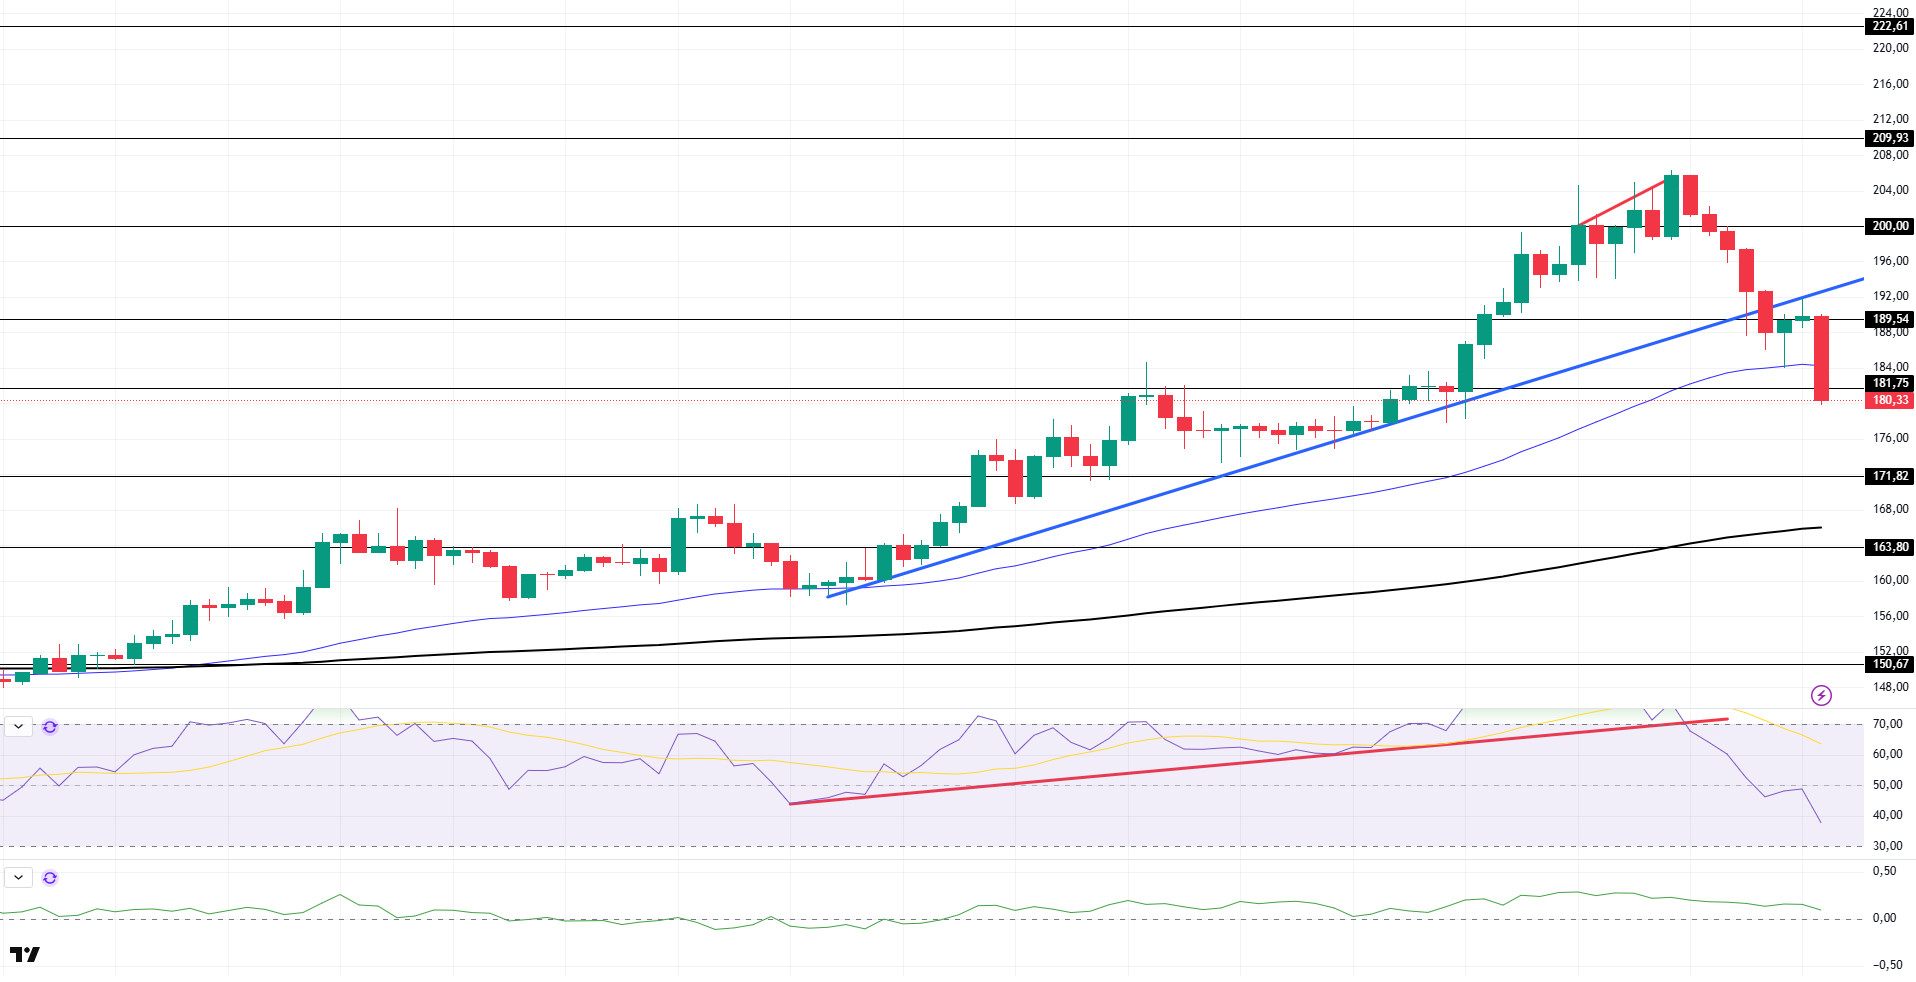
SOL price continues to experience a pullback. The asset broke the uptrend that started on July 15 to the downside and lost momentum. Supported by the 50 EMA (Blue Line) moving average, the price accelerated slightly but tested the uptrend as resistance and retreated. If the retracement continues, the $ 181.75 level can be followed. In case of a rise, it may test the $ 200.00 level.
On the 4-hour chart, the 50 EMA (Blue Line) continues to be above the 200 EMA (Black Line). This suggests that the bullish trend may continue in the medium term. At the same time, the fact that the price is above both moving averages suggests that the market is currently in a bullish trend in the short term. On the other hand, a large difference between the two moving averages may trigger a bearish or sideways trend. Chaikin Money Flow (CMF-20) remained in positive territory. However, a decrease in money inflows may move CMF into negative territory. Relative Strength Index (RSI-14), on the other hand, moved into negative territory and increased selling pressure. However, the negative mismatch worked. In addition, the uptrend that started on July 15 has broken downwards. In case of an uptrend due to macroeconomic data or positive news on the Solana ecosystem, the $200.00 level stands out as a strong resistance point. If this level is broken upwards, the rise can be expected to continue. If there are pullbacks due to contrary developments or profit realizations, the $ 181.75 level can be tested. In case of a decline to these support levels, the increase in buying momentum may offer a potential bullish opportunity.
Supports 181.75 – 171.82 – 163.80
Resistances 189.54 – 200.00 – 209.93
DOGE/USDT
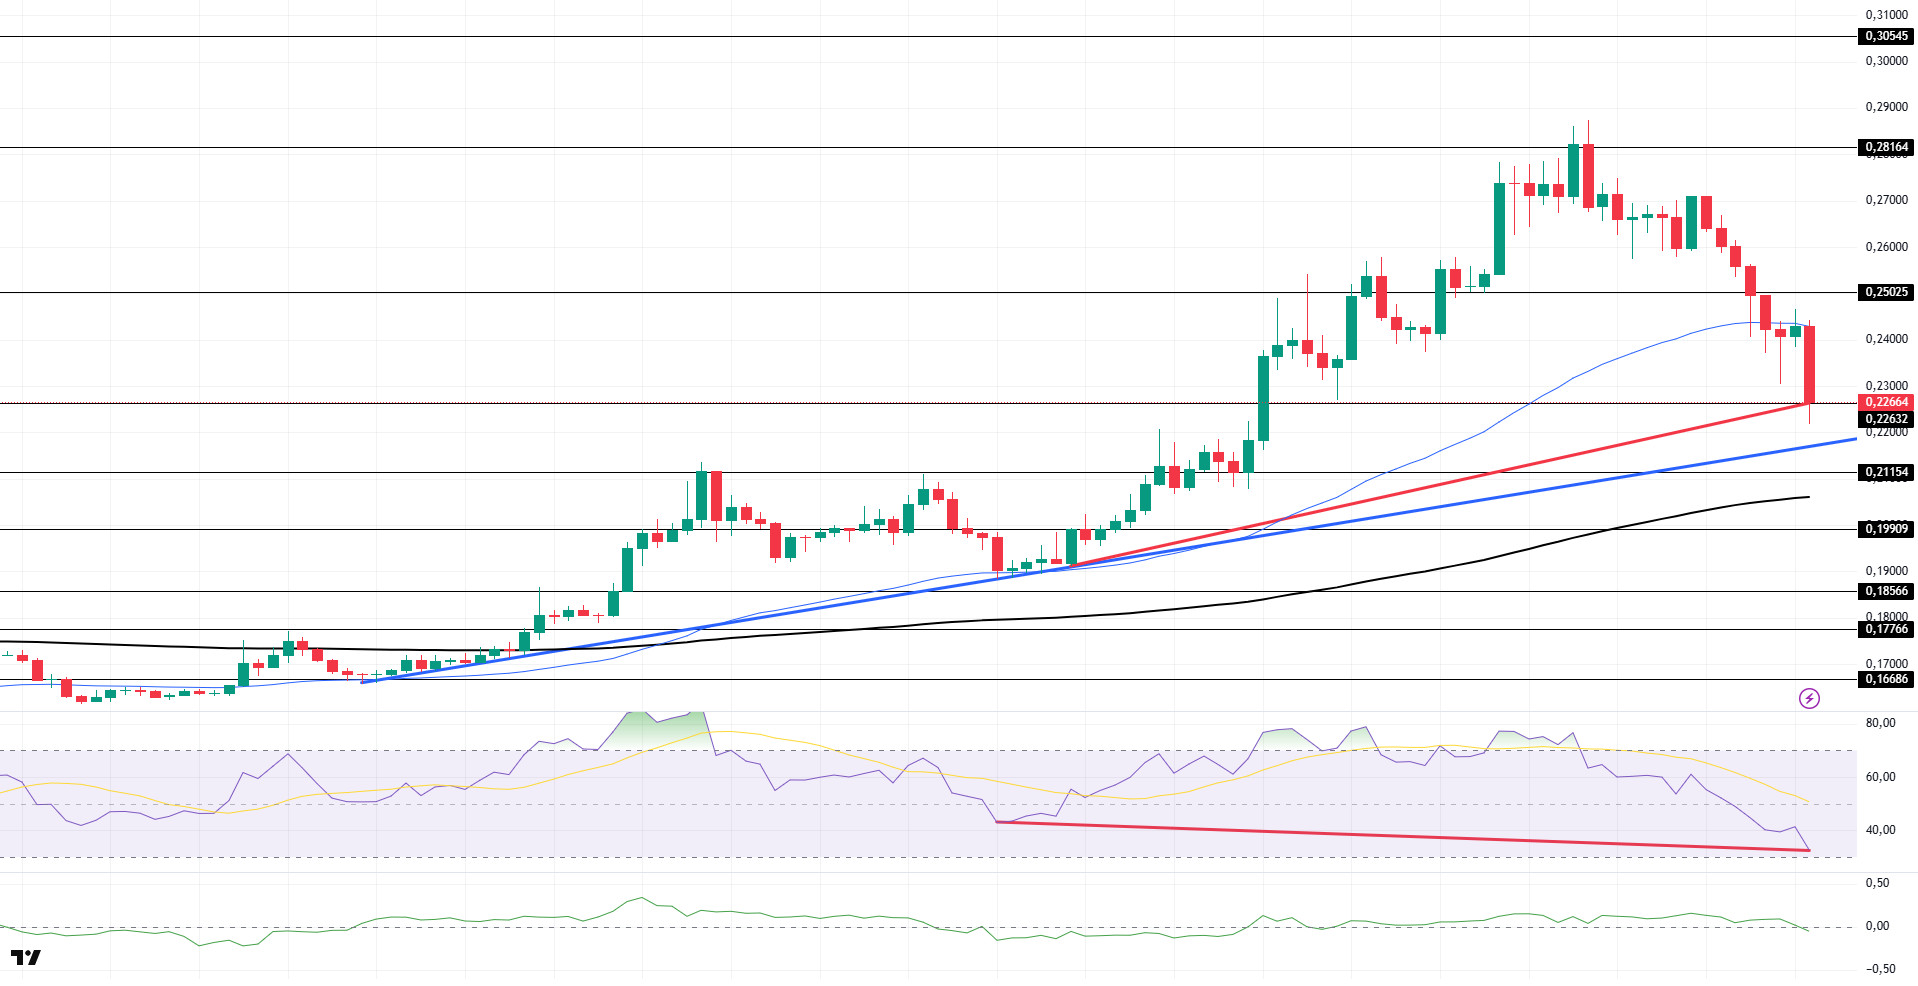
DOGE price continued its decline. The asset continued to stay above the 200 EMA (Black Line) moving average with the uptrend that started on July 7. The price, which tested the $ 0.25025 level as support, broke it downwards and deepened its decline and remained below the 50 EMA (Blue Line) moving average. In case of a continuation of the retreat, the $ 0.22632 level should be followed. If the upward acceleration resumes, it may test the $ 0.28164 level.
On the 4-hour chart, the 50 EMA (Blue Line) continues to be above the 200 EMA (Black Line). This suggests that the asset is bullish in the medium term. The fact that the price is between both moving averages indicates that the asset is in the decision phase in the short term. A large difference between the two moving averages may cause the price to follow a bearish or sideways trend. Chaikin Money Flow (CMF-20) is in neutral territory. In addition, negative money inflows may move CMF into negative territory. Relative Strength Index (RSI-14) retreated to the middle of the negative zone. In addition, there is a positive mismatch pattern. This may push the price higher. The $0.25025 level stands out as a strong resistance zone in the event of a rally in line with political developments, macroeconomic data or positive news flow in the DOGE ecosystem. In the opposite case or possible negative news flow, the $0.22632 level may be triggered. In case of a decline to these levels, the momentum may increase and a new bullish wave may start.
Supports 0.22632 – 0.21154 – 0.19909
Resistances 0.25025 – 0.28164 – 0.30545
Legal Notice
The investment information, comments and recommendations contained herein do not constitute investment advice. Investment advisory services are provided individually by authorized institutions taking into account the risk and return preferences of individuals. The comments and recommendations contained herein are of a general nature. These recommendations may not be suitable for your financial situation and risk and return preferences. Therefore, making an investment decision based solely on the information contained herein may not produce results in line with your expectations.
