
Technical Analysis
BTC/USDT
According to CoinShares data, $1.9 billion flowed into digital asset funds last week; $977 million of this went to Bitcoin and $772 million to Ethereum. Total assets under management reached a yearly high of $4.04 billion. Strategy increased its reserves to 639,835 BTC by purchasing an additional 850 BTC. US-based Strive Inc. purchased 5,816 BTC as part of its merger agreement with Semler Scientific, bringing its total holdings to 5,886 BTC; the company is expected to hold over 10,900 BTC after the merger.
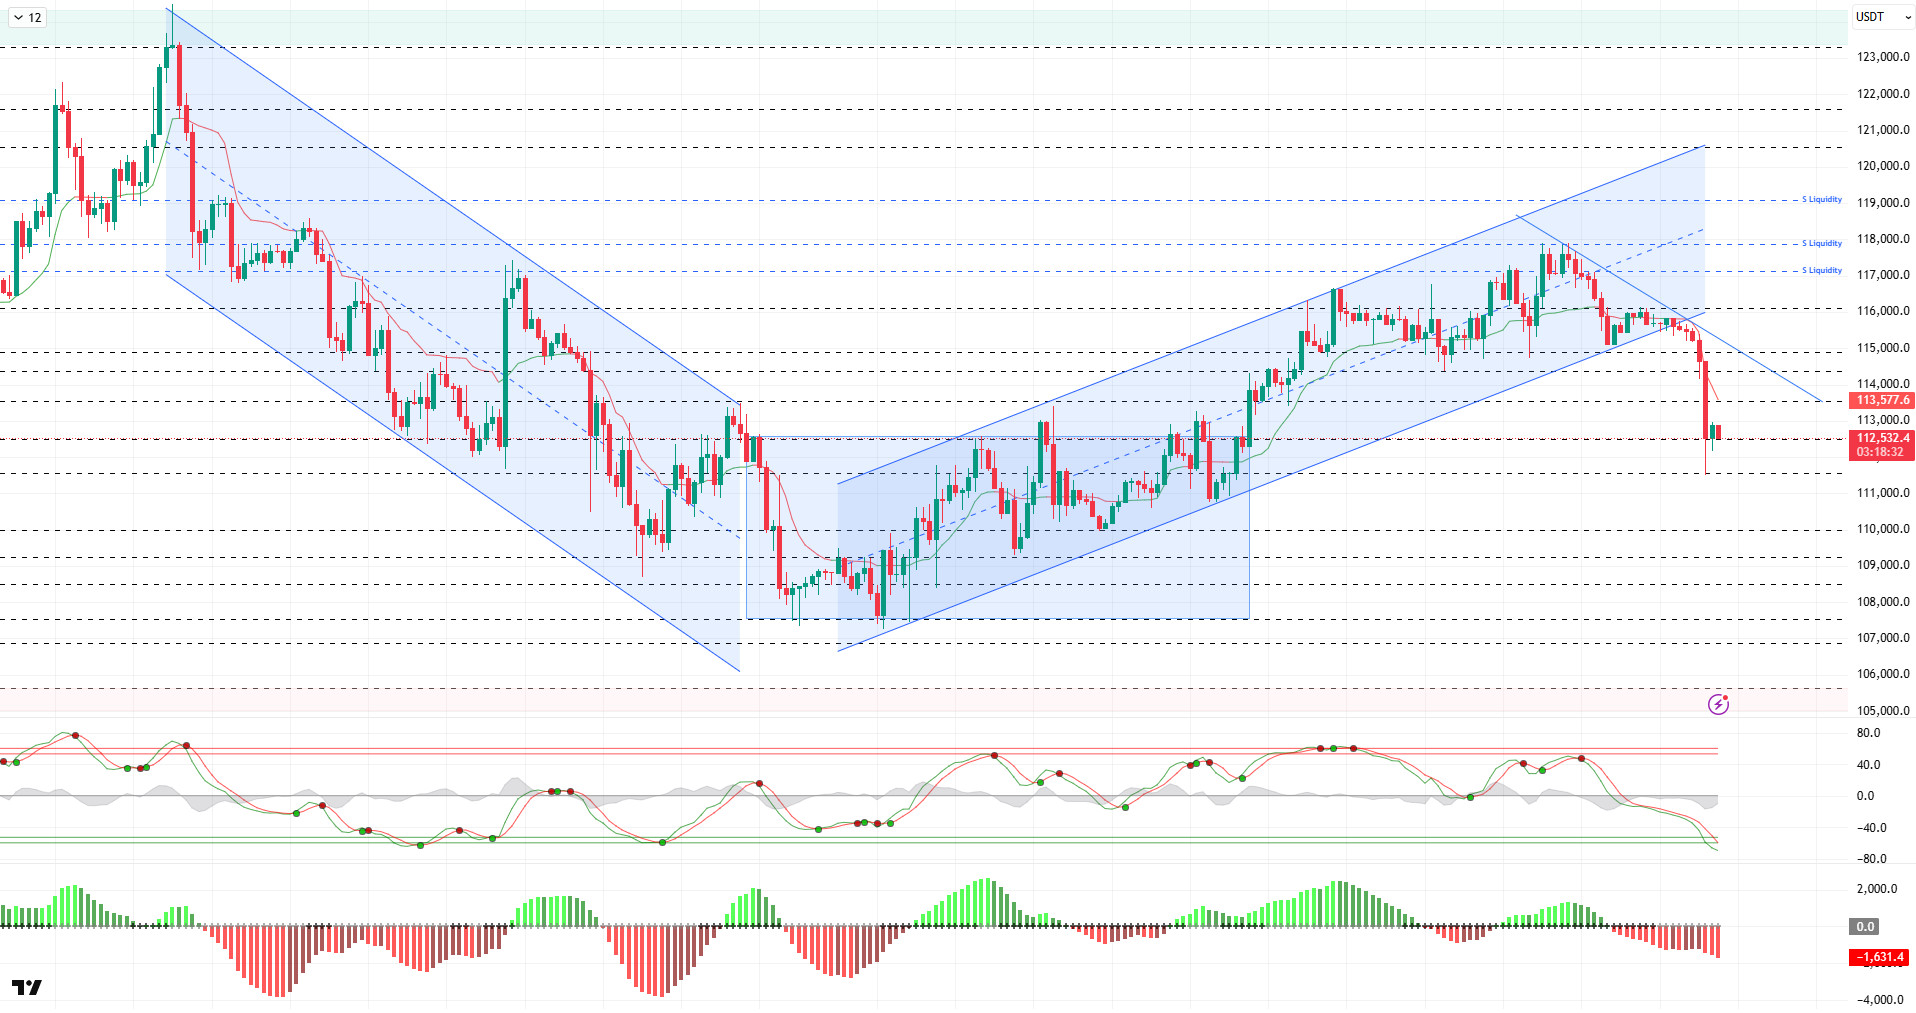
Looking at the technical picture, BTC, which moved within the 115,000 – 116,000 band over the weekend, felt selling pressure last night and fell back to the critical reference and trend lower band point of 115,000. Then, this morning, with increased selling pressure, the 115,000 support level was broken with high volume, and the price fell to 111,400. After that, BTC experienced some recovery, and while volatile movements continue, the price is trading at 112,500.
Technical indicators show that the Wave Trend oscillator (WT) has moved into the oversold zone after giving a sell signal in the overbought zone following the trend reversal. The Squeeze Momentum (SM) indicator shows weakening within the negative histogram area, while the Kaufman moving average is currently trading above the price at the 114,500 level.
According to liquidity data, the recent decline resulted in a total of $1.03 billion in liquidations from buy-side transactions in the crypto markets. Among these liquidations, BTC ranked second after ETH with $212 million. Looking at the buy levels, the 113,000–114,000 band stood out as an accumulation zone, while the 112,800 level drew attention as a strong concentration point. On the other hand, a significant increase is observed in the selling tiers after the decline. On this side, the 116,800 level is a short-term accumulation zone, while the 118,000–119,000 band stands out as an important liquidity area in a broader time frame.
In summary, while there is no clear fundamental catalyst for recent sales, selling pressure from futures trading appears to have deepened the decline. Although there are no new developments in the market that would change the positive picture, developments later in the day will be an important reference point for whether the price’s fragile structure will continue. On the technical side, the upward structure has been broken with the price falling below the 115,000 reference level of the upward channel. Liquidity data continues to determine the direction of the market: with the recent decline, buy orders have been cleared, while a significant increase in sell orders stands out. In this context, for the price to recover, it must first regain the 114,000 level, followed by closes above 115,000. This scenario could prevent a negative outlook. However, if selling pressure persists and the 112,600 level is broken, the next important support level to watch will be 111,500.
Supports 112,600 – 111,400 – 110,000
Resistances , 114,000 – 115,000 – 116,100
ETH/USDT
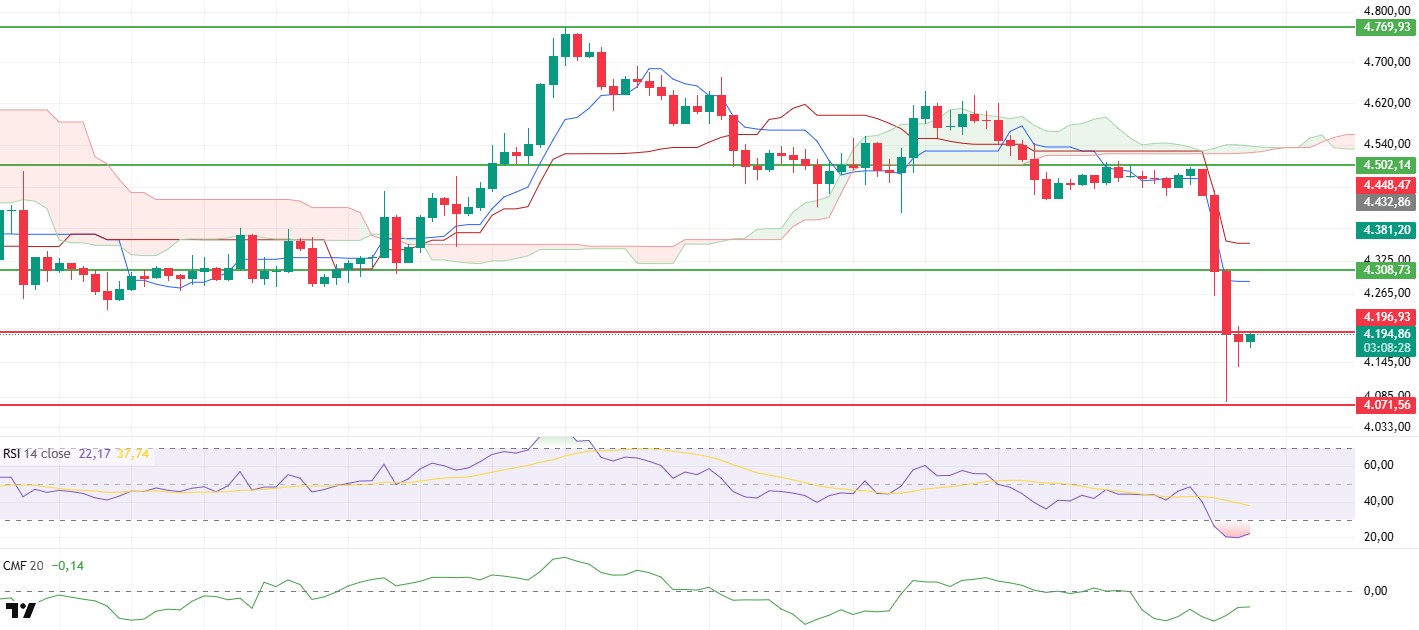
The Ethereum price showed that the $4,196 level was a critical threshold in terms of determining direction in the morning hours. Although attempts were made to break above this level throughout the day, they were unsuccessful, and the price traded sideways around $4,180. This outlook reveals that, despite buyers continuing their reactionary purchases, the market has been unable to gain sufficient momentum for a strong recovery. In particular, the continued persistence below $4,196 confirms that the market has yet to show clear signs of recovery.
Looking at the futures markets, the open interest remaining stable throughout the day indicates that investors are maintaining a cautious stance. Additionally, the funding rate continuing to stay in negative territory reveals the intensity of short positions and that the market is more susceptible to downward pressure. This scenario signals that investors are not yet willing to take risks and are waiting for critical levels that will determine the price direction to be tested.
There is a slight improvement in liquidity indicators. Although the Chaikin Money Flow (CMF) indicator remains in negative territory, its slight upward trend indicates that liquidity inflows have begun, albeit limited. This can be considered a positive signal for the market in the short term. However, if inflows do not strengthen, this picture may not have a lasting impact on prices. Therefore, whether this trend in the CMF continues or not may be decisive in the direction of price movements in the coming days.
Relative Strength Index (RSI) indicator continued its horizontal movement in the oversold zone throughout the day. This indicates that the market remains fragile and the risk of a decline has not completely disappeared. While the RSI’s horizontal movement in this zone may pave the way for a potential rebound, it also signals that selling pressure has not yet subsided.
As a result, the $4,196 level remains a critical threshold for the price direction in the evening hours. A potential rise above this level could pave the way for buyers to regain strength and for the price to move towards the $4,300 level. However, if the price continues to remain below $4,196, selling pressure may increase, and the possibility of Ethereum retreating towards the $4,000 level remains a strong scenario. Therefore, for investors, the $4,196 level will be the key reference point determining the market’s short-term direction in the coming hours.
Support levels: 4,196 – 4,071 – 3,940
Resistance levels: 4,308 – 4,502 – 4,769
XRP/USDT
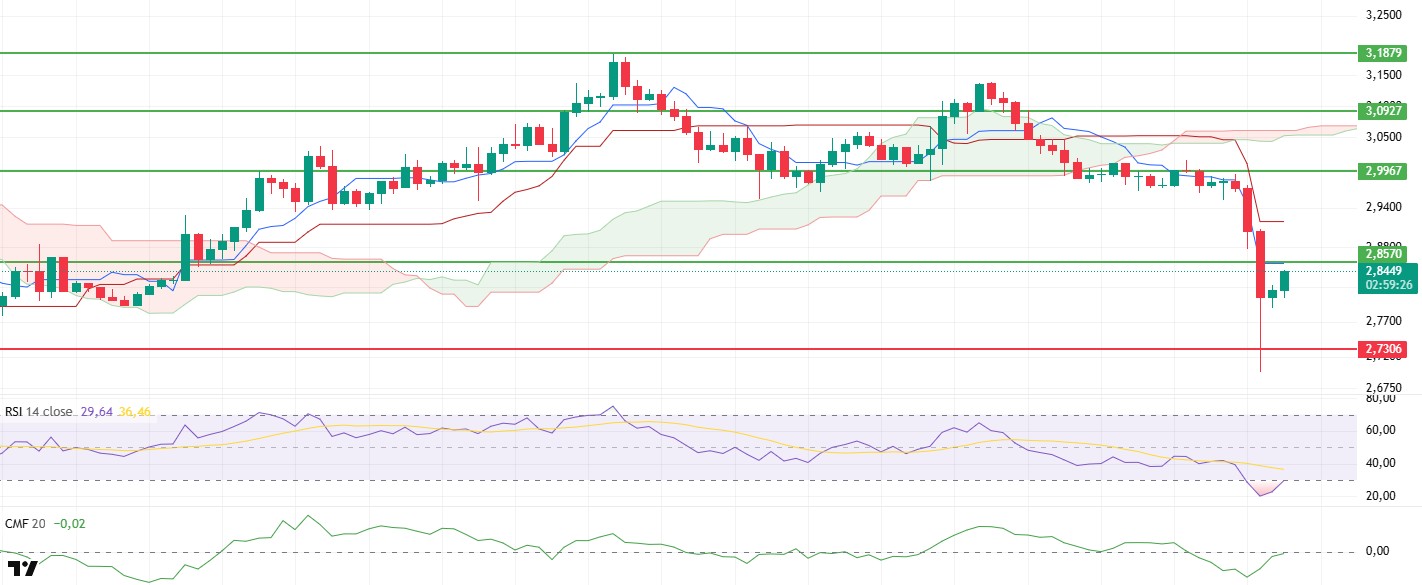
The XRP price rebounded from the $2.69 level in the morning hours, climbing to $2.82. During the day, it continued this upward trend, starting to move towards the important resistance point at the $2.85 level. This development indicates that buyers became more active in the market throughout the day, creating short-term recovery pressure on the price.
Technical indicators also support this recovery movement. Relative Strength Index (RSI) indicator continues to rise, reacting upward from the oversold zone. This indicates that the price movement is in a healthy trend and that the current recovery is paving the way for an upward movement. The Chaikin Money Flow (CMF) indicator’s rapid rise to the zero line also reinforces this picture. This movement, which indicates a renewed surge in liquidity inflows, signals that buying is increasingly coming into play and that the price is finding support.
As a result, the $2.857 level remains critically important for determining the direction in the evening hours. If sustainability is achieved above this level, buyers’ momentum could strengthen and the XRP price could rise to the $2.99 level. However, a potential rejection from the $2.857 level could lead to renewed selling pressure and cause the price to drop below $2.82, retreating towards the $2.70 region. Therefore, investors should closely monitor price action around the $2.857 level in the short term.
Support levels: 2.7306 – 2.6513 – 2.4730
Resistance levels: 2.8570 – 2.9967 – 3.0927

SOL/USDT
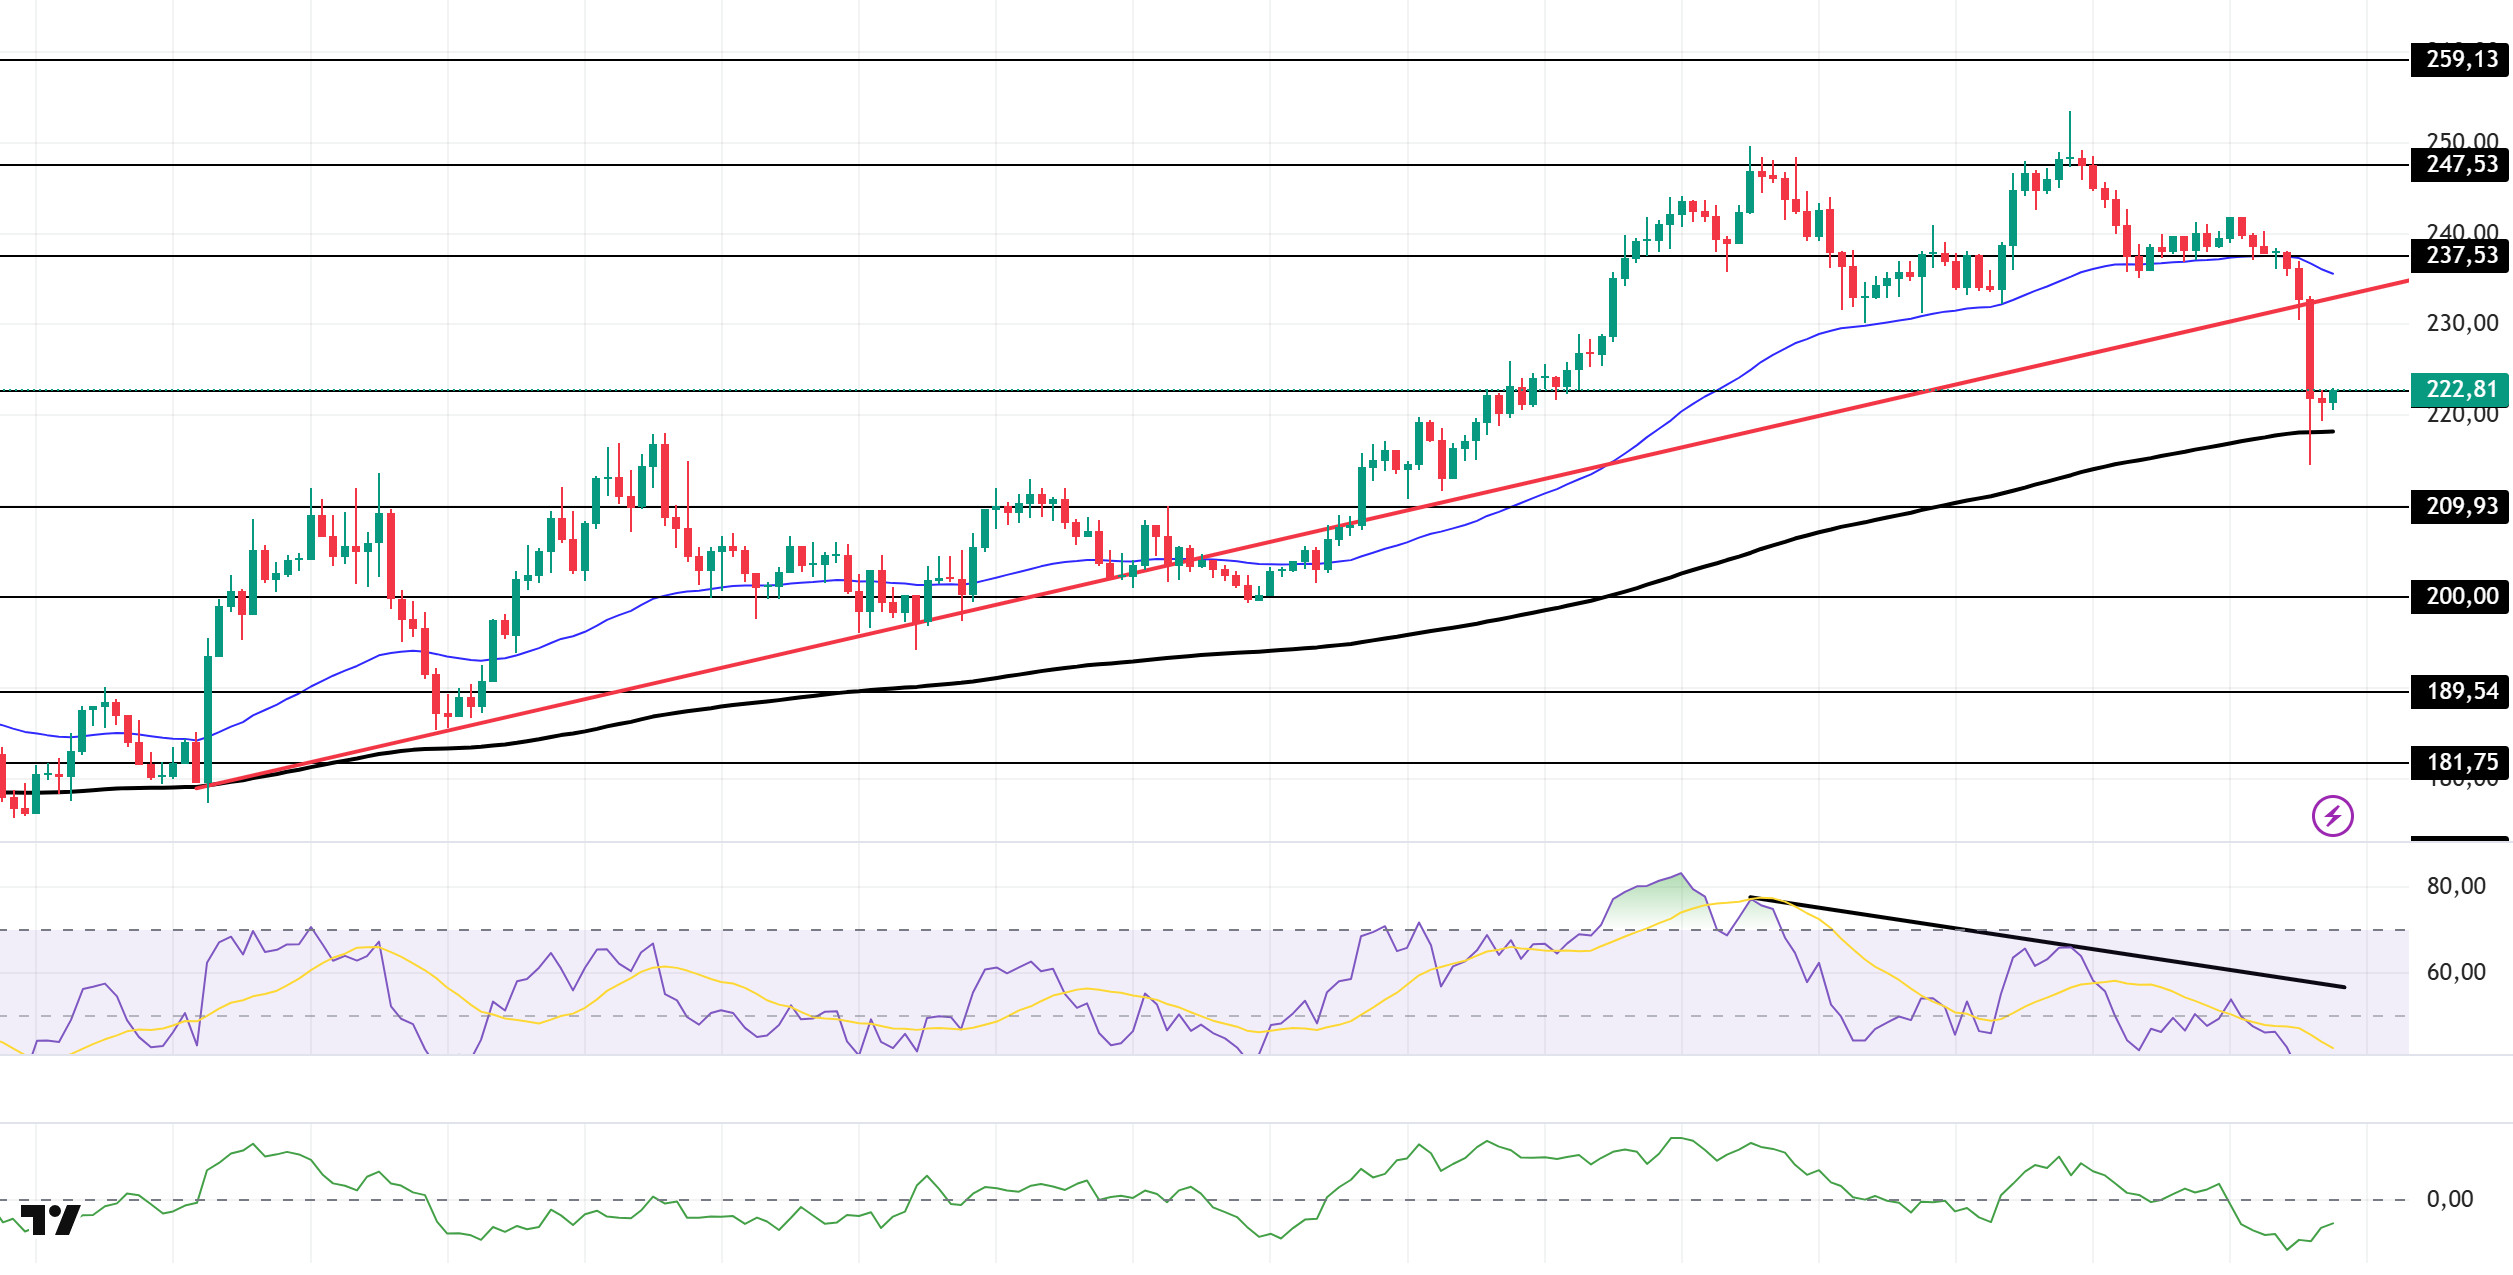
The SOL price traded sideways during the day. The asset deepened its decline by breaking below the strong support level of $237.53 and the 50 EMA (Exponential Moving Average – Blue Line) moving average. Breaking below the upward trend that began on August 22, the price is currently testing the 200 EMA (Black Line) moving average as support. It may test the $209.93 level as support with candle closes below this moving average. If the upward movement begins, it may test the $237.53 level as resistance.
On the 4-hour chart, it remained above the 50 EMA (Exponential Moving Average – Blue Line) and 200 EMA (Black Line). This indicates that the medium-term upward trend may continue. At the same time, the price being between the two moving averages shows us that the market is in a decision phase in the short term. The large difference between the two moving averages indicates that the asset’s sideways or downward trend may continue. Chaikin Money Flow (CMF-20) remained in negative territory. However, a decrease in cash inflows could push the CMF deeper into negative territory. The Relative Strength Index (RSI-14) remained in oversold territory. This may cause slight corrections. At the same time, it continued to remain below the downward trend that began on September 14, indicating that selling pressure continues. In the event of an upturn due to macroeconomic data or positive news related to the Solana ecosystem, the $237.53 level stands out as a strong resistance point. If this level is broken upwards, the uptrend is expected to continue. If pullbacks occur due to developments in the opposite direction or profit-taking, the $209.93 level could be tested. A decline to these support levels could increase buying momentum, presenting a potential upside opportunity.
Supports: 209.93 – 200.00 – 189.54
Resistances: 222.61 – 237.53 – 247.53
DOGE/USDT
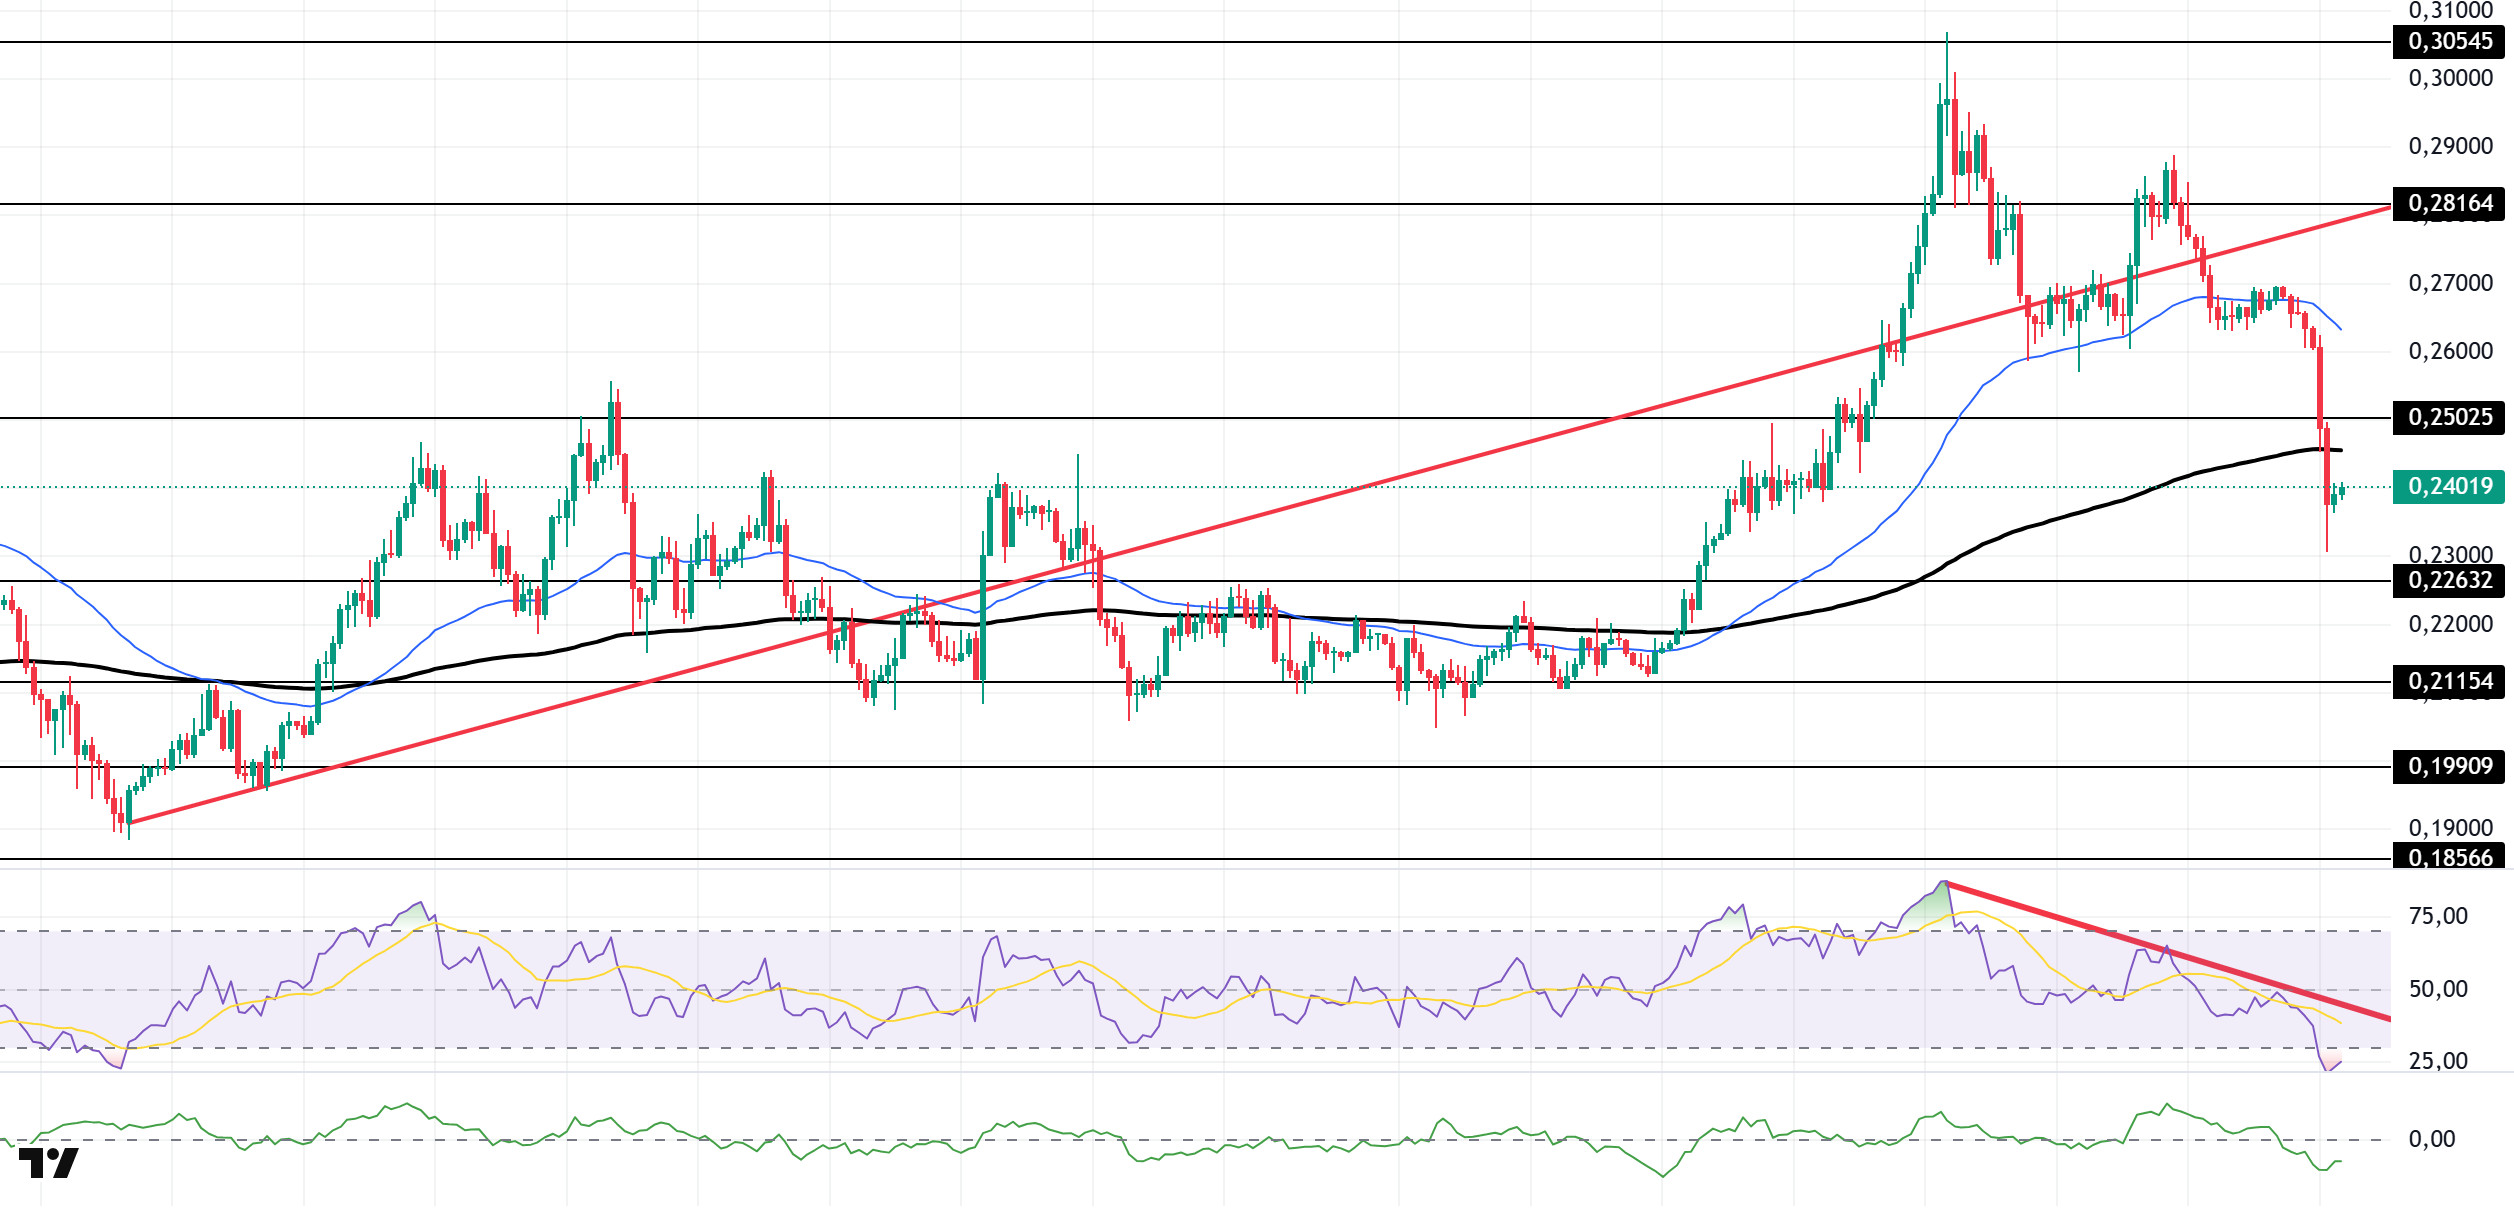
The DOGE price remained flat during the day. The asset tested the strong support level of $0.25025 and broke below it, moving into the lower region of the 200 EMA (Exponential Moving Average – Black Line). Currently remaining below the 200 EMA moving average, the price may test the $0.22632 level if the pullback continues. In the event of a potential rise, $0.25025 should be monitored as resistance.
On the 4-hour chart, the 50 EMA (Exponential Moving Average – Blue Line) remained above the 200 EMA (Black Line). This indicates that the medium-term upward trend continues. However, the price being below both moving averages indicates a short-term downward trend. The Chaikin Money Flow (CMF-20) remained in negative territory. Additionally, a decrease in money inflows could push the CMF deeper into negative territory. The Relative Strength Index (RSI-14) is in the oversold zone. This could trigger an upward correction. At the same time, it continued to be in the lower region of the downtrend that began on September 13, indicating that selling pressure continues. In the event of an upturn due to political developments, macroeconomic data, or positive news flow in the DOGE ecosystem, the $0.28164 level stands out as a strong resistance zone. Conversely, in the event of negative news flow, the $0.21154 level could be triggered. A decline to these levels could increase momentum and initiate a new wave of growth.
Supports: $0.22632 – $0.21154 – $0.19909
Resistances: 0.25025 – 0.28164 – 0.30545
TRX/USDT
As mentioned in this morning’s analysis, TRX managed to stay above the 0.3395 resistance level after a limited decline and is currently trading at 0.3407 with a buying reaction from the lower band of the bearish channel. Currently just below the middle band of the bearish channel, TRX is trading very close to the 0.3395 support level on the 4-hour chart. The Relative Strength Index (RSI) value of 42 indicates that it is in the sell zone. In addition, the Chaikin Money Flow (CMF) indicator continues to remain below zero at a value of -0.1, indicating a decrease in cash inflows. The CMF remaining in negative territory can be considered an indicator that the price may experience a decline.
In light of all these indicators, TRX may decline slightly in the second half of the day and move towards the lower band of the bearish channel. In such a scenario, it may test the 0.3395 support level. If it closes below this support level, it may continue to decline and subsequently attempt to break below the lower band of the channel, testing the 0.3300 support level. If it does not close below the 0.3395 support level, inflows may strengthen with the CMF moving into positive territory, and the price may move towards the upper band of the bearish channel, testing the 0.3465 resistance level.
On the 4-hour chart, 0.3230 is an important support level, and as long as it remains above this level, the upward momentum is expected to continue. If this support is broken, selling pressure may increase.
Supports: 0.3395 – 0.3300 – 0.3230
Resistances: 0.3465 – 0.3555 – 0.3615
Legal Notice
The investment information, comments, and recommendations contained herein do not constitute investment advice. Investment advisory services are provided individually by authorized institutions taking into account the risk and return preferences of individuals. The comments and recommendations contained herein are of a general nature. These recommendations may not be suitable for your financial situation and risk and return preferences. Therefore, making an investment decision based solely on the information contained herein may not produce results in line with your expectations.

