
Technical Analysis
BTC/USDT
The US and Australia took a significant step toward reducing their dependence on China by signing an $8.5 billion rare earths and critical minerals agreement. This development coincided with the resumption of US-China trade talks. Rare earths, fentanyl, and soybean trade were prominent topics in the talks, while Trump said that if no agreement was reached, a 155% tariff could be imposed on China.
As expectations grew in Washington that the government shutdown would end, the planned Russia-Ukraine peace talks in Budapest strengthened diplomatic hopes. In Japan, Sanae Takaiçi made history by becoming the country’s first female prime minister.
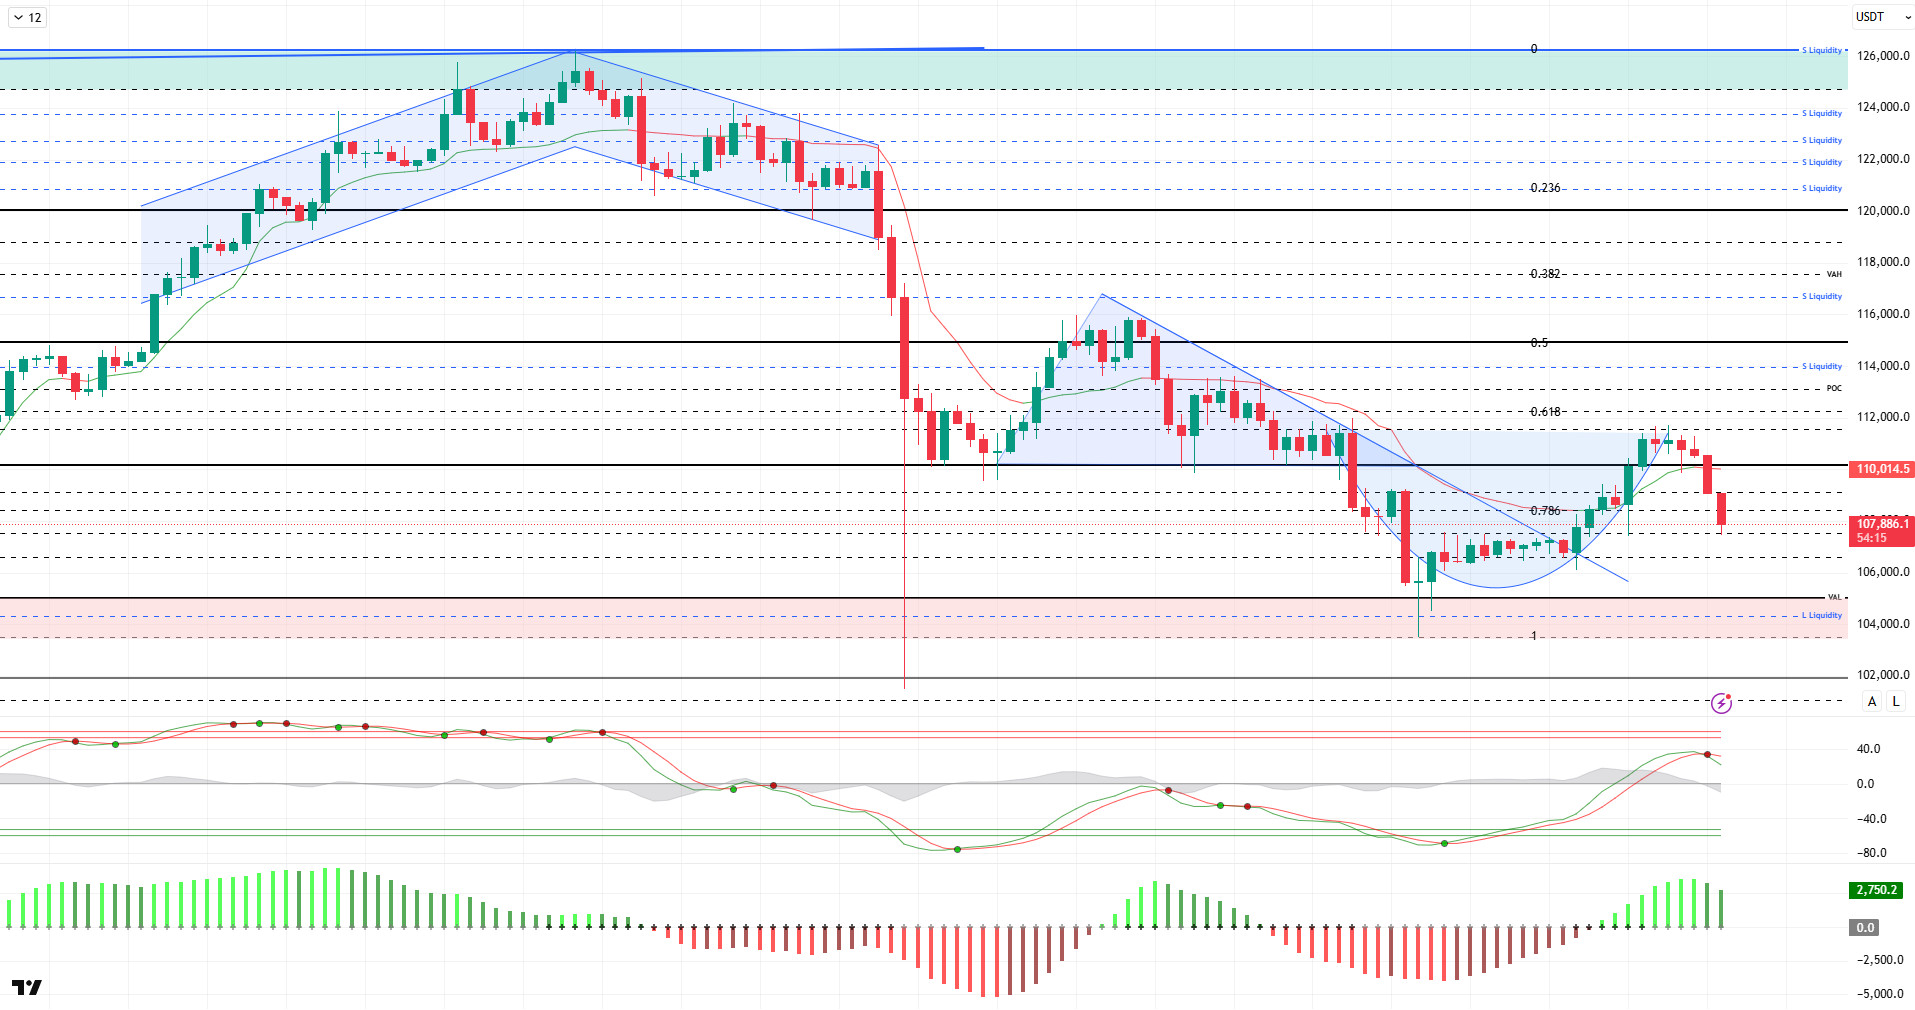
From a technical perspective, BTC, which reached the 111,500 level with its trend reversal at the bottom, failed to hold here and lost the 110,000 reference support level again. BTC, which is attempting to add a handle to the cup formation it has created, could test above the 110,000 level again if it completes the formation. At the time of writing, the price, which bounced off the 107,400 support level, continues to trade at the 108,000 level.
Technical indicators show that the Wave Trend (WT) oscillator crossed the middle band of the parallel channel, switching to a sell signal, in line with the buy signal it gave in the oversold zone. The Squeeze Momentum (SM) indicator failed to sustain the momentum it gained in the positive area. The Kaufman Moving Average (KAMA) is currently at $110,700, positioned above the price.
According to liquidation data, there has been an increase in the short-term buy level, with significant liquidations occurring at the $109,000 level, while the $106,000 – $106,600 range stands out as the liquidity zone. In a broader time frame, the buy level continues to maintain its intensity at the $104,300 level. In contrast, the sell level is concentrated at $112,300 in the short term, followed by the $113,700–$113,900 range, while in the long term, intensity continues above the $120,000 level. In the last 24 hours, 70m long positions and 18m short positions were liquidated in BTC. In the total market, $322m in liquidations occurred.
In summary, on the fundamental side, the renewed tariff tensions between the US and China, the continued US government shutdown, and the Russia-Ukraine crisis continue to weigh on prices, while statements from the Trump camp are setting the direction for the markets during this process. Technically, BTC lost the 110,000 reference and critical support zone, causing the price to fall to the 103,300 level. The price, which gathered demand from this level, once again exceeded the 110,000 level but failed to hold there and fell back to the 107,000 level. Liquidation data continues to stand out as test areas during this process. In the coming period, the 107,400 level will be a critical support for the price, and in case of a breakout, we will follow the 105,000 level as a reference area again. On the other hand, momentum gained above these levels could push the price back above the 110,000 level. In this context, liquidity areas will be monitored as expected test zones.
Support levels 107,400 – 106,600 – 105,000
Resistances 108,500 – 110,000 – 111,400
ETH/USDT
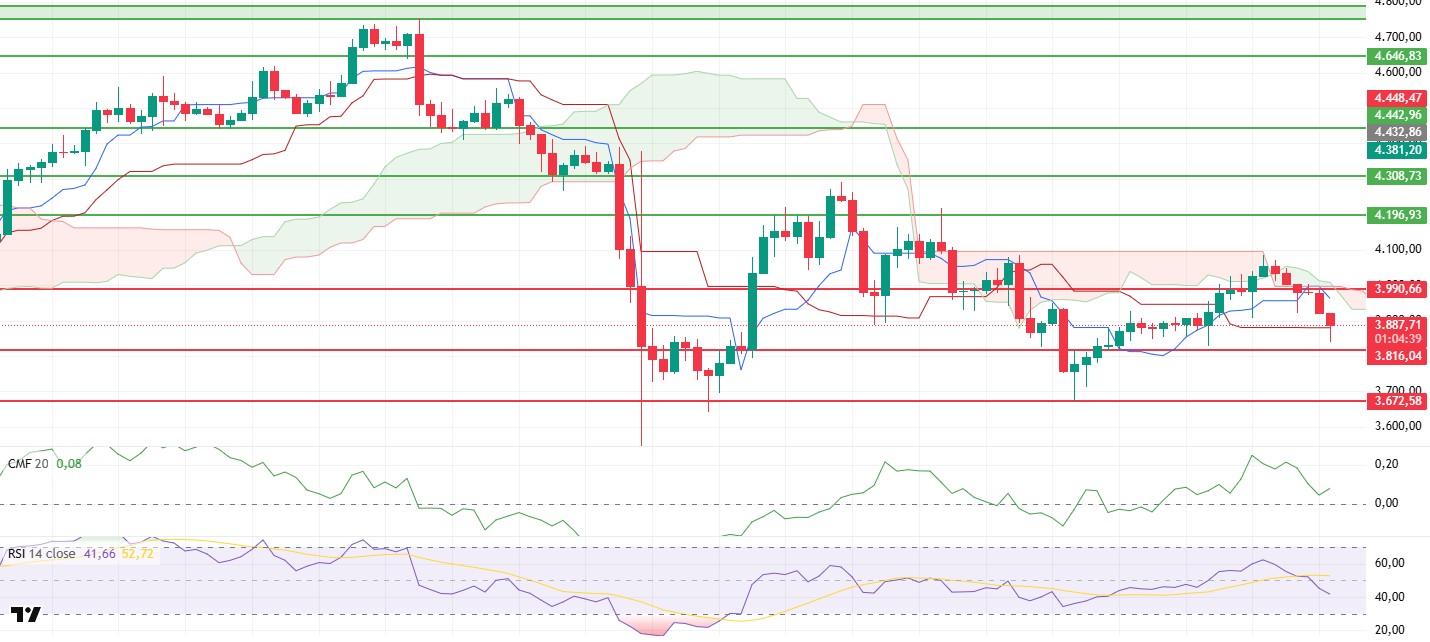
The ETH price lost its $3,990 support level yesterday evening, entering a sell-off and falling to $3,840. Buying from this area pushed the price back up to $3,890. However, the overall outlook indicates that the market remains weak in the short term.
Although the Chaikin Money Flow (CMF) indicator retreated slightly, it remained in positive territory, signaling continued liquidity inflows. This structure indicates that capital flows are still advancing in favor of the price, but that the previous momentum has weakened.
The Relative Strength Index (RSI) has fallen below both the 50 level and the underlying moving average, confirming the loss of momentum. This break in the RSI indicates that the influence of buyers is diminishing in the short term and that the price is more likely to move sideways or downward.
When examining the Ichimoku indicator, it is seen that the ETH price has fallen below the kumo cloud, re-entering a negative trend. As long as it remains below the cloud, pressure is expected to continue in the technical outlook.
In general, if the ETH price fails to regain the $3,990 level, selling pressure could intensify, potentially pushing the price down to the $3,817 level. A break below this level could accelerate the downward momentum. However, if the price manages to rise above the $3,990 level, buyers could regain strength, and positive momentum could continue.
Top of Form
Below the Form
Supports: 3,816 – 3,672 – 3,500
Resistances: 3,990 – 4,196 – 4,308
XRP/USDT
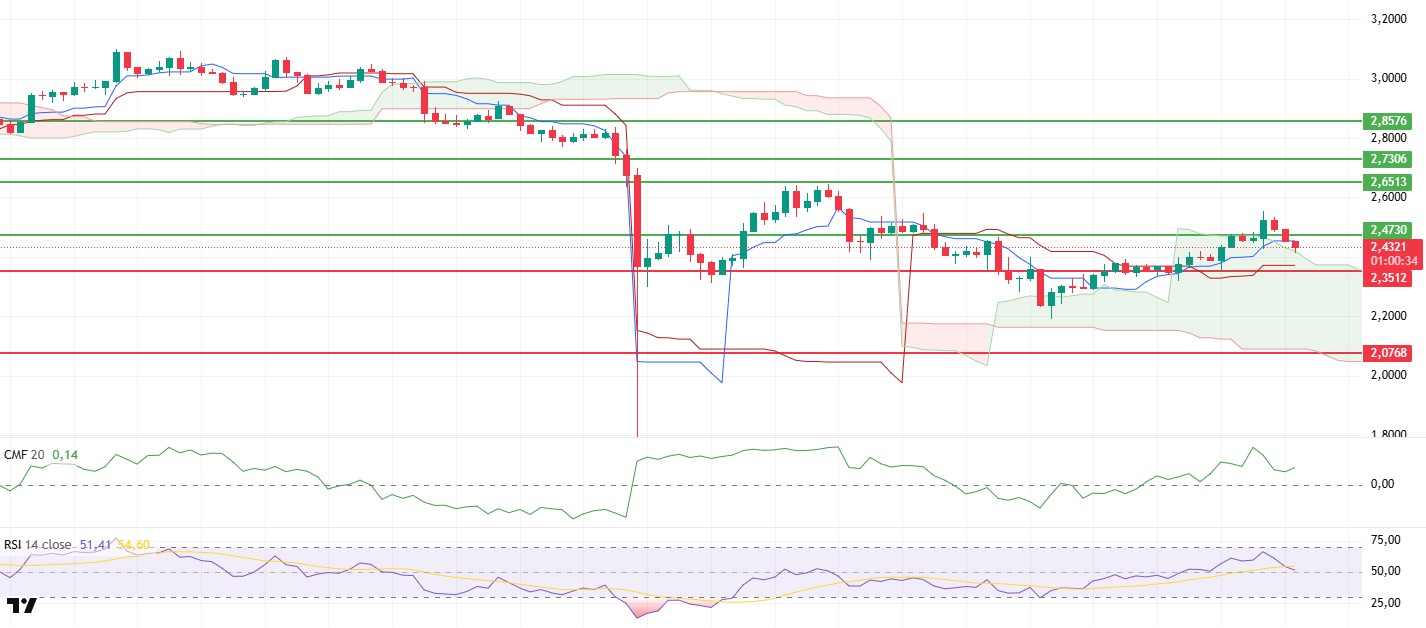
The XRP price rose above the $2.47 level yesterday evening, then experienced a slight pullback to the upper band of the cloud amid a general market weakening and is currently trading around $2.43. The price holding in this region indicates that short-term stabilization efforts are continuing.
The Chaikin Money Flow (CMF) indicator remains in positive territory, revealing that liquidity inflows are continuing and the market is still maintaining a buyer-driven structure.
The breakout of the Kumo cloud and the price remaining above both the Tenkan and Kijun levels indicate that the positive trend is continuing from a technical perspective. This structure signals that buyers maintain control of the market and that the upward movement has not yet ended.
The Relative Strength Index (RSI) indicator has retreated healthily to the 50 level. Nevertheless, it can be said that positive momentum persists and the price retains its potential to regain upward momentum.
Overall, the XRP market appears to be continuing its recovery trend. The CMF remaining in positive territory, the RSI making a healthy correction, and the price trading above the kumo cloud confirm that buyers are still in an advantageous position. If the $2.47 level is breached again, the $2.65 target could come back into focus, while remaining below this level could prolong the short-term sideways trend for a while longer.
Supports: 2.3512 – 2.2100 – 2.0768
Resistances: 2.4730 – 2.6513 – 2.7306
SOL/USDT
Gemini launched a credit card that offers Solana rewards with an automatic staking feature. Solana announced its new Chinese name, “Solala,” in a community contest.
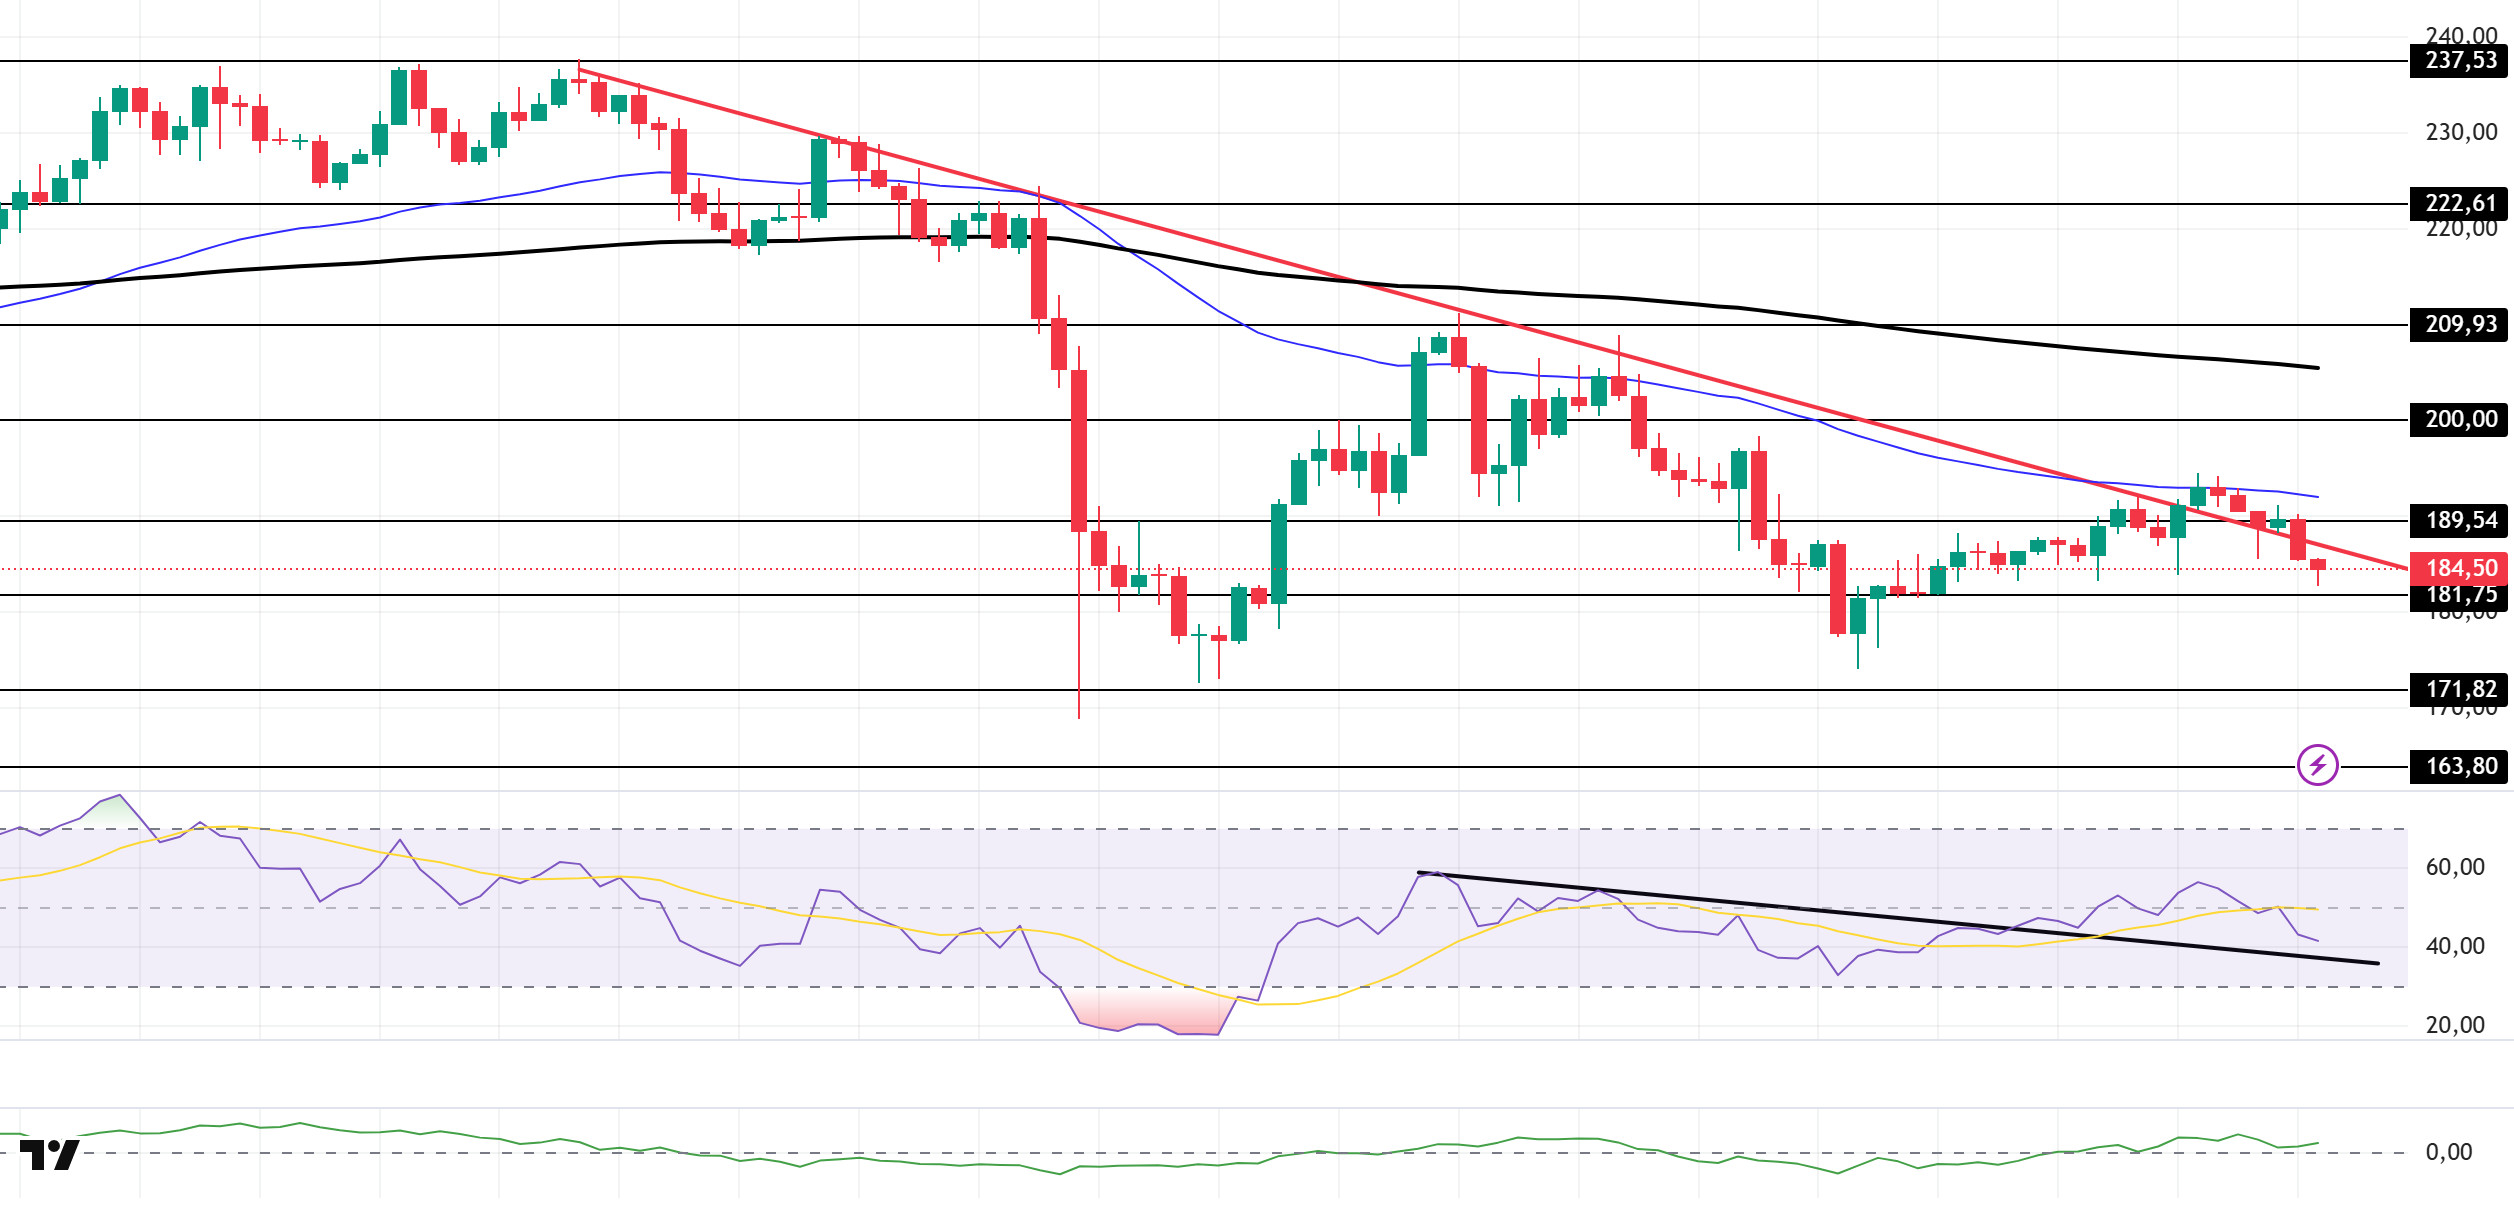
The price of SOL experienced a pullback. The asset failed to hold above the downward trend line that began on October 6, encountering resistance at the 50 EMA (Blue Line) moving average, and began to decline below the trend line again. Currently continuing its decline, the price could test the $171.82 level if it continues its pullback. If it experiences an uptrend, it could retest the 50 EMA (Blue Line) moving average as resistance.
On the 4-hour chart, it remained below the 50 EMA (Exponential Moving Average – Blue Line) and 200 EMA (Black Line). This indicates that it may be in a medium-term downtrend. At the same time, the price being below both moving averages shows us that the asset is in a short-term downtrend. The Chaikin Money Flow (CMF-20) remained in positive territory. However, the decline in money inflows could push the CMF into negative territory. The Relative Strength Index (RSI-14) continues to hold above the descending line that began on October 13. However, the metric, which has retreated to the mid-level of the negative zone, is currently testing the downward trend as support. If it breaks this level, the decline could deepen. In the event of an upturn due to macroeconomic data or positive news related to the Solana ecosystem, the $200.00 level stands out as a strong resistance point. If this level is broken upwards, the uptrend is expected to continue. If pullbacks occur due to developments in the opposite direction or profit-taking, the $171.82 level could be tested. A decline to these support levels could increase buying momentum, presenting a potential upside opportunity.
Supports: 181.75 – 171.82 – 163.80
Resistances: 189.54 – 200.00 – 209.93
DOGE/USDT
House of Doge, the corporate arm of the Dogecoin Foundation, announced on Monday that it is now the largest shareholder of the century-old Italian football club U.S. Triestina Calcio 1918, currently ranked last in Serie C.
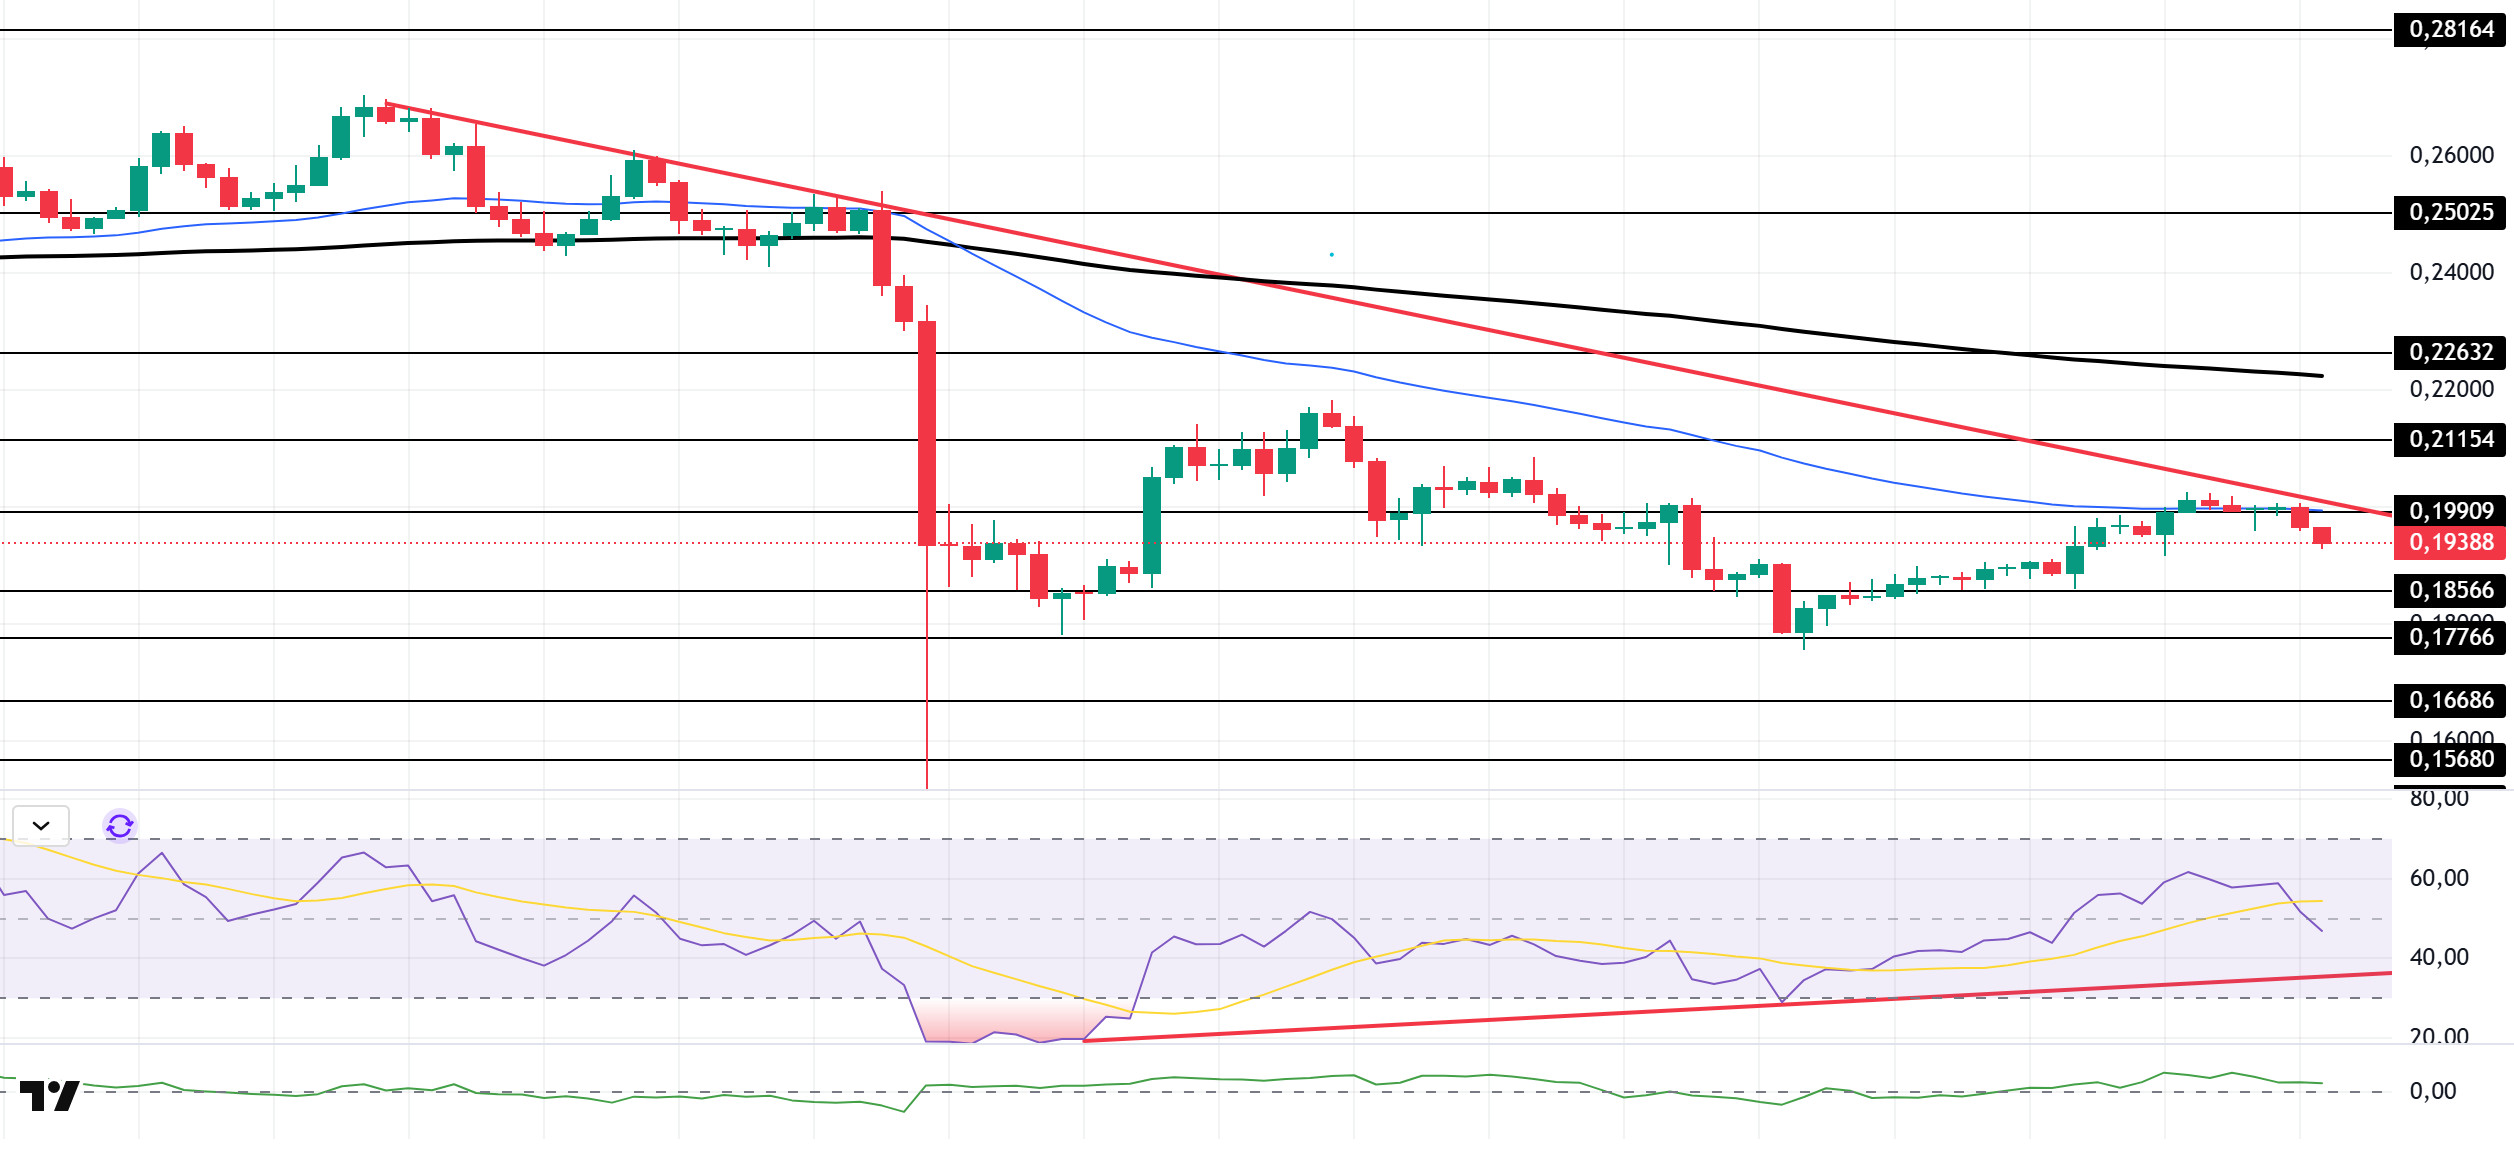
The DOGE price experienced a decline. The asset continues to trade in the lower region of the downtrend that began on October 6. Testing the 50 EMA (Blue Line) moving average, a strong resistance level, and the downtrend as resistance, the price failed to break through and experienced a pullback, deepening its decline. If the pullback continues, the $0.18566 level could trigger as a strong support zone. In the event of candle closes above the 50 EMA and the upper boundary of the descending trend line, the 200 EMA (Black Line) moving average should be monitored.
On the 4-hour chart, the 50 EMA (Exponential Moving Average – Blue Line) remained below the 200 EMA (Black Line). This indicates that a downtrend may begin in the medium term. The price being below both moving averages indicates that the price is trending downward in the short term. Chaikin Money Flow (CMF-20) continues to hold its positive position. Additionally, a decrease in money inflows could push CMF into negative territory. The Relative Strength Index (RSI-14) continues to remain above the upward trend that began on October 12. However, a retreat into negative territory could create selling pressure. In the event of potential increases driven by political developments, macroeconomic data, or positive news flow within the DOGE ecosystem, the $0.22632 level stands out as a strong resistance zone. Conversely, in the event of negative news flow, the $0.16686 level could be triggered. A decline to these levels could increase momentum and initiate a new wave of growth.
Supports: $0.18566 – $0.17766 – $0.16686
Resistances: 0.19909 – 0.21154 – 0.22632
AVAX/USDT
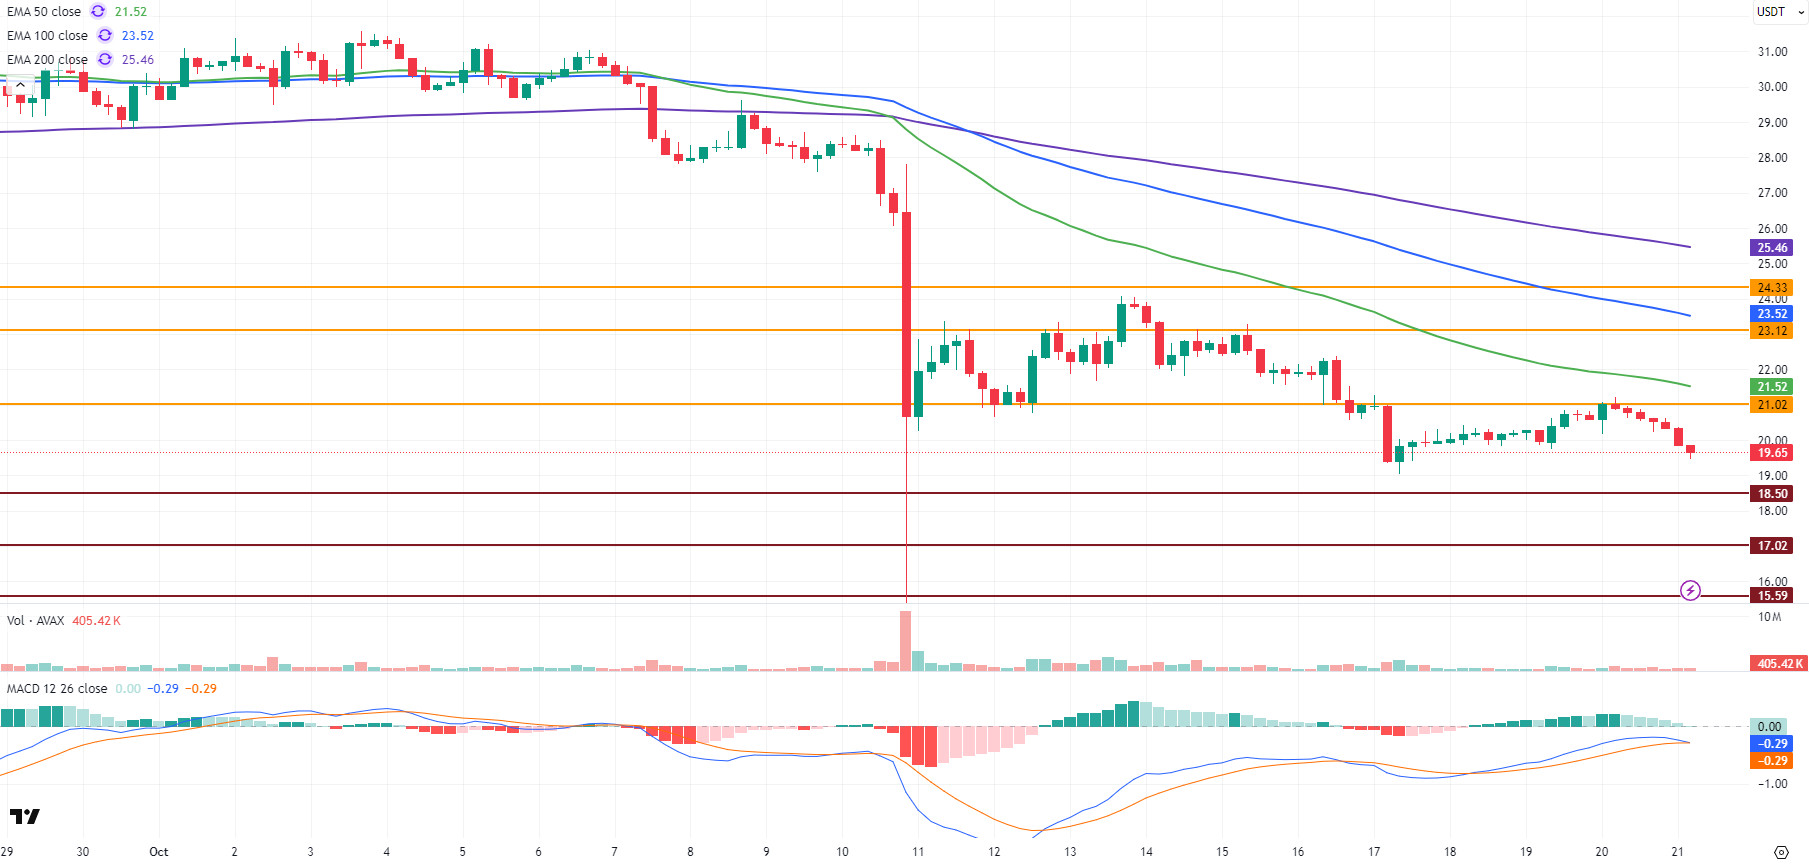
AVAX, which started the day at $20.59 yesterday, remained under selling pressure throughout the day and closed at $20.34, losing approximately 1.2% in value. The negative market sentiment that emerged following the collapse in the cryptocurrency market in previous weeks continues. The low-volume trading environment and weak investor appetite are increasing downward pressure on price movements. On the other hand, within the Avalanche ecosystem, the total amount of locked assets in decentralized finance (DeFi) applications on the network reached 94.37 million AVAX, hitting its highest level in the last 3 years. While this strong data indicates that confidence in the ecosystem is increasing in the long term, there has not yet been a positive reflection on the price side in the short term.
On the 4-hour chart, AVAX continues its downward trend, with the Moving Average Convergence/Divergence (MACD) line about to cross the signal line. If the MACD line crosses the signal line downward, this could cause momentum to weaken further and deepen the decline. Currently, AVAX is trading below all critical Exponential Moving Average (EMA) levels. This outlook indicates that the negative trend is technically continuing and that selling pressure remains strong.
From a technical perspective, the $21.02 level is the first significant resistance level for AVAX’s upward movements. As long as this level is not breached, the short-term recovery may remain limited. If AVAX manages to stay above this resistance level, it could test the $23.12 and $24.33 resistance levels in succession. In downward movements, the $18.50 level stands out as the first support zone. If there are closes below this level, selling pressure may increase, and AVAX could retreat to the $17.02 and then $15.59 support levels. In the overall outlook, both the MACD and EMA indicators continue to produce negative signals. Momentum is weak, and the trend is downward. If the $21 resistance level is not broken, selling pressure is expected to persist. However, an increase in trading volume and a revival of short-term buying interest could lead to closes above $21, which could mark the beginning of a gradual recovery for AVAX.
(EMA50: Green Line, EMA100: Blue Line, EMA200: Purple Line)
Supports 18.50 – 17.02 – 15.59
Resistances 21.02 – 23.12 – 24.33
LINK/USDT
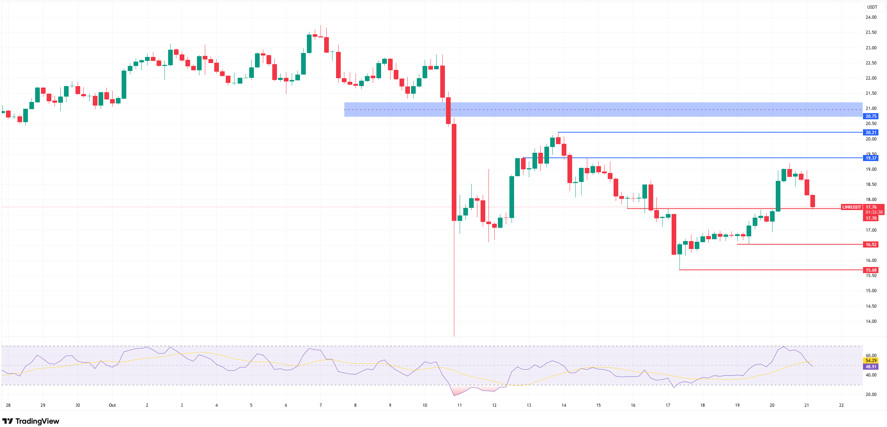
Link fell to our support level of $17.70 along with the selling pressure at the $19 level we mentioned in our previous day’s analysis. This area is currently quite critical because it is very important for the price not to close below this level in order for yesterday’s upward movement to remain merely a “correction.” If it manages to stay above $17.70, today’s decline could be considered a correction and could trigger a new upward movement. In such a scenario, the price has the potential to rise first back to the $19 level and then to the blue shaded area of $20.75–21.00. Since this region has historically been a resistance point where strong selling pressure emerged, the possibility of upward movements being limited here should also be considered.
In the event of downward movements, the opposite scenario to the bullish one mentioned above could unfold. If the price breaks below the $17.70 support level, expectations of a new “downtrend” could come to the fore. In this case, the price is more likely to retreat first to the $16.00 level and then to the $15.00 level.
The Relative Strength Index (RSI) indicator is currently at 49 levels and is slowly signaling a shift into negative territory. If the price closes below $17.70 on an hourly or 4-hour candle, it could significantly increase the risk of selling. Therefore, we can say that closely monitoring both the $17.70 support level and the 50 level on the RSI is critical for risk management.
If the price manages to stay above the current level (17.70), it could support upward pricing in the short term and pave the way for the uptrend to regain strength. However, any closes below $17.70 could deepen selling pressure in the short term and cause the downtrend to accelerate.
Supports: 17.70 – 16.52 – 15.68
Resistances: 19.37 – 20.21 – 20.75
Legal Notice
The investment information, comments, and recommendations contained herein do not constitute investment advice. Investment advisory services are provided individually by authorized institutions taking into account the risk and return preferences of individuals. The comments and recommendations contained herein are of a general nature. These recommendations may not be suitable for your financial situation and risk and return preferences. Therefore, making an investment decision based solely on the information contained herein may not produce results in line with your expectations.

