
Technical Analysis
BTC/USDT
The White House Digital Asset Advisory Council announced that it expects the comprehensive Crypto Market Structure Act to be completed by the end of the year. The Smarter Web Company increased its reserves by purchasing 55 BTC, while Capital B purchased 10 BTC. The CEO of JPMorgan announced stablecoin plans while commenting on inflation and interest rate cuts. According to Deribit data, $23 billion worth of BTC and ETH options will expire on Friday. Meanwhile, Donald Trump will speak at the UN Leaders Summit today.
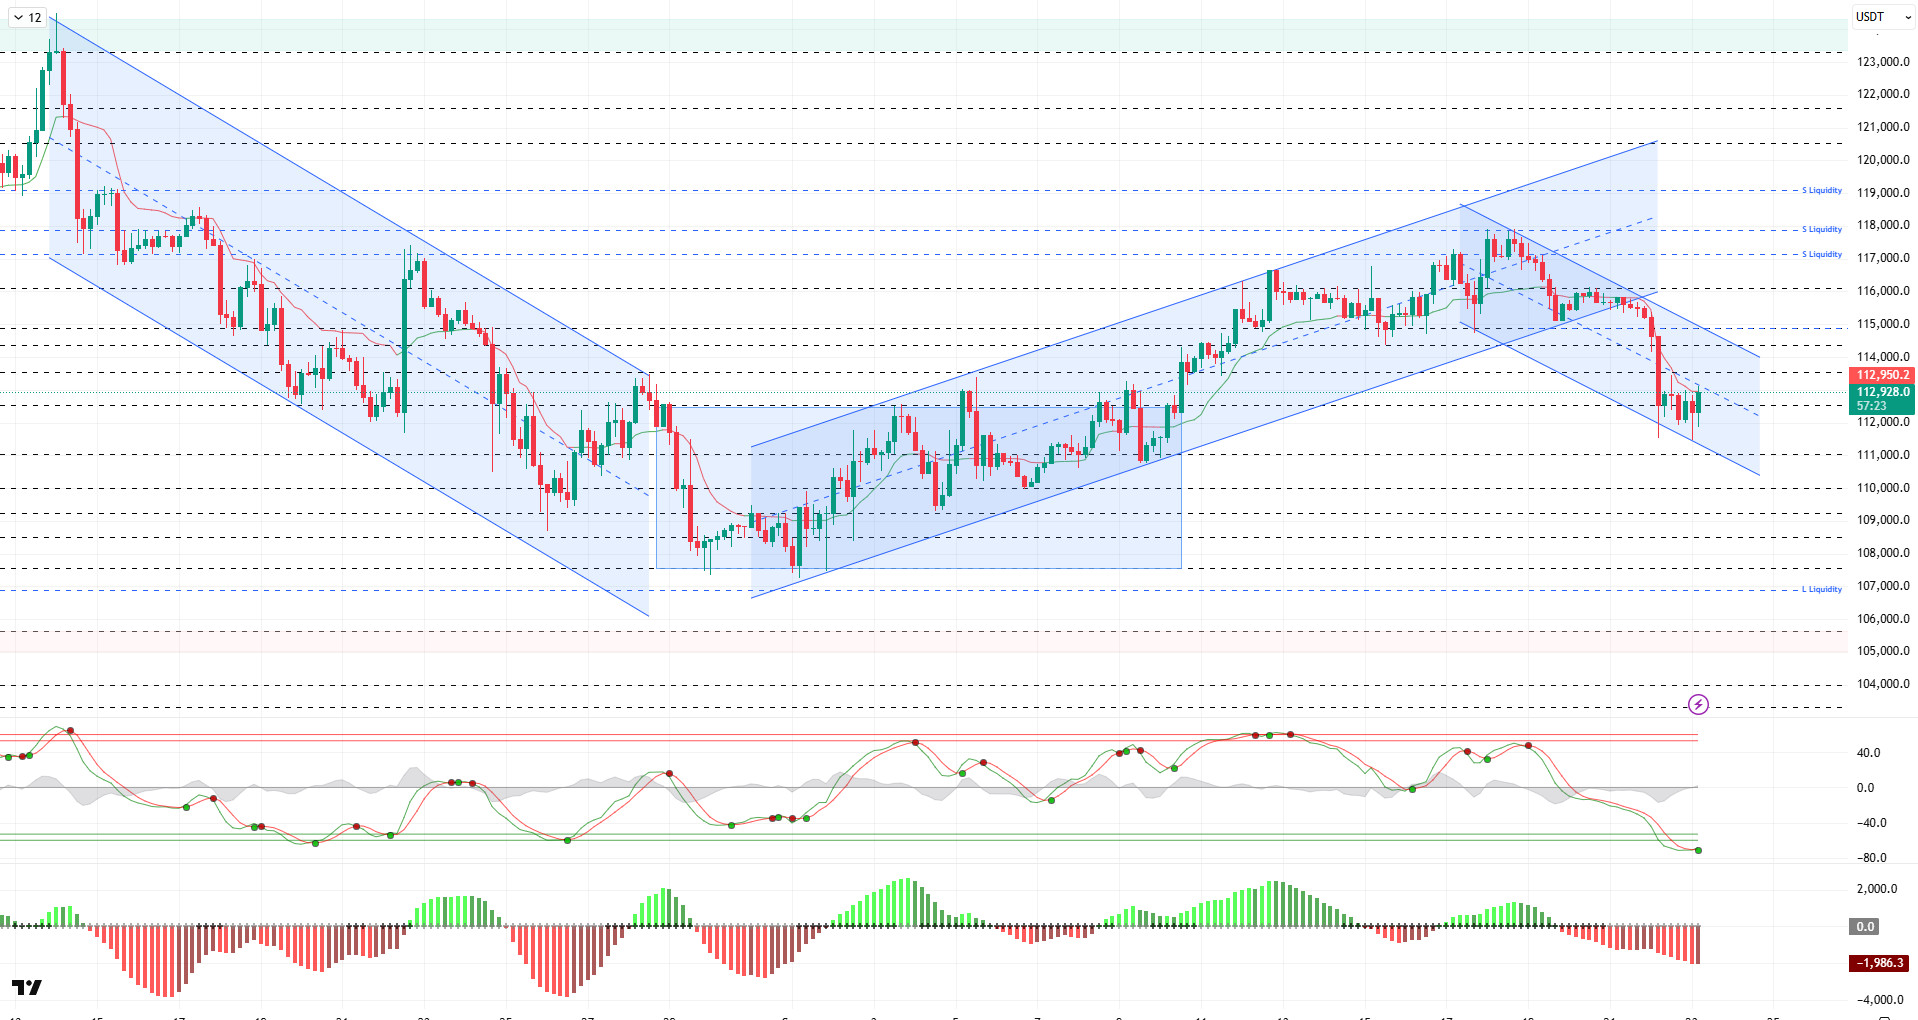
Looking at the technical picture, BTC, which lost its upward trend structure, fell back to the 111,400 level. In the previous analysis, the price, which was trying to recover, struggled but failed to break through the 113,000 level and tested the 111,400 level again. Then, regaining momentum, the price reached the 113,000 level within the downward trend structure.
Technical indicators show the Wave Trend oscillator (WT) giving a buy signal in the oversold zone, preparing for a trend reversal, while the Squeeze Momentum (SM) indicator’s histogram is gaining momentum in negative territory. The Kaufman moving average is currently trading below the price at the 112,900 level.
Looking at liquidation data, short-term trades attempted to accumulate around the 111,500 band but were liquidated by yesterday’s spike movement. In a broader context, the scarcity of short-term buy-side trades is noteworthy. The selling level shows slight density in the 113,500 – 114,000 band, while the long term has recorded significant density in the 117,800 – 119,000 region.
In summary, while there is no clear fundamental catalyst for recent sales, the decline in futures-driven selling pressure appears to be deepening the downturn. Although the overall positive picture in the market is being maintained, developments later in the day will be decisive in terms of a trend reversal. On the technical side, the break below the 115,000 level has broken the upward channel. However, a re-cross above this level could eliminate the downward structure, and if the price gains momentum, the upward movement could continue. In terms of liquidity data, the recent decline has cleared the buying levels, while a significant increase in selling levels stands out. In this context, for the price to recover, it may first need to regain the 114,000 level, followed by closes above 115,000. However, if selling pressure persists and the 112,600 level is broken, the next important support level to watch will be 111,400.
Supports: 112,600 – 111,400 – 110,000
Resistances , 114,000 – 115,000 – 116,100
ETH/USDT
The ETH price struggled to break above the $4,196 level yesterday evening and, unable to remain above the resistance zone, fell back to $4,115 amid selling pressure. This pullback revealed that the market is still facing strong sellers at critical levels. However, the price rebounded in the morning with buying interest at $4,115 and rose above $4,200. Thus, it appears that buyers have re-entered the market in the short term and signs of recovery are gaining strength.
Looking at liquidity flow, it is noteworthy that the Chaikin Money Flow (CMF) indicator continues to trend upward despite remaining in negative territory. This outlook signals that money entering the market is intensifying and that buyers are beginning to gain weight. The CMF maintaining its upward trend supports the current recovery while also pointing to the potential for buyers to increase their activity in the market in the short term.
On the momentum side, the Relative Strength Index (RSI) indicator’s exit from the oversold zone stands out as a technically significant development. The recovery in the RSI indicates that the market is beginning to shake off its weak appearance and that upward momentum is regaining strength.
The most critical level during the day remains $4.196. If the price stays above this level, it could pave the way for buyers to strengthen their control of the market and for the price to gradually rise towards the $4.308 resistance level. In this scenario, increased liquidity inflows and stronger momentum could provide a more solid foundation for the uptrend. On the other hand, closing below $4,196 could lead to renewed selling pressure in the market and cause the price to retreat first to $4,115 and then to the $4,000 level.
Support levels: 4,196 – 4,071 – 3,940
Resistance levels: 4,308 – 4,502 – 4,769

XRP/USDT
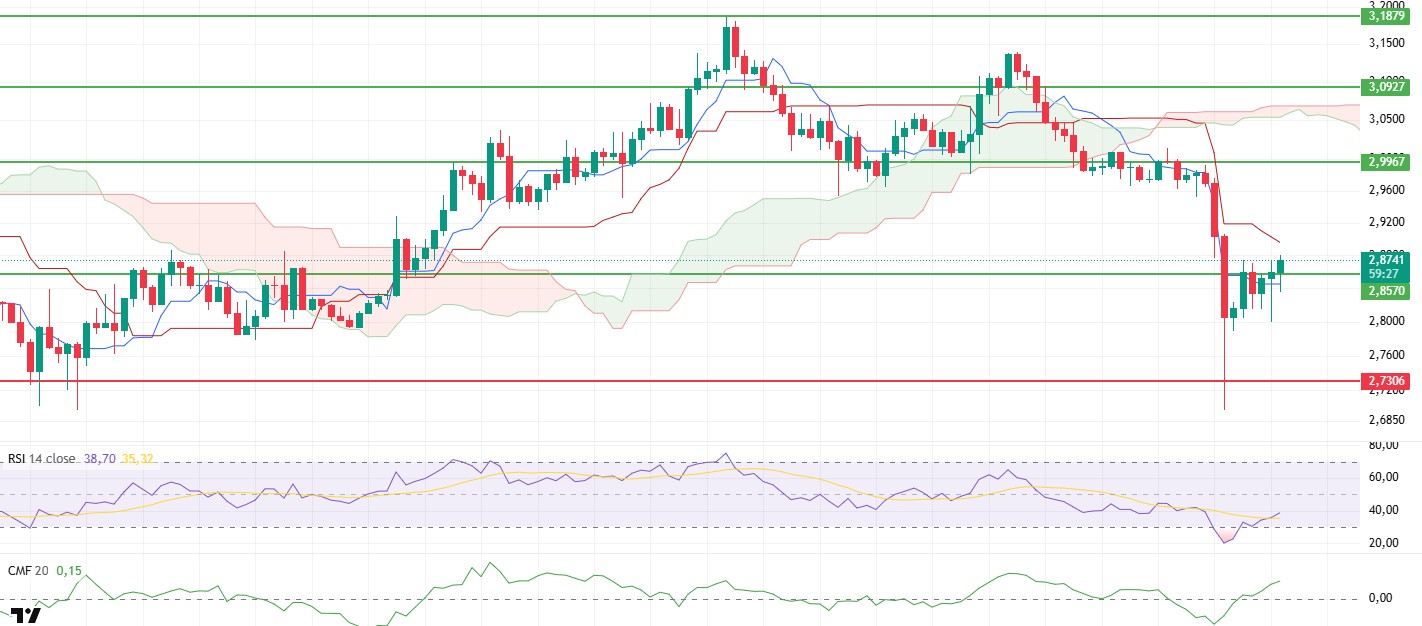
XRP continued to trade below the $2.99 level throughout the weekend and retreated to $2.69 amid general market selling pressure. Following this weak performance yesterday evening, strong buying pressure emerged in the morning hours, pushing the price back above the $2.85 level. This clearly signaled that buyers were beginning to regain control of the market in the short term.
When examining technical indicators, the sharp rebound in the Chaikin Money Flow (CMF) indicator is particularly noteworthy. Following the weakness seen in the negative zone, the CMF’s return to positive territory indicates that liquidity inflows into the market have accelerated and buyer appetite has strengthened significantly. This development stands out as one of the most important factors supporting the price’s ability to hold above critical levels.
On the momentum side, the Relative Strength Index (RSI) indicator breaking out of the oversold zone and continuing its upward trend is producing a positive signal for the short-term outlook. This reversal in the RSI signals that upward momentum in price movements may continue and strengthens the market recovery scenario.
The Ichimoku indicator also supports this picture. The price regaining the Tenkan level confirms short-term upward momentum. Although the Kijun and cloud zone remain insurmountable obstacles, the Tenkan level holding steady shows that buyers are determined to push the price higher.
When assessing the overall outlook, positive signals in the indicators suggest that upward momentum may continue throughout the day. If the price remains above the $2.85 level, it could advance to $2.92 and then to $2.99. However, if the price closes below $2.85, the strong momentum may weaken and the price may retreat back towards the $2.73 level.
Support levels: 2.8570 – 2.7306 – 2.6513
Resistance levels: 2.9967 – 3.0927 – 3.1879
SOL/USDT
Helius Medical Technologies, Inc. purchased over 760,190 Solana tokens at $231 each, using $335 million in cash for its digital asset arbitrage strategy. Fragmetric will launch the first Solana DAT for the South Korean market. ‘BITWISE SOLANA ETF SHS’ was added to the DTCC website with the BSOL ticker.
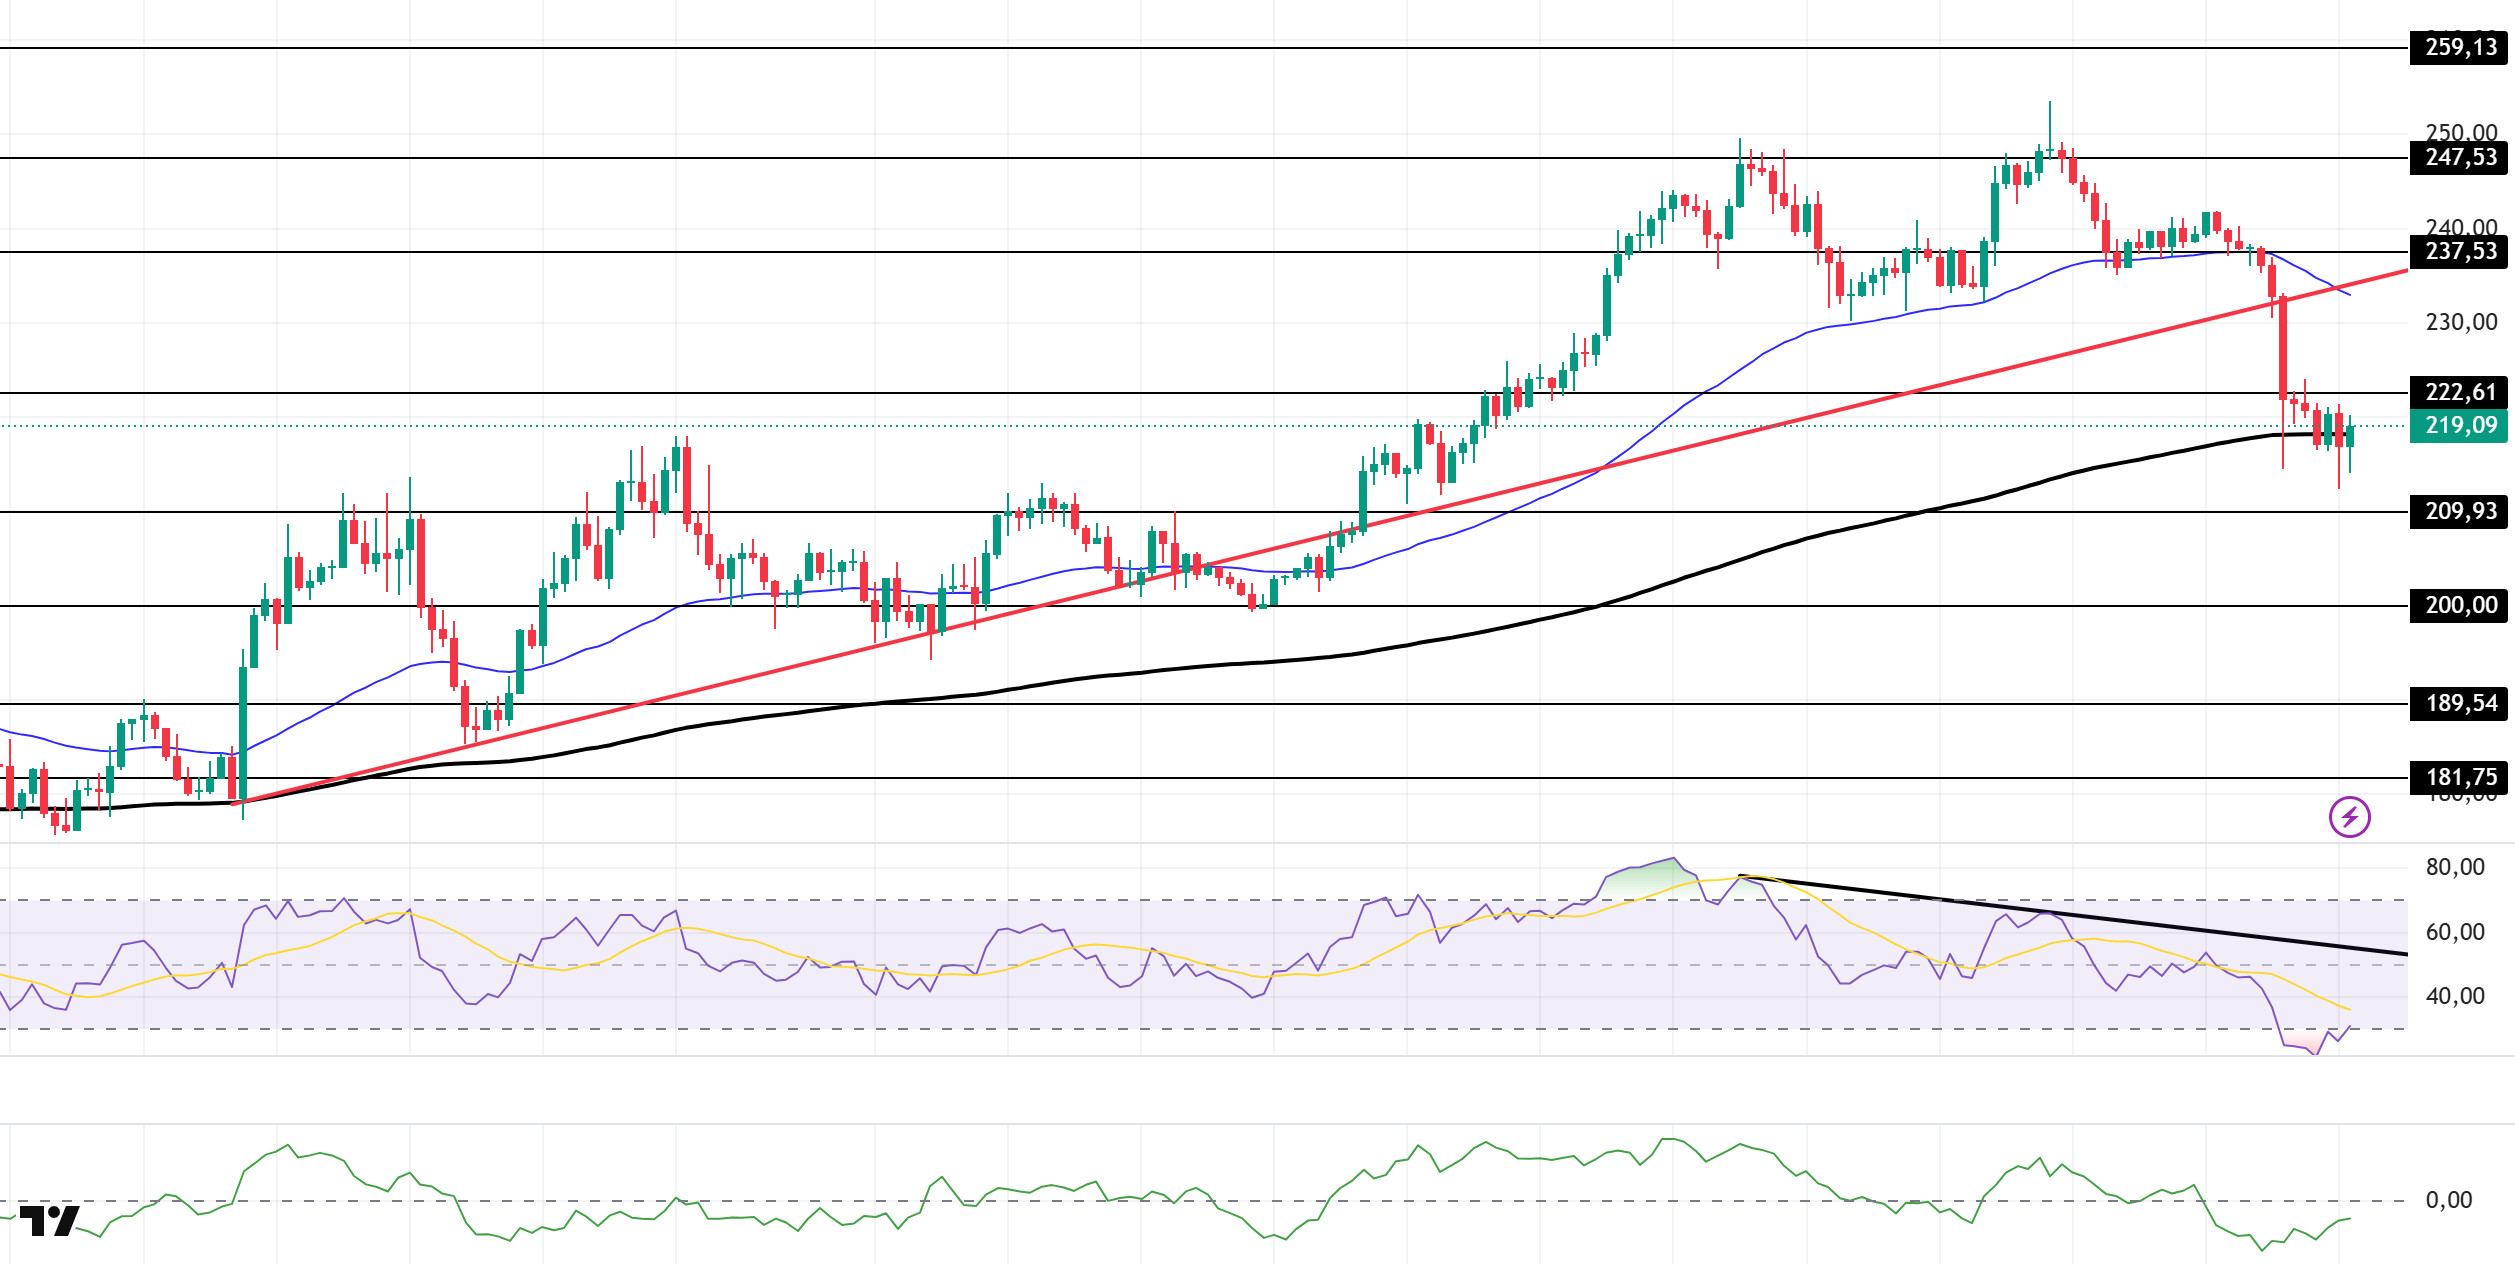
The SOL price showed a slight decline. The asset deepened its decline by breaking below the strong support level of $237.53 and the 50 EMA (Exponential Moving Average – Blue Line) moving average. Breaking below the upward trend that began on August 22, the price is currently testing the 200 EMA (Black Line) moving average as resistance. With candle closes above this moving average, it could test the $222.61 level as support. If the pullback continues, it could test the $209.93 level as resistance.
On the 4-hour chart, it remained above the 50 EMA (Exponential Moving Average – Blue Line) and 200 EMA (Black Line). This indicates that the upward trend may continue in the medium term. At the same time, the price being below both moving averages shows us that the market is in a downward trend in the short term. The Chaikin Money Flow (CMF-20) remained in negative territory. However, a decrease in money inflows could push the CMF deeper into negative territory. The Relative Strength Index (RSI-14) remained in oversold territory. This could cause slight corrections. At the same time, it continued to remain below the downward trend that began on September 14, indicating that selling pressure continues. In the event of an upturn due to macroeconomic data or positive news related to the Solana ecosystem, the $237.53 level stands out as a strong resistance point. If this level is broken upwards, the uptrend is expected to continue. If there are pullbacks due to developments in the opposite direction or profit-taking, the $200.00 level could be tested. A decline to these support levels could increase buying momentum, presenting a potential upside opportunity.
Support levels: 209.93 – 200.00 – 189.54
Resistances 222.61 – 237.53 – 247.53
DOGE/USDT
’21SHARES DOGECOIN ETF SH BEN INT’ was added to the DTCC site with the ticker TDOG.
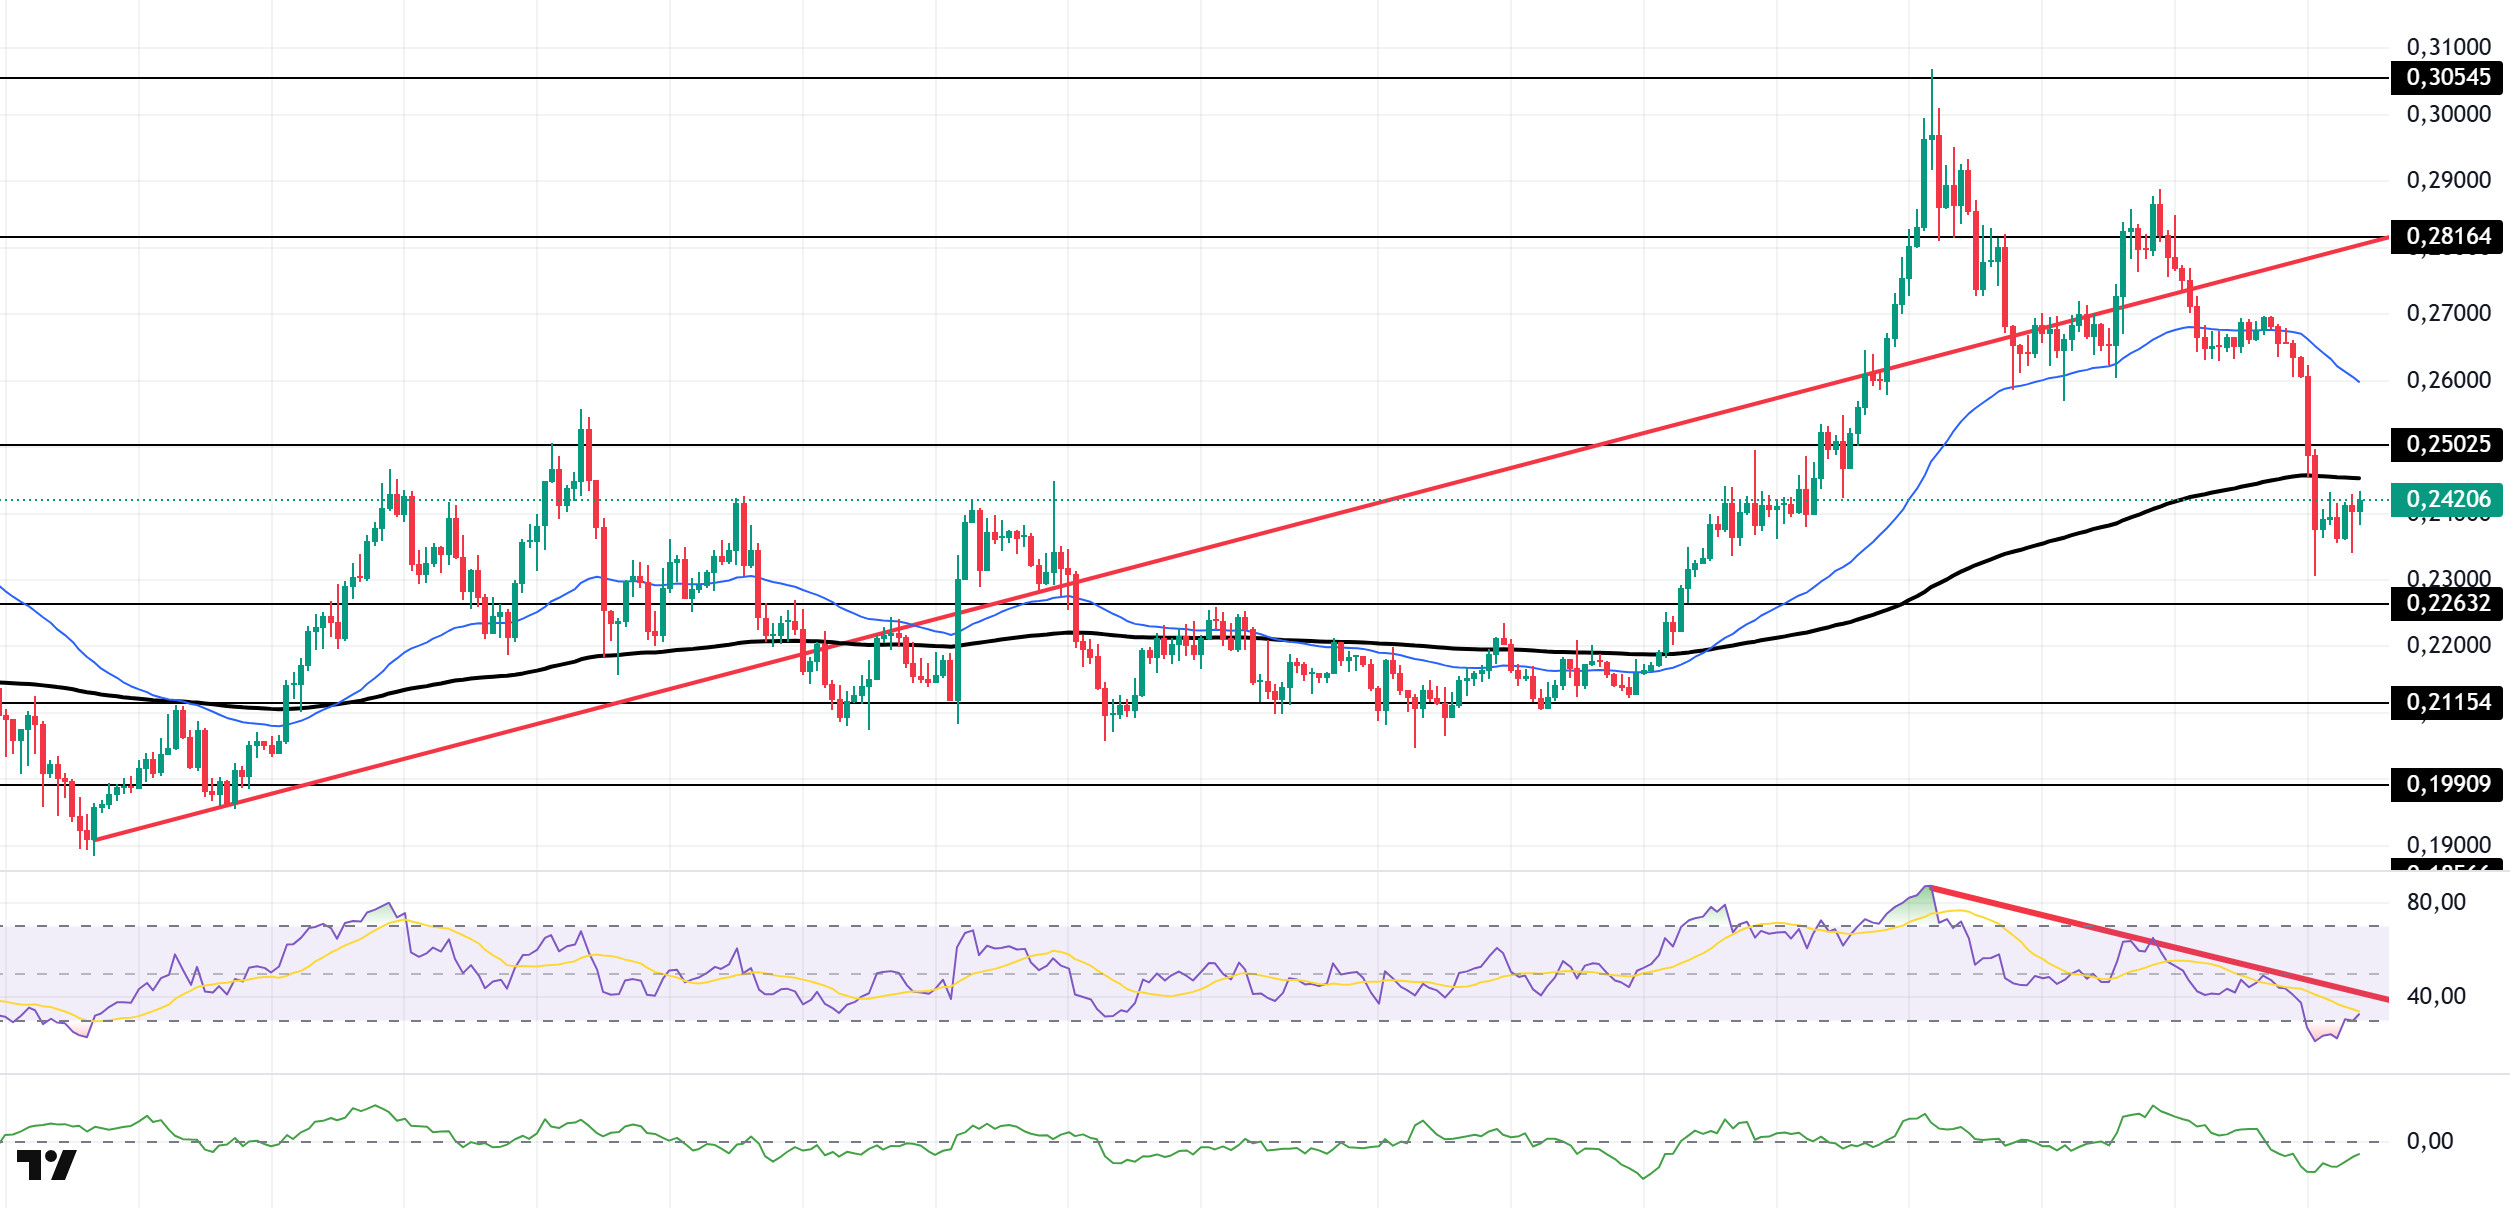
The DOGE price traded sideways. The asset tested the strong support level of $0.25025 and broke below it, moving into the lower region of the 200 EMA (Exponential Moving Average – Black Line). Currently remaining below the 200 EMA moving average, the price could test the $0.22632 level if the pullback continues. In the event of a potential rise, $0.25025 should be monitored as resistance.
On the 4-hour chart, the 50 EMA (Exponential Moving Average – Blue Line) remained above the 200 EMA (Black Line). This indicates that the medium-term upward trend continues. However, the price being below both moving averages indicates a short-term downward trend. The Chaikin Money Flow (CMF-20) remained in negative territory. Additionally, a decrease in money inflows could push the CMF deeper into negative territory. The Relative Strength Index (RSI-14) is in the oversold zone. This could trigger an upward correction. At the same time, it continued to be in the lower region of the downtrend that began on September 13, indicating that selling pressure continues. In the event of an upturn due to political developments, macroeconomic data, or positive news flow in the DOGE ecosystem, the $0.28164 level stands out as a strong resistance zone. Conversely, in the event of negative news flow, the $0.21154 level could be triggered. A decline to these levels could increase momentum and initiate a new wave of growth.
Supports: $0.22632 – $0.21154 – $0.19909
Resistances: 0.25025 – 0.28164 – 0.30545
TRX/USDT
As of September 22, 2025, the total amount of TRX staked is 44,587,372,919, representing 47.10% of the circulating supply. Compared to the previous day, there has been an increase of approximately 0.01% in the amount staked. Meanwhile, the market value of TRX has reached $32.2 billion.
Furthermore, a total of 4,142,567 TRX was burned yesterday, permanently removing 226,855 TRX from the circulating supply. This contributes to reducing inflationary pressure on the Tron network.
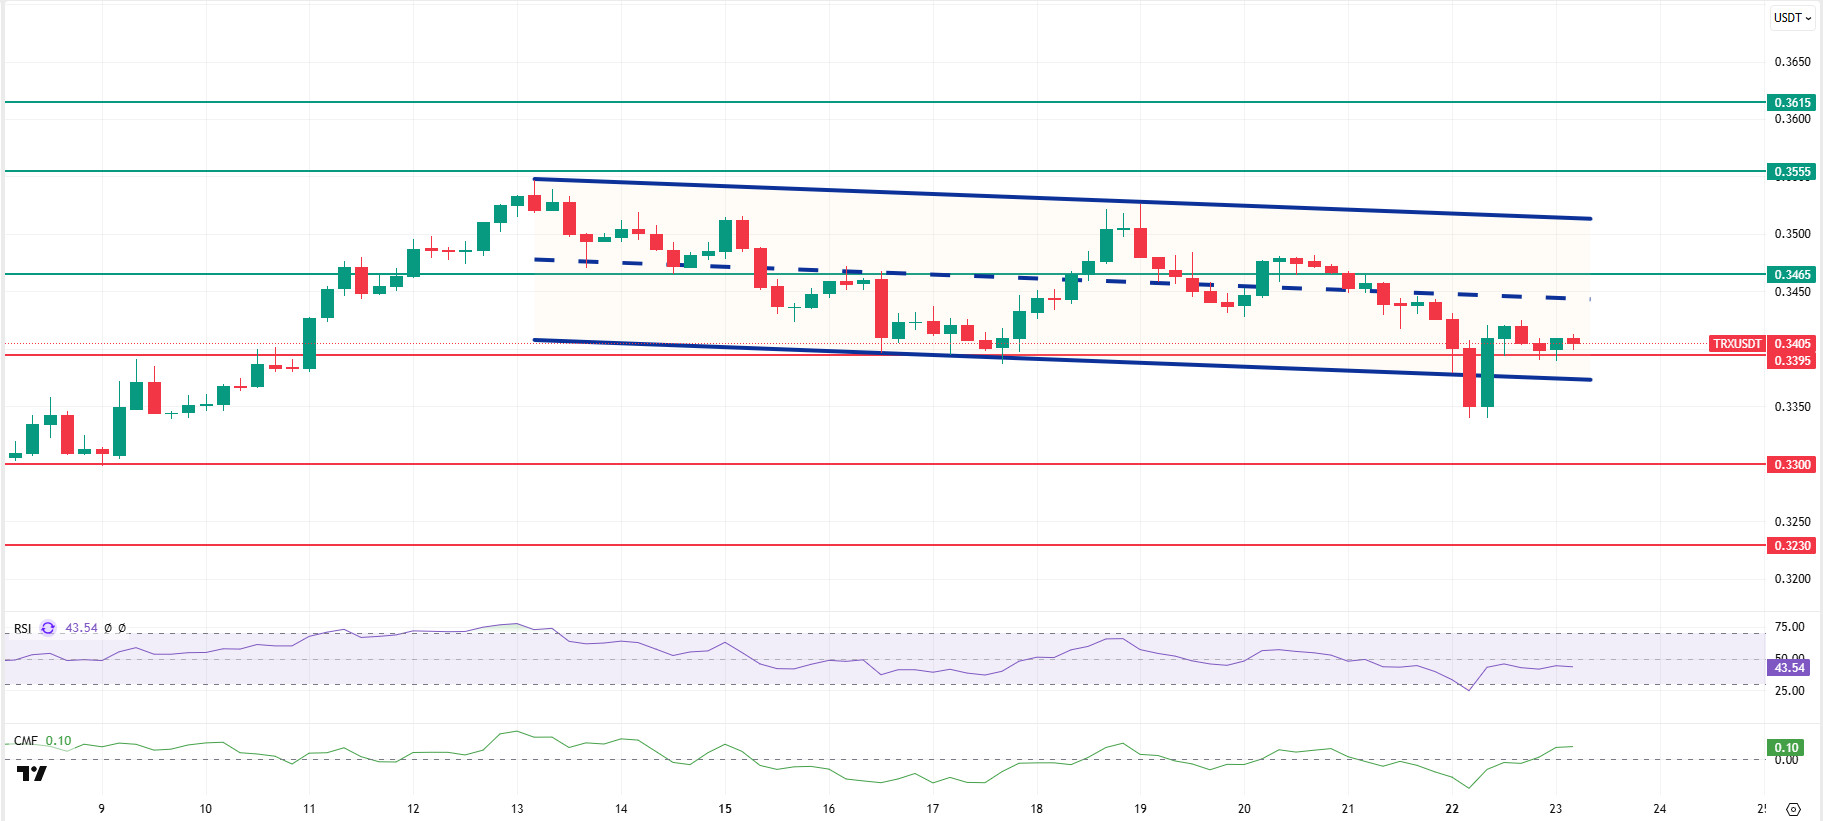
Technically speaking, TRX closed yesterday at $0.3399 after the decline, showed a slight increase in the morning hours, and is currently trading at $0.3405. Currently in the lower band of the bearish channel, TRX is priced just above the $0.3395 support level on the 4-hour chart. The Relative Strength Index (RSI) value is 43, indicating a sell zone. In addition, the Chaikin Money Flow (CMF) indicator is above zero at 0.10, indicating increased cash inflows. This suggests that buyer pressure in the market is increasing and that buying activity could gain short-term momentum.
In light of all these indicators, TRX may rise slightly in the first half of the day, testing the 0.3465 resistance level based on its current zone and RSI value. A candle close above this resistance could extend the uptrend, potentially breaking the bearish channel upward to test the 0.3555 resistance level. If it fails to close above the 0.3465 resistance level and the CMF indicator moves into negative territory, it may decline slightly due to potential selling pressure and test the 0.3395 and 0.3300 support levels in sequence.
On the 4-hour chart, 0.3230 is an important support level, and as long as it remains above this level, the upward momentum is expected to continue. If this support is broken, selling pressure may increase.
Supports: 0.3395 – 0.3300 – 0.3230
Resistances: 0.3465 – 0.3555 – 0.3615
Legal Notice
The investment information, comments, and recommendations contained herein do not constitute investment advice. Investment advisory services are provided individually by authorized institutions taking into account the risk and return preferences of individuals. The comments and recommendations contained herein are of a general nature. These recommendations may not be suitable for your financial situation and risk and return preferences. Therefore, making an investment decision based solely on the information contained herein may not produce results in line with your expectations.

