
Technical Analysis
BTC/USDT
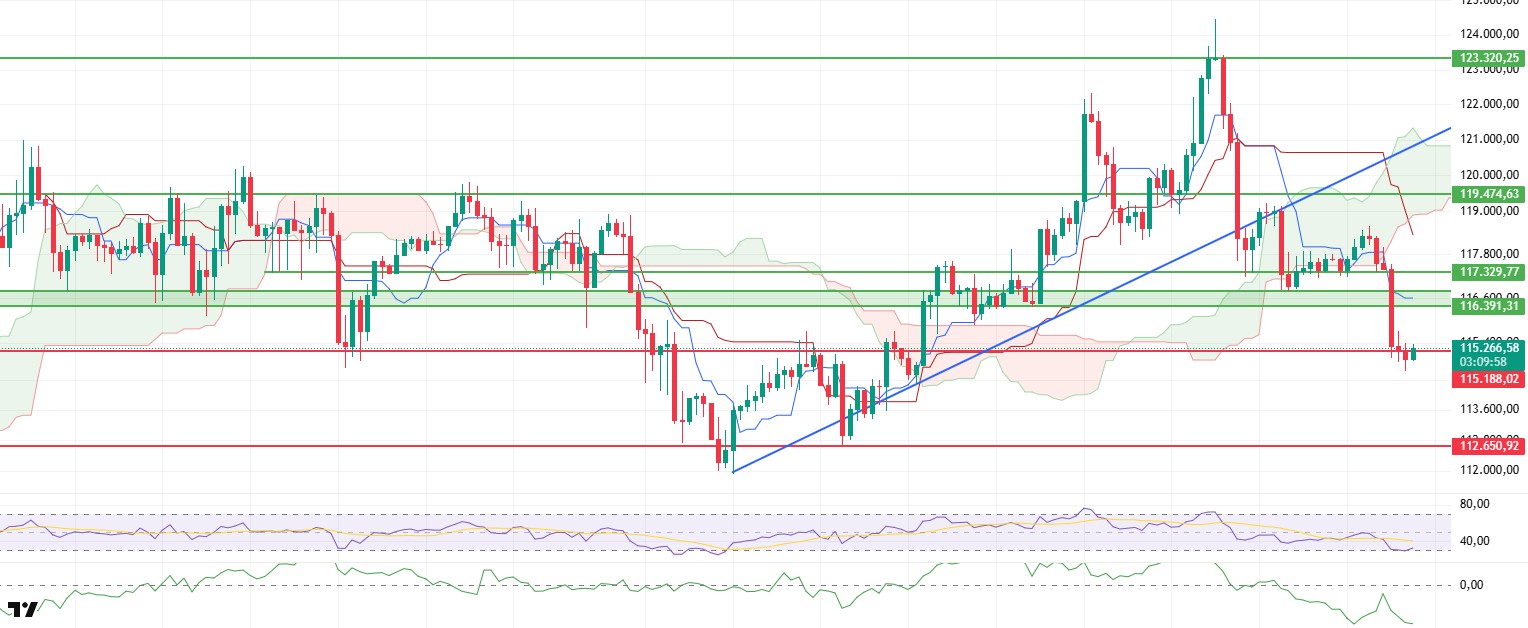
The Bitcoin price fell below the 115,000-dollar level during the day, indicating a short-term breakout, but it has since recovered to the 115,188-dollar level following a limited rebound from this area. However, this recovery remains structurally weak and fails to eliminate the negative signals regarding the market’s overall trend.
When on-chain data is examined, it becomes clear that the recovery is not based on healthy buyer demand. In particular, the Cumulative Volume Delta (CVD) data shows that this upward movement is primarily driven by the futures market, with no strong liquidity inflow or sustained buying appetite on the spot side. The slight increase observed in the funding rate further confirms this picture. The rising cost of long positions suggests that the short-term reaction is primarily driven by the futures market, leaving price movements vulnerable to further fluctuations.
The Chaikin Money Flow (CMF) indicator continues to remain in negative territory and maintain its downward movement. This confirms that funds are continuing to flow out of the market and that strong buyers have not yet entered the market. This outlook weakens the sustainability of any upward movements that occur without spot volume support.
The Ichimoku indicator also supports this chart. The price is still moving below the kumo cloud, and the sharp downward shift of the kijun level confirms that the market has begun to adopt a downward trend. The technical structure only allows for short-term rebound rallies, but strongly indicates that the medium-term trend is downward.
Looking at momentum indicators, the Relative Strength Index (RSI) is showing only a weak response despite being close to the oversold zone. This limited upward movement indicates that buyers are reluctant to push prices higher and that the market has not yet reached a strong recovery capacity. This weakness in momentum points to selling pressure not easing.
When all these technical and on-chain data are evaluated together, if the price fails to maintain its position above the area marked with a green box on the chart in the evening hours, a downward trend is expected to accelerate and deepen. In this case, the market may test downward liquidity gaps again. However, if the price manages to stay above the mentioned region and daily closes occur above this level, it could partially neutralize the current negative outlook and pave the way for the price to move back toward the $117.329 level.
Support levels: 115,188 – 112,650 – 110,936
Resistance levels: 117,329 – 119,474 – 123,320
ETH/USDT
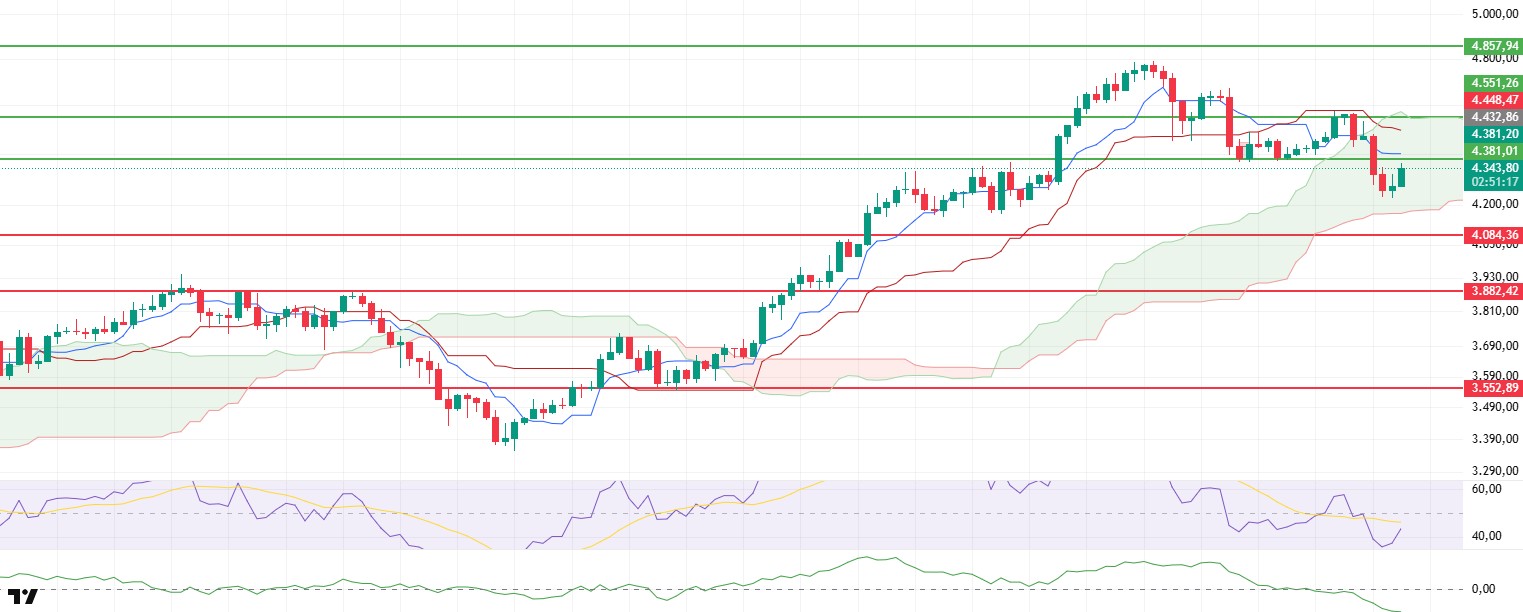
The Ethereum price fell to $4,229 during the day, showing short-term weakness, but managed to rise back to $4,340 with the reaction from this region. However, while this recovery indicates a partial improvement in momentum from a technical perspective, on-chain data and liquidity indicators suggest that there is still no strong and sustained buyer demand driving the upward movement.
In particular, the Chaikin Money Flow (CMF) indicator continuing to remain in negative territory rather than rising alongside prices confirms weak buying appetite in spot markets and ongoing liquidity outflows. This outlook indicates that the structure remains fragile, even if prices show upward movements in the short term.
When examining Cumulative Volume Delta (CVD) data, it is observed that the upward movement is primarily driven by the futures market, while there is no sustained demand on the spot side. This indicates that the movement is structurally weak and largely supported by leveraged transactions, with increases in open interest and funding rates further reinforcing this picture. The rise in open interest indicates new positions entering the market, while the increase in the funding rate suggests that long positions are becoming more costly. However, this outlook has the potential to increase short-term volatility rather than sustain the price increase.
On the momentum side, the Relative Strength Index (RSI) is moving upward with support from the 36 level, showing a parallel recovery with the price. This movement in the RSI indicates that buyers are gaining limited strength in the short term and that the upward scenario is technically supported. However, the fact that the RSI level remains below the neutral zone suggests that the improvement in momentum is currently merely a reaction and is not sufficient on its own to signal a strong trend reversal.
As a result, there is a high probability that the price will rise to $4,381 during the day and then retreat again due to selling pressure in this region. In particular, the lack of appetite on the spot side and the negative outlook of the CMF are increasing the risk of this pullback. However, if the price manages to hold above the 4,381 dollar level, the short-term negative outlook could be broken, and the upward trend could regain strength, paving the way for the price to test higher targets.
Support levels: 4,084 – 3,882 – 3,552
Resistance levels: 4,381 – 4,551 – 4,857
XRP/USDT
Among the notable developments in the XRP ecosystem during the second half of the day was the network optimization work shared by Ripple’s Chief Technology Officer David Schwartz. The “hub server” test conducted on the XRP Ledger aimed to enhance the synchronization reliability of critical nodes and optimize bandwidth and latency metrics. Despite minor data gaps observed during the test, which were attributed to monitoring-related issues, the overall performance was deemed ready for production environments. This step stands out as a development that strengthens the operational resilience of the XRP Ledger in enterprise payment infrastructures. Meanwhile, the Flare network and Firelight introduced a new product that allows XRP holders to earn between 4% and 7% annually by leveraging their idle assets. The system will operate through FXRP, the version of XRP represented on Flare, and can be used for stablecoin issuance, lending pools, or asset purchases. This model was deemed a significant innovation for an asset like XRP, which has not generated returns to date. Meanwhile, Bitcoin Bond Company CEO Pierre Rochard stated in a statement that the growth in the tokenization space will not increase the value of assets like XRP or Ethereum, arguing that the existing financial system already handles securities transactions at low costs. This criticism highlighted differing perspectives within the XRP community on the long-term contributions of tokenization, making it the day’s controversial topic.
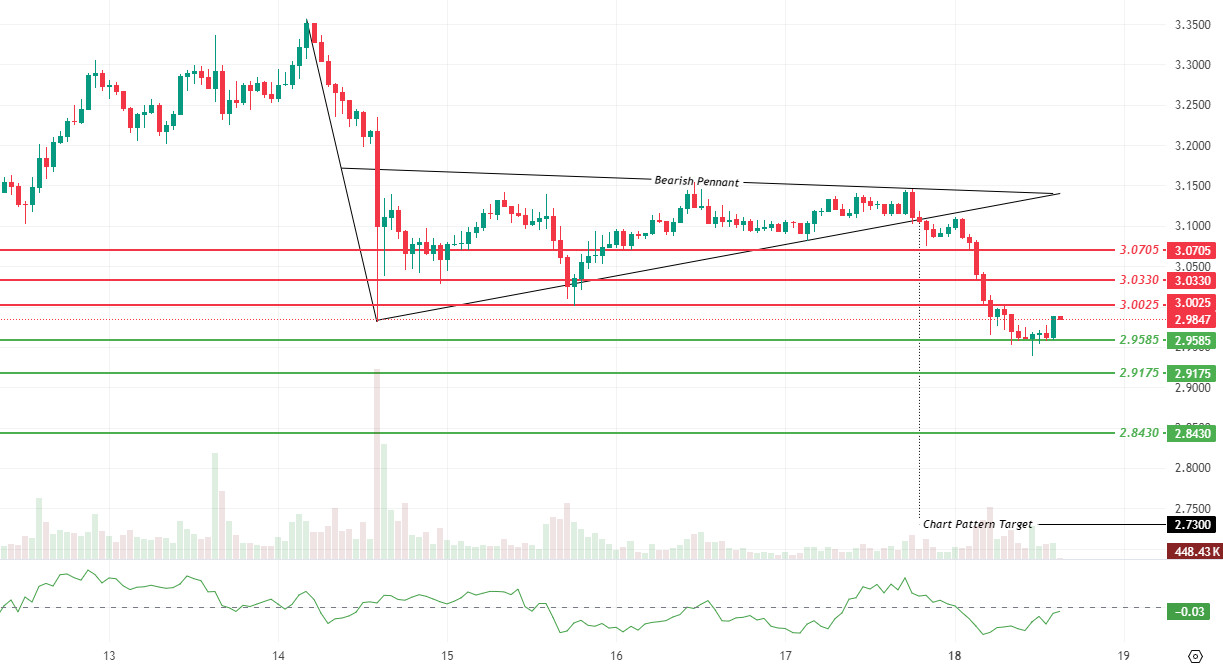
On the technical side, the price fell to $2.9585 after the downward break of the Bearish Pennant formation. The rebound attempt from this level failed to gain momentum due to low trading volume and the lack of sustained movement above the $3.0025–$3.0330 resistance zone. In the short term, $2.9585 remains a critical support level, with a sustained move below this level potentially bringing $2.9175 and $2.8430 into focus. The measured target of the formation continues to point to $2.73, with daily closes below this level potentially accelerating selling pressure. In upward attempts, the 3.0025 and 3.0330 dollar range is the first strong resistance level, and a trend reversal will not be confirmed until hourly closes above 3.0705 dollars.
The Chaikin Money Flow (CMF) indicator is at -0.03, indicating continued capital outflow. On the volume side, the increase that became evident during the breakout has been followed by a loss of momentum in subsequent attempts, suggesting that upward attempts remain weak.
It may remain.
Support levels: 2.9585 – 2.9175 – 2.8430
Resistance levels: 3.0025 – 3.0330 – 3.0705
SOL/USDT
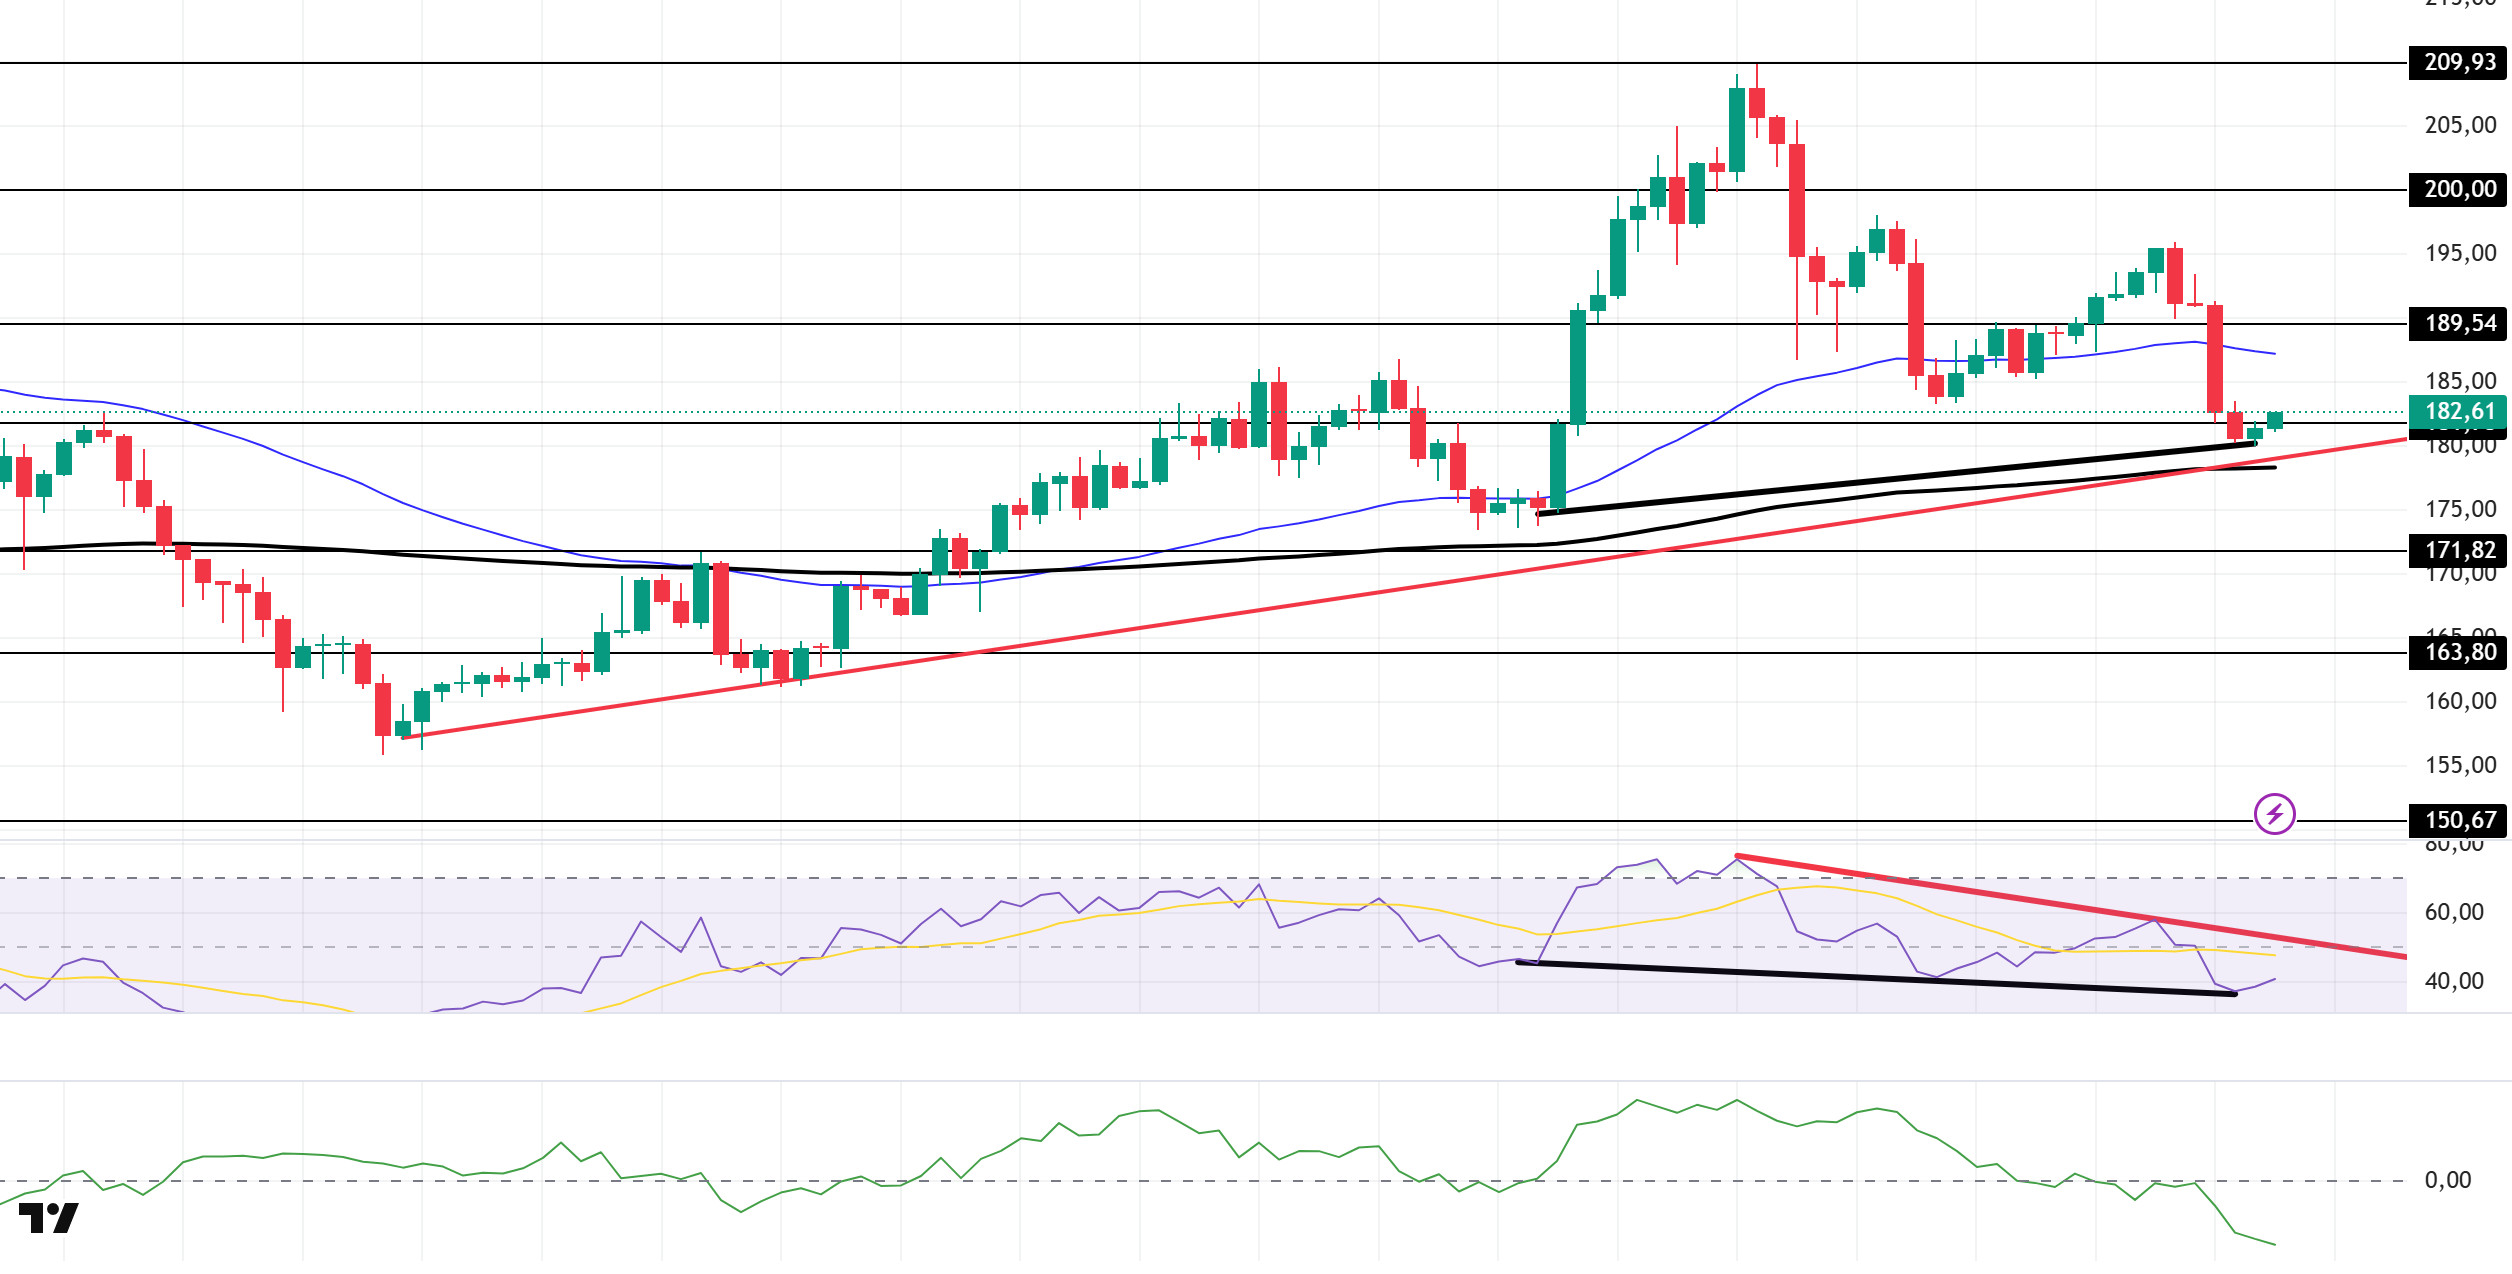
The SOL price is moving sideways during the day. The asset has continued to stay above the upward trend line that began on August 2. After breaking below the $181.75 level, the price has started to accelerate and is now back above this level. A break above this level could signal the start of an upward trend.
On the 4-hour chart, the 50 EMA (Blue Line) remained above the 200 EMA (Black Line). This indicates that the upward trend may continue in the medium term. At the same time, the price being between the two moving averages shows that the market is in a decision phase in the short term. Chaikin Money Flow (CMF-20) has moved into negative territory. However, an increase in money inflows could push CMF back into positive territory. The Relative Strength Index (RSI-14) remains below the downward trend that began on August 14. This indicates that selling pressure is continuing. On the other hand, there is a positive divergence, which could lead to an uptrend. In the event of an uptrend driven by positive macroeconomic data or news related to the Solana ecosystem, the $189.54 level emerges as a strong resistance point. If this level is broken to the upside, the uptrend is expected to continue. In the event of a pullback due to adverse developments or profit-taking, the 171.82 dollar level could be tested. A decline to these support levels could see an increase in buying momentum, presenting a potential opportunity for an upward move.
Support levels: 171.82 – 163.80 – 150.67
Resistance levels: 181.75 – 189.54 – 200.00
DOGE/USDT
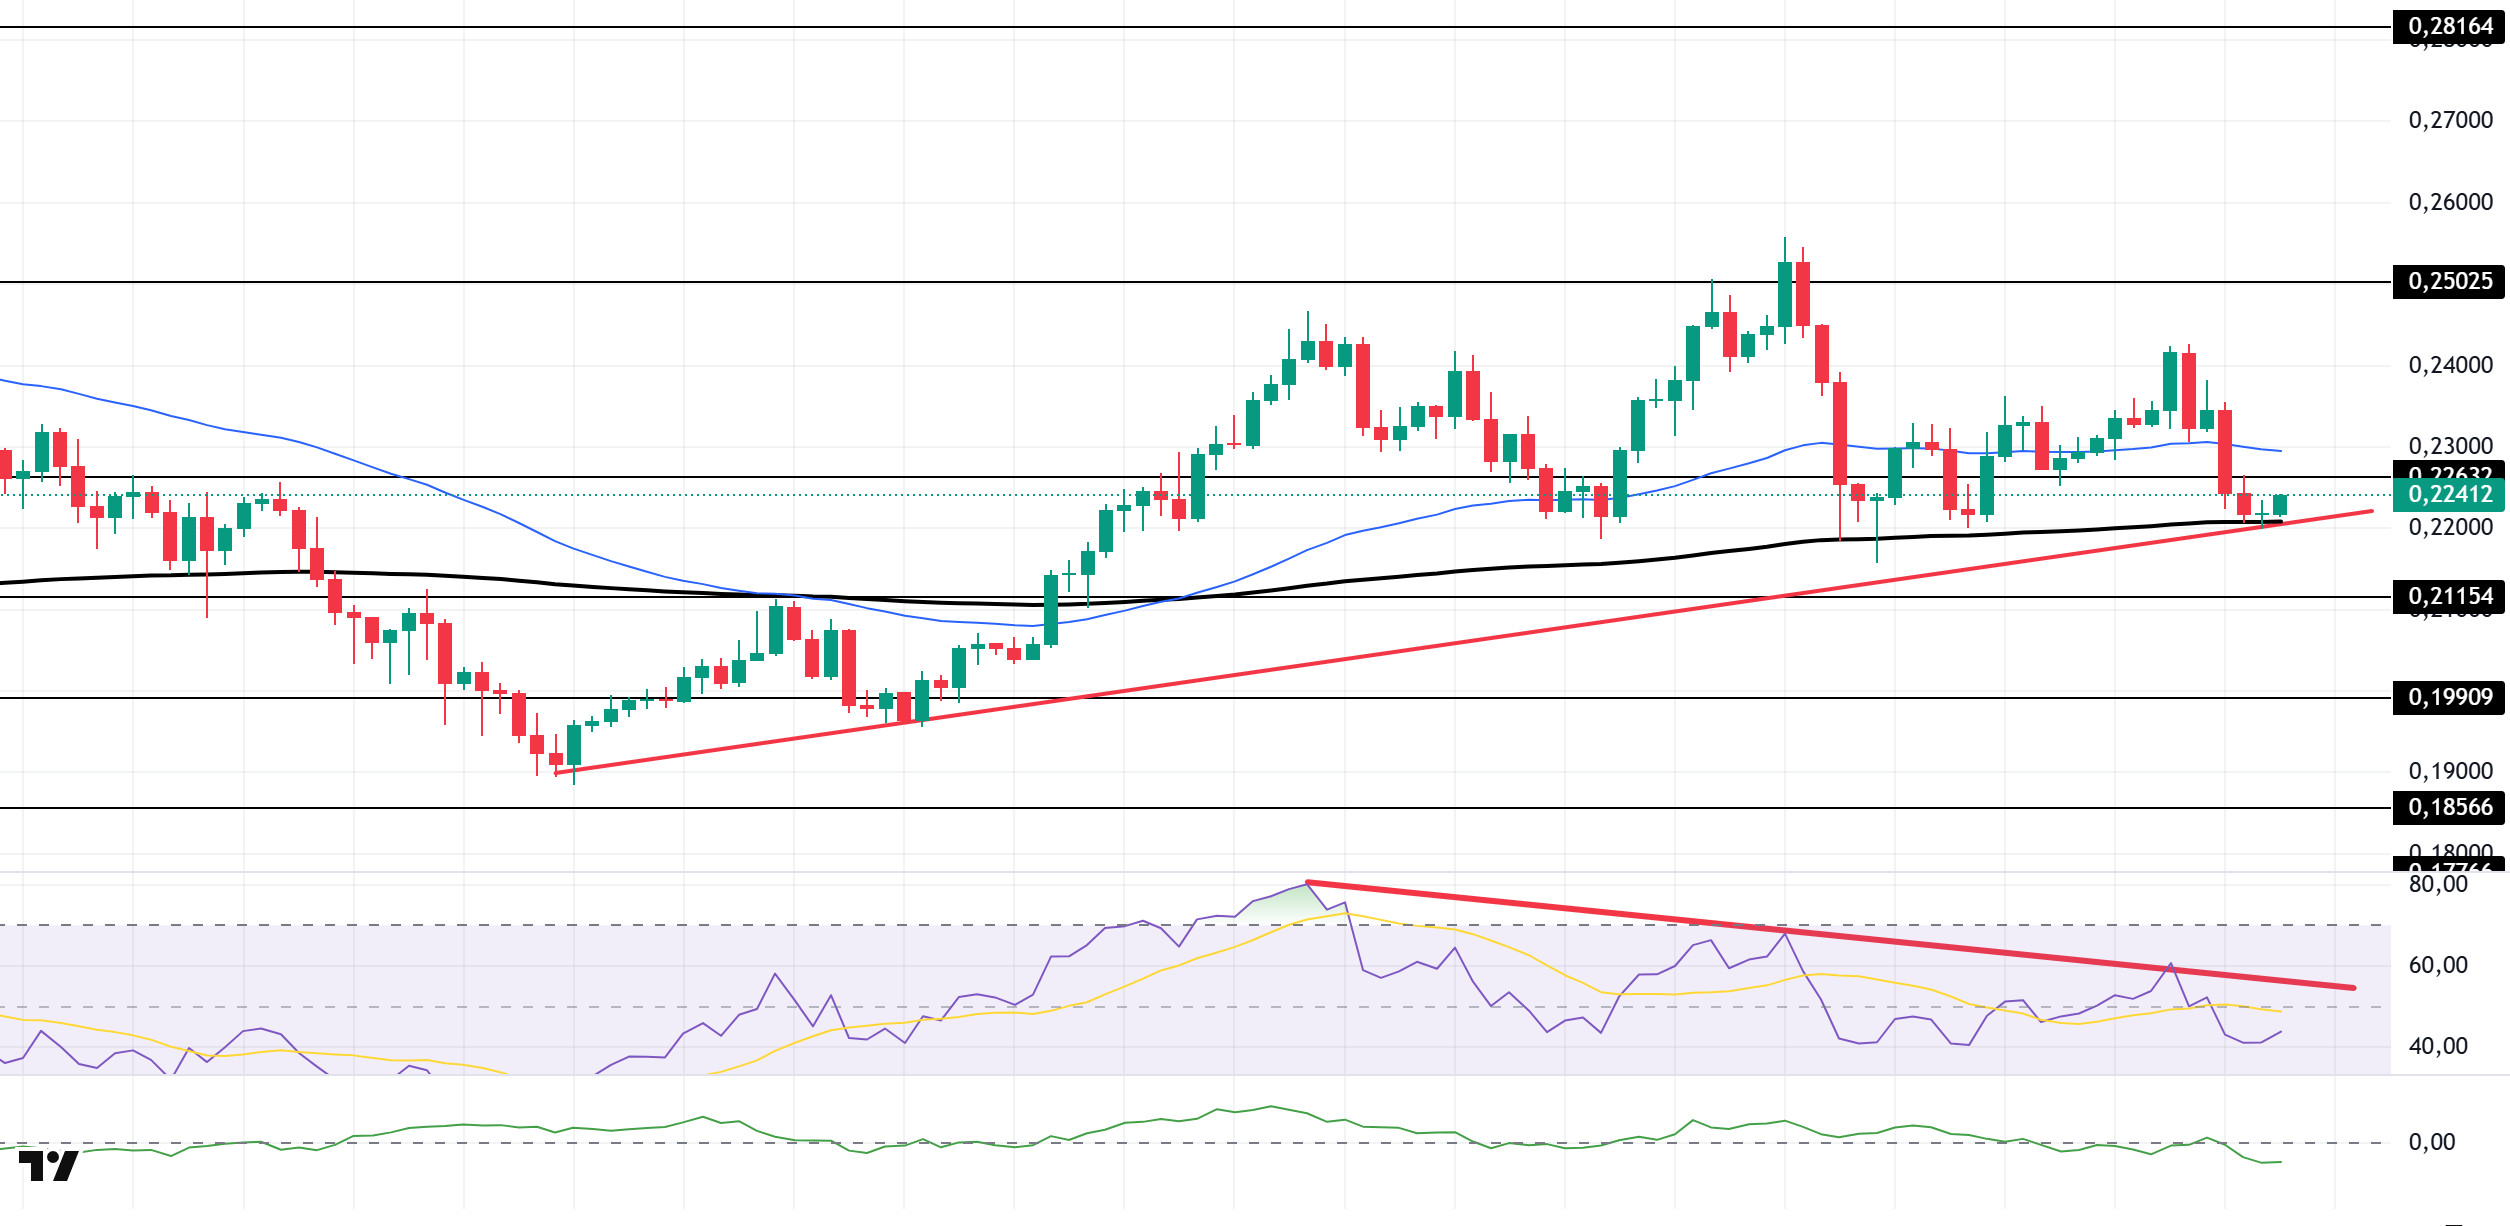
The DOGE price remained flat during the day. The asset continues to trade above the upward trend that began on August 2. As of now, the price has broken below the 0.22632 dollar level and is testing the 200 EMA (Black Line) moving average and the upward trend that began on August 2 as support. If the price closes below these levels, the 0.21154 dollar level should be monitored. In the event of an upward movement, the 50 EMA (Blue Line) moving average should be monitored.
On the 4-hour chart, the 50 EMA (blue line) remains above the 200 EMA (black line). This indicates that the asset is in an upward trend in the medium term. The price being between the two moving averages also indicates that the asset is in a decision-making phase in the short term. Chaikin Money Flow (CMF-20) continues to remain in negative territory. Additionally, negative cash inflows could push the CMF further into the negative zone. The Relative Strength Index (RSI-14) remains in the negative zone. It also continues to stay below the downward trend that began on August 9, indicating that selling pressure persists. In the event of any upward movements driven by political developments, macroeconomic data, or positive news flow within the DOGE ecosystem, the $0.25025 level emerges as a strong resistance zone. In the opposite scenario or in the event of negative news flow, the 0.21154 dollar level could be triggered. A decline to these levels could increase momentum and potentially trigger a new upward wave.
Support levels: 0.21154 – 0.19909 – 0.18566
Resistance levels: 0.22632 – 0.25025 – 0.28164
SHIB/USDT
Shiba Inu showed a balanced trend throughout the day. After the morning’s surge in burns, the ecosystem returned to normal, with limited fluctuations in pricing. Market participants appear to be maintaining a cautious stance in the short term.
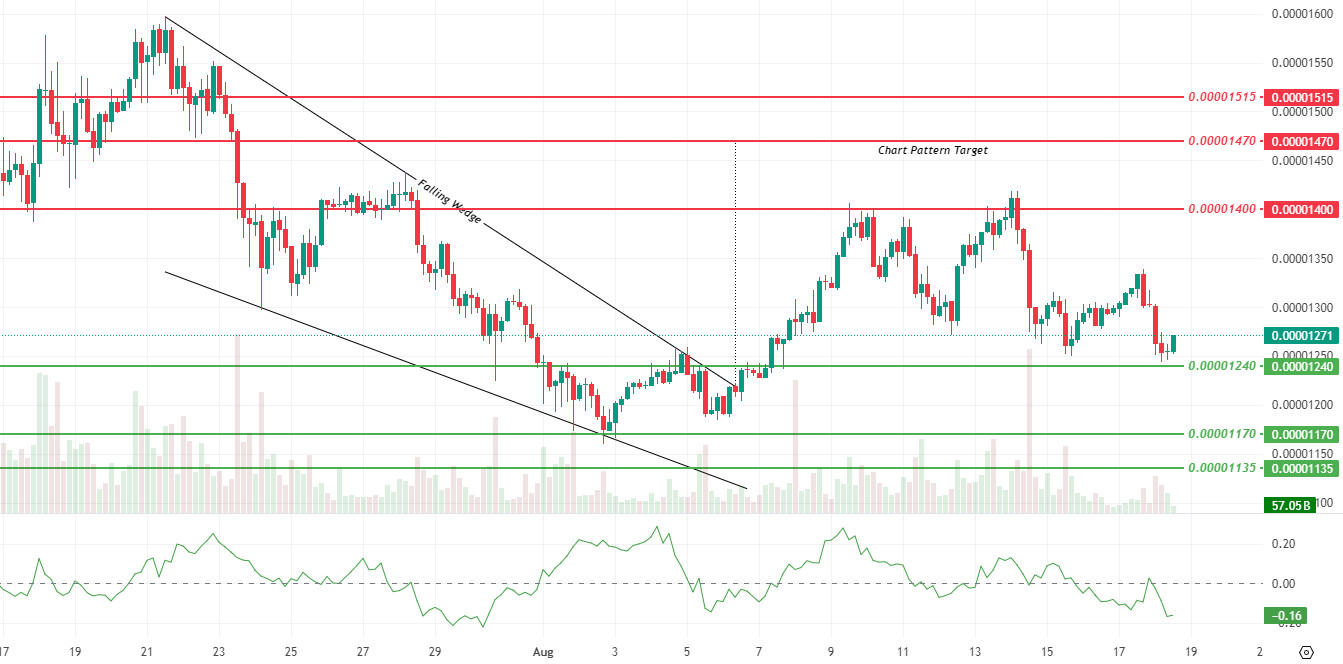
Technically, SHIB tested the $0.00001240 support level during the day and then rebounded to $0.00001271 in the evening with buying from this level. This movement confirms that the support level is still holding for now. In the event of a break below this level, the 0.00001170 and 0.00001135 dollar levels will come back into focus. Looking upward, the 0.00001400 dollar level remains a critical resistance, and closing above this level could bring the 0.00001470 and 0.00001515 dollar targets into focus.
The Chaikin Money Flow (CMF) indicator remains at -0.16, continuing its negative trend. This indicates that capital inflows remain weak despite the price’s efforts to hold at support levels. For upward movements to gain strength, resistance breaks need to be supported by volume. The Falling Wedge formation, which has remained valid since July 21, continues to be monitored in the medium-term chart. It is seen that the market needs a stronger liquidity flow to reach the target level of 0.00001470 dollars.
Support levels: 0.00001240 – 0.00001170 – 0.00001135
Resistance levels: 0.00001400 – 0.00001470 – 0.00001515
ADA/USDT
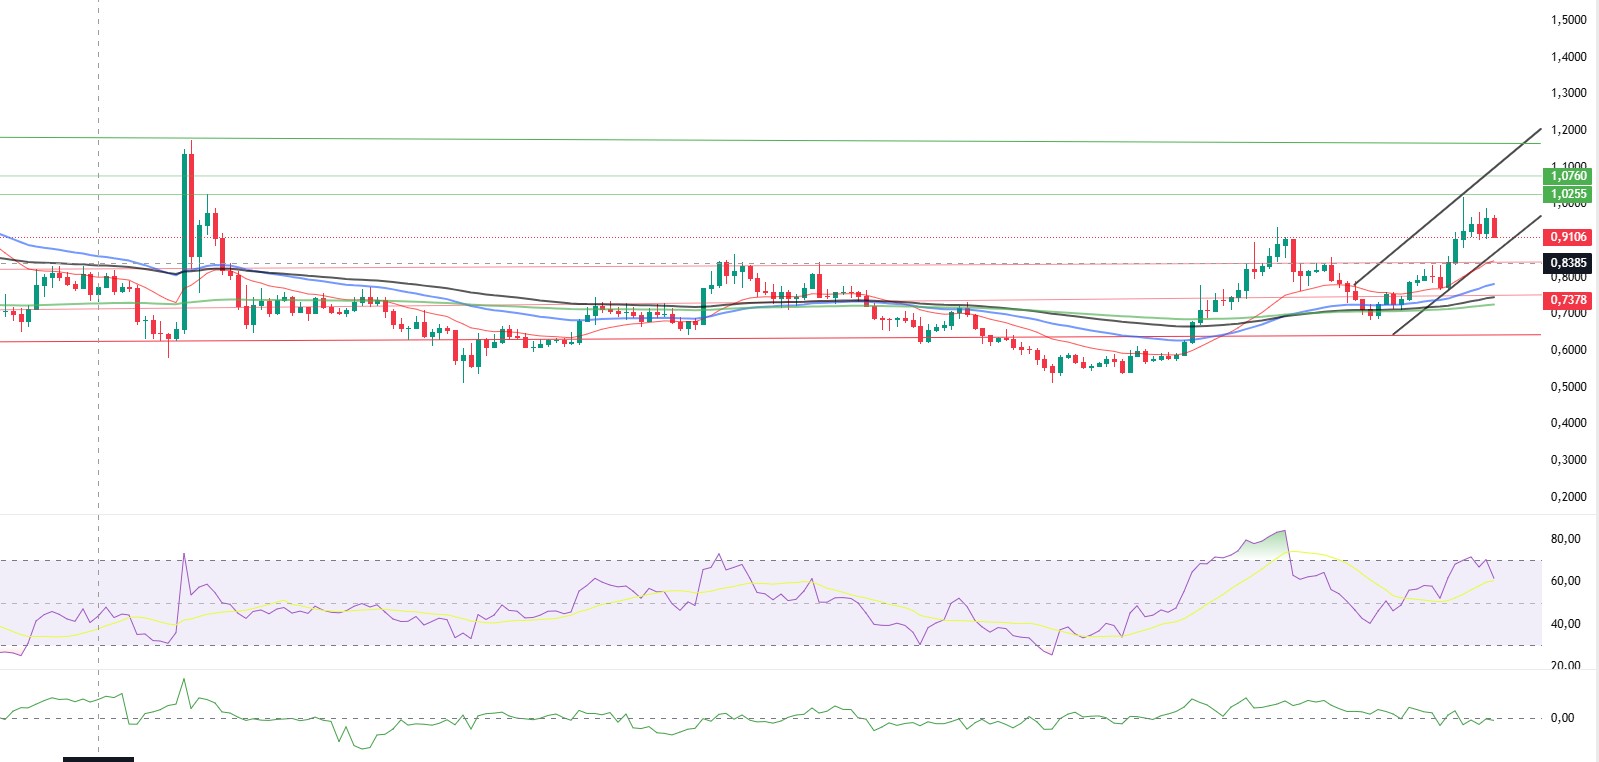
ADA price fell during the day, dropping below the 20 EMA (Red Line). On the 4-hour chart, ADA continues to move within an upward channel, remaining above the 50 EMA (Blue Line) and 100 EMA (Black Line). If the price closes below the 50 EMA (Blue Line) at the end of the day, it could break out of the rising channel that has been in place since August 12. This could signal the end of the uptrend and a potential decline to the support level at 0.8798. The price may change direction with a breakout/contraction by forming a symmetrical triangle pattern in the area marked on the chart. If the price continues within the rising channel band without changing direction, the 1.0228 levels could be tested as the first resistance level, which may indicate that the upward trend could continue in the medium term. Although the Relative Strength Index (RSI-14) retreated to 47 levels during the day and continued its positive correlation with the price, the Chaikin Money Flow (CMF-20) showed a divergence and remained at a negative level of -0.19. The decrease in money inflows may keep the CMF in the negative zone and continue as selling pressure.
In the event of an upturn due to macroeconomic data or positive news related to the Cardano ecosystem, the $1.0883 level stands out as a strong resistance point. If this level is broken upwards, the uptrend is expected to continue. In the event of a pullback due to adverse developments or profit-taking, the 0.8241 dollar level could be tested. A decline to these support levels could signal an increase in selling momentum, indicating a potential downward trend.
Support levels: 0.8798 – 0.8241 – 0.7535
Resistances: 1.0883 – 1.0228 – 0.9506
Legal Notice
The investment information, comments, and recommendations contained herein do not constitute investment advice. Investment advisory services are provided individually by authorized institutions taking into account the risk and return preferences of individuals. The comments and recommendations contained herein are of a general nature. These recommendations may not be suitable for your financial situation and risk and return preferences. Therefore, making an investment decision based solely on the information contained herein may not produce results in line with your expectations.

