
Technical Analysis
BTC/USDT
U.S. Treasury Secretary Scott Bessent discussed the global acceptance of dollar stablecoins and their role in international payment systems during his meeting with the Prime Minister of Singapore. On the monetary policy front, Fed members signaled that another rate cut in December could be difficult. Logan and Schmid took a hawkish stance, warning that growth could put upward pressure on inflation again. In the corporate sphere, Prenetics purchased an additional 100 BTC at an average price of $109K, reaching a total of 378 BTC, and announced it would continue its “1 BTC per day” purchase strategy. Additionally, Strategy transferred 22,704 BTC ($2.45 billion) worth of assets to new wallets in the last 9 hours. This move was interpreted as either a corporate portfolio restructuring or an address distribution for security purposes.
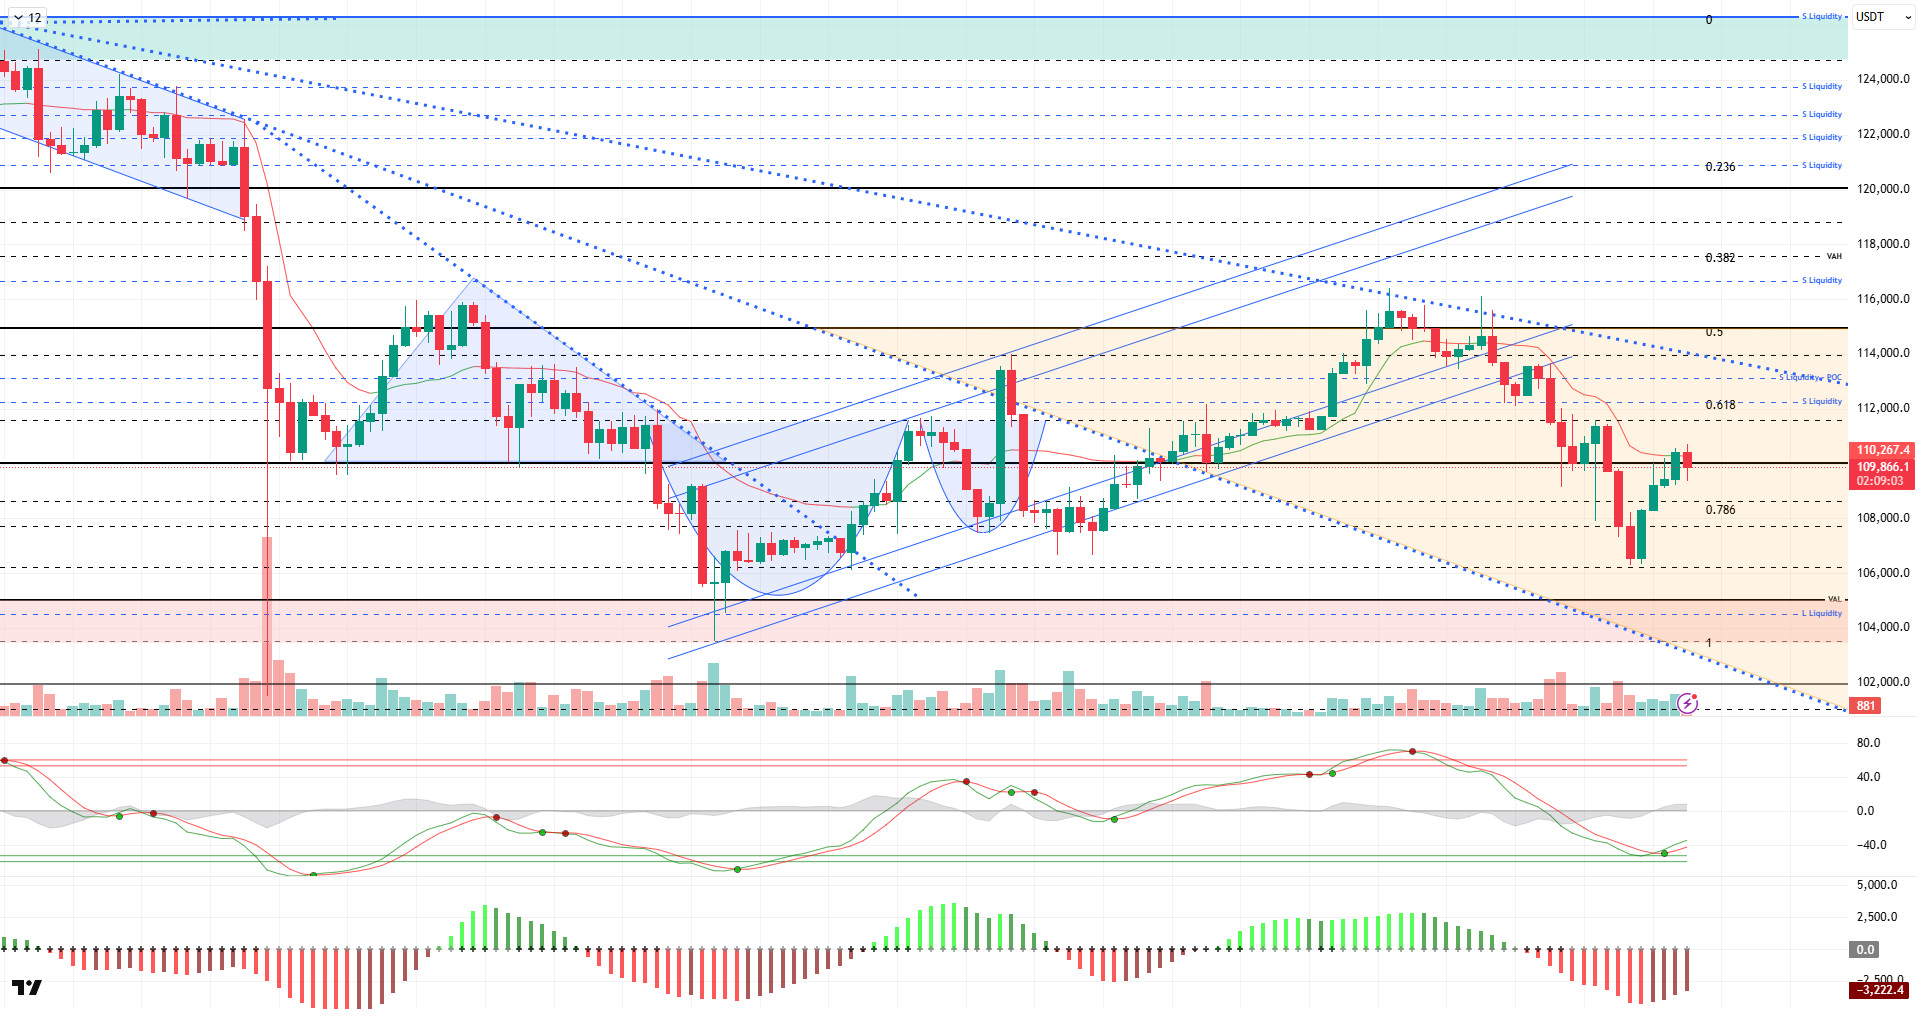
From a technical perspective, BTC has not experienced a significant change compared to the previous analysis and continues to test the 110,000 resistance zone. Although the price occasionally surpasses this level, it has not yet achieved a clear breakout. If a breakout occurs, the next area we will monitor will be the POC zone.
Technical indicators are preparing for a trend reversal with a buy signal in the oversold zone of the Wave Trend (WT), while the Squeeze Momentum (SM) indicator is attempting to gain momentum within the negative area of the histogram. The Kaufman moving average (KAMA) is currently at $110,280, positioned above the price.
According to liquidation data, the buy level recorded some accumulation at the short-term level of $105,600, while positions thinned out in the medium term. In contrast, the sell level has reached significant intensity at $112,000–$113,000.
In summary, on the fundamental side, the tariff crisis between the US and China has been suspended for a year and resulted in a compromise. The balance sheets of corporate technology companies, meanwhile, exceeded expectations. The last day of October is celebrated as “Bitcoin Whitepaper Day.” BTC, which performed below expectations in October, is preparing to close in the red for the first time in six years, while November has been bright from a cyclical perspective. On the technical side, BTC formed a minor descending channel and managed to recover despite falling to the 106,300 level. In liquidity data, balanced transactions, along with the recent decline, brought the selling level to the forefront. In the coming period, 110,000 will be monitored as a critical resistance point, and gaining this level could bring a new uptrend to the liquidity zone. In the event of potential selling pressure, the support levels of 108,600 and then 107,500 will be monitored.
Supports: 108,600 – 107,400 – 106,600
Resistances: 110,000 – 111,400 – 112,600
ETH/USDT
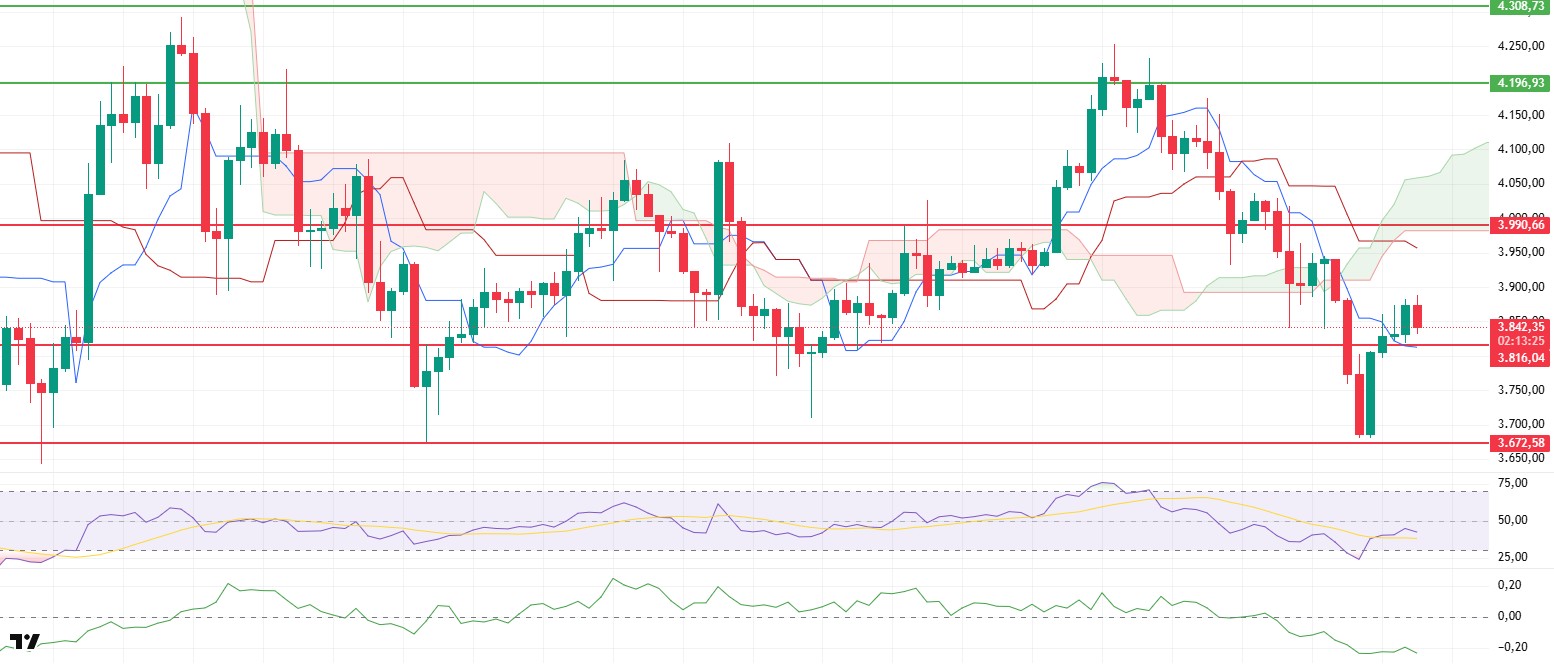
The ETH price continued its upward trend after regaining the $3,816 level in the morning hours, reaching as high as $3,880. However, with the opening of US stock markets, selling pressure increased again, and the price retreated to the $3,830 region. This movement indicates that buying interest remains weak and short-term rallies are progressing within a limited range.
The Chaikin Money Flow (CMF) indicator continues to decline in negative territory, indicating that capital outflows are continuing. This structure of the CMF signals that critical liquidity inflows for the market have not yet begun and that buyers have not returned to the market in a strong manner. As long as liquidity weakness persists, it seems difficult for the price to show a sustained recovery.
The Relative Strength Index (RSI) indicator failed to maintain the momentum it gained after exiting the oversold zone and showed a slight pullback. This decline in the RSI indicates that buyers have not gained enough strength to sustain momentum and that the market is still cautious.
In the Ichimoku indicator, the price is still moving below the kumo cloud. This outlook indicates that the overall trend direction remains negative and that upward attempts may be limited for now. The price settling above the cloud stands out as a fundamental condition necessary for short-term stability.
Overall, the technical structure remains weak. Although the recovery in the RSI creates a short-term breathing space, the CMF remaining in negative territory indicates that buyers have not yet taken control. A loss of the $3,818 support level could reignite selling pressure and pull the price back towards the $3,672 level. Conversely, if the price holds above this level and the CMF gains upward momentum, a recovery towards the $3,928 region could be seen. However, as the overall trend remains downward, any potential rallies may continue to be short-term.
Support levels: 3,816 – 3,672 – 3,436
Resistances: 3,928 – 3,990 – 4,196
XRP/USDT
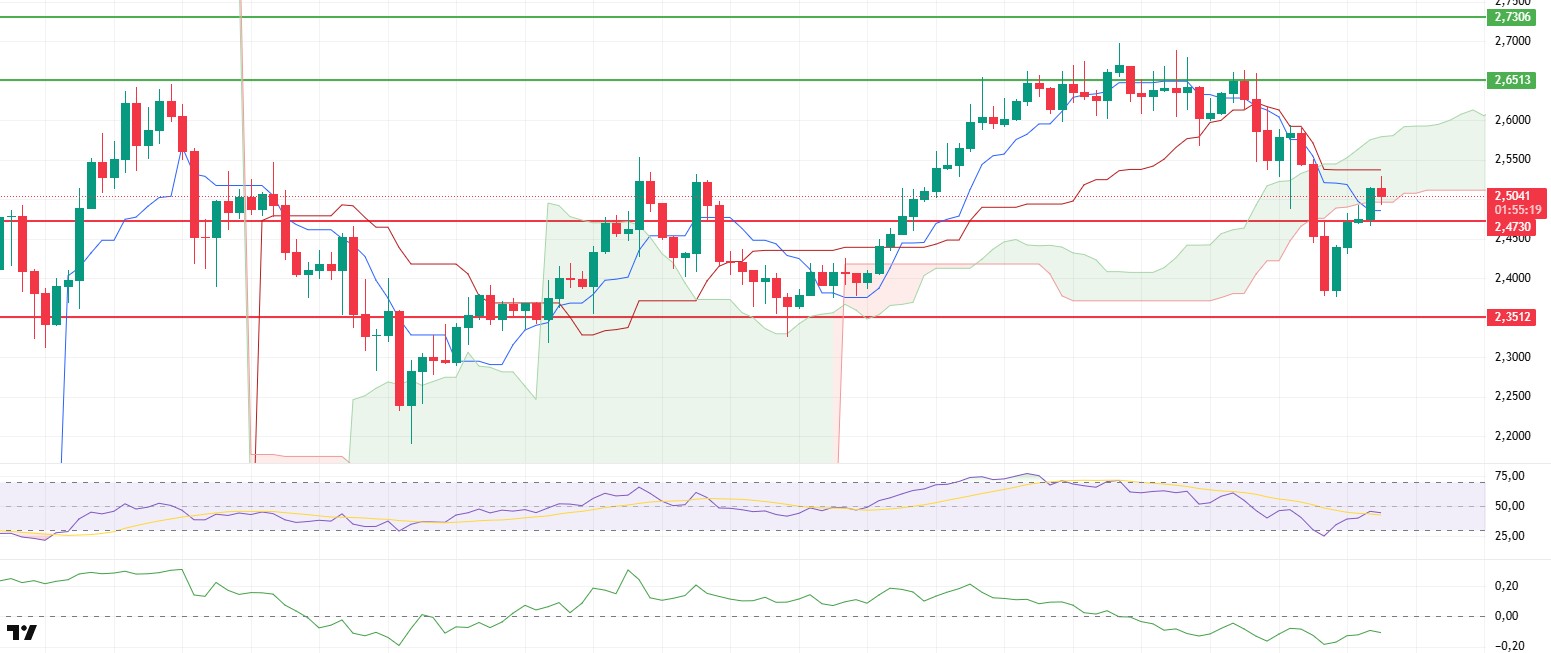
The XRP price broke through the lower band of the cloud at the $2.49 level during the day, gaining short-term upward momentum and rising to the $2.53 level. However, with selling pressure from this area, the price experienced a slight pullback, falling back to the $2.50 level. This movement indicates that reactionary buying is still effective, but upward momentum remains weak.
The Relative Strength Index (RSI) indicator is maintaining its upward trend after exiting the oversold zone. The continued recovery in momentum indicates that selling pressure has eased for now and buyers are re-entering the market in the short term. However, it is too early to say that this movement signals a strong trend reversal.
The Chaikin Money Flow (CMF) indicator continues its horizontal movement in negative territory. The lack of significant capital inflows into the market is limiting upward price movements. The CMF’s weak appearance indicates that investors remain cautious and that the market is still searching for a clear direction.
In the Ichimoku indicator, the price breaking above the lower band of the kumo cloud and the tenkan level signals that the trend is beginning to turn positive again.
Technically, the $2.47 level remains a critical support level. Falling below this level could increase selling pressure again and pull the price back towards the $2.40 region. However, if the price manages to stay above $2.47 and volume increases, upward movements are expected to continue in the short term. While the overall outlook remains weak, the recovery in the RSI and short-term buyer interest support the possibility of limited intraday gains.
Supports: 2.4730 – 2.3512 – 2.2100
Resistances: 2.6513 – 2.7306 – 2.8576
SOL/USDT
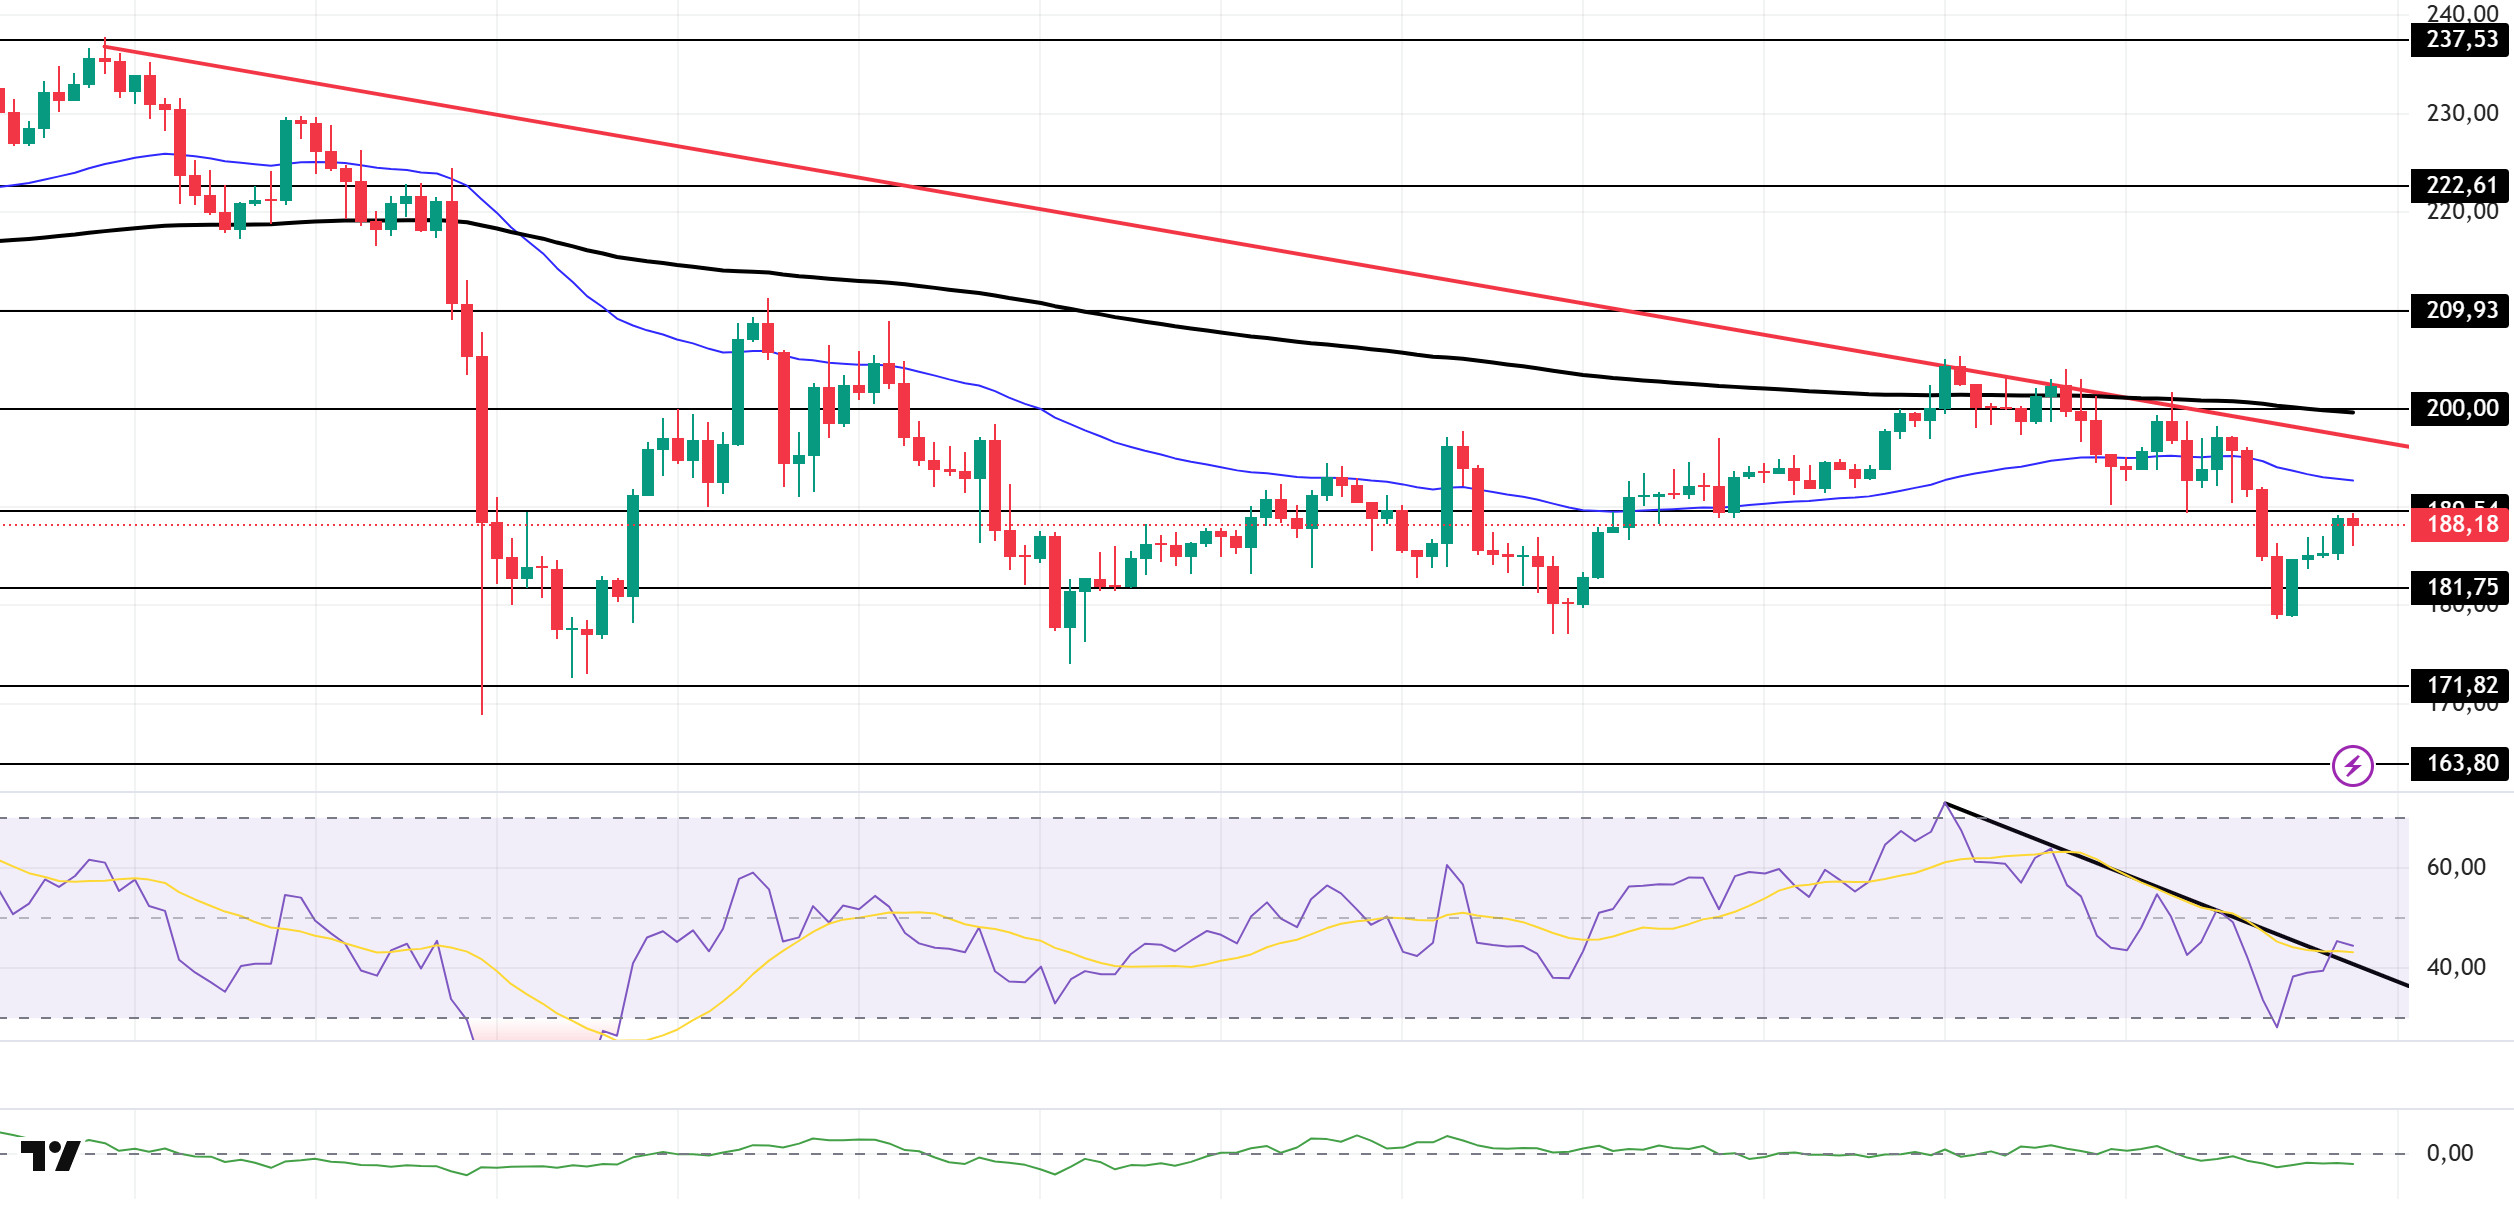
The price of SOL experienced a slight increase during the day. The asset tested the 50 EMA (Blue Line) moving average as resistance but failed to break through, continuing its pullback and remaining in the lower region of the downward trend that began on October 6. Currently, the price tested the strong resistance level of $189.54 and experienced a slight pullback. If the pullback continues, the $171.82 level should be monitored. If it experiences an uptrend, it may test the 50 EMA moving average.
On the 4-hour chart, it remained below the 50 EMA (Exponential Moving Average – Blue Line) and 200 EMA (Black Line). This indicates that it may be in a downtrend in the medium term. At the same time, the price being below both moving averages shows us that the asset is in a downward trend in the short term. The Chaikin Money Flow (CMF-20) remained in the negative zone near the neutral level. However, an increase in money inflows could push the CMF into positive territory. The Relative Strength Index (RSI-14) is in the negative zone. At the same time, it began to rise above the downward trend that started on October 27. This signaled that buying pressure could increase. In the event of an upturn due to macroeconomic data or positive news related to the Solana ecosystem, the $200.00 level stands out as a strong resistance point. If this level is broken upwards, the uptrend is expected to continue. In case of pullbacks due to developments in the opposite direction or profit-taking, the $163.80 level could be tested. A decline to these support levels could increase buying momentum, presenting a potential upside opportunity.
Supports: 181.75 – 171.82 – 163.80
Resistances: 189.54 – 200.00 – 209.93
DOGE/USDT
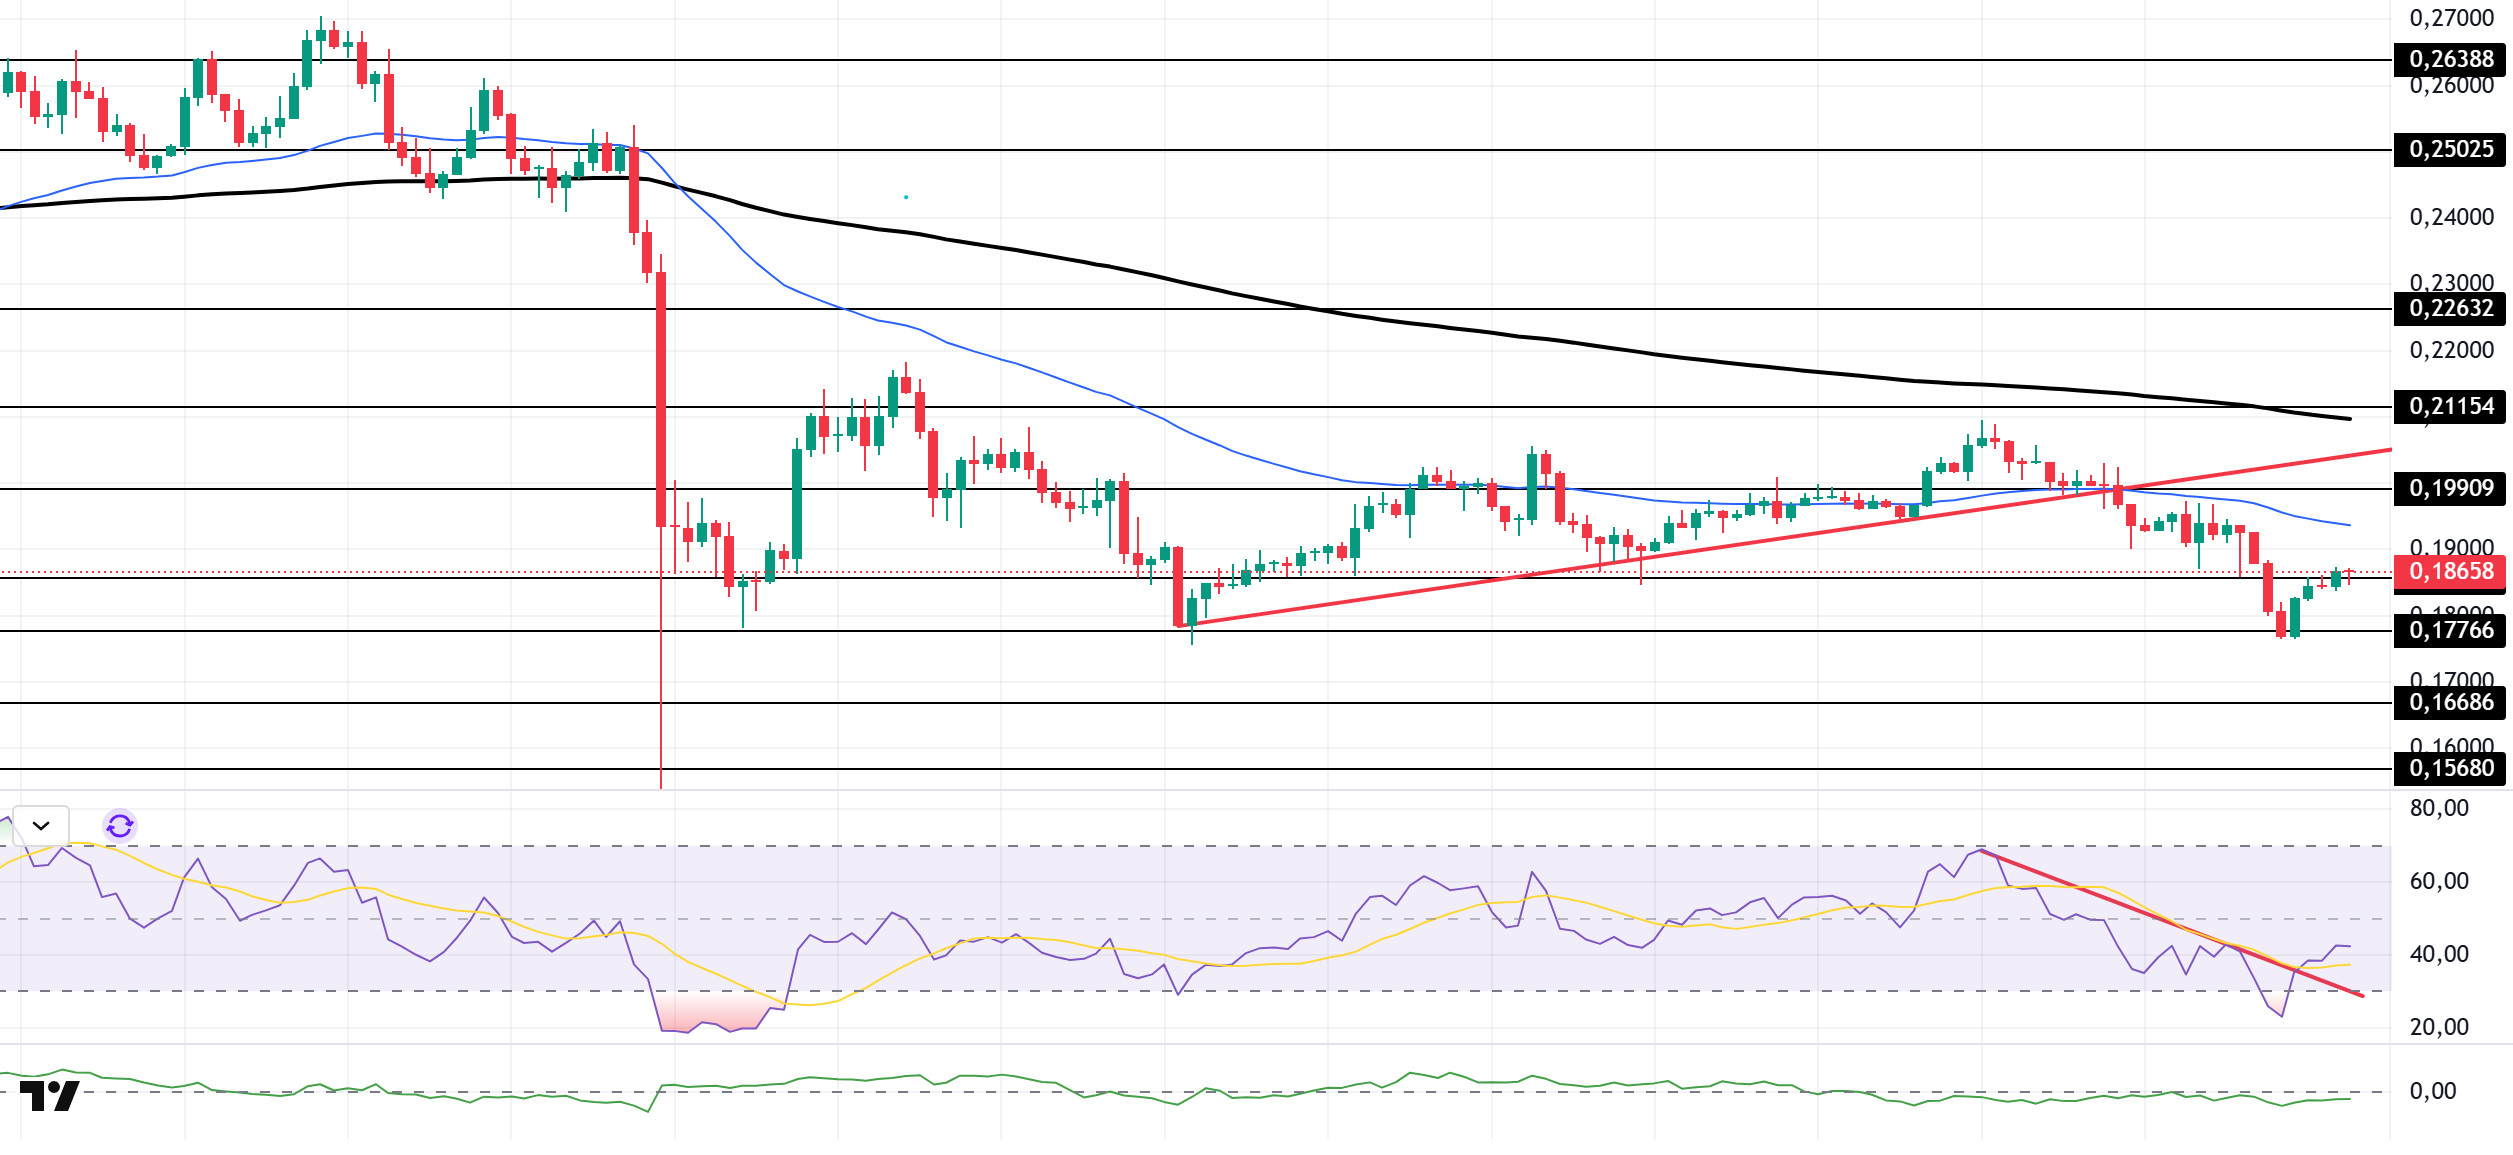
The DOGE price traded sideways during the day. The asset remained in the lower region of the upward trend that began on October 17. This indicated increased selling pressure. Currently testing the strong support level of $0.18566, the asset could test the $0.16686 level if it closes below this level. In the event of an uptrend, the 50 EMA (Blue Line) moving average can be monitored.
On the 4-hour chart, the 50 EMA (Exponential Moving Average – Blue Line) remained below the 200 EMA (Black Line). This indicates that a downtrend may begin in the medium term. The price being below both moving averages shows that the price is trending downward in the short term. The Chaikin Money Flow (CMF-20) also remained in negative territory. Additionally, an increase in money inflows could push the CMF into positive territory. The Relative Strength Index (RSI-14) is in the middle of the negative zone. At the same time, it remained in the upper region of the downward trend that began on October 27. This could increase buying pressure. In the event of an uptrend driven by political developments, macroeconomic data, or positive news flow in the DOGE ecosystem, the $0.21154 level stands out as a strong resistance zone. Conversely, in the event of negative news flow, the $0.15680 level could be triggered. A decline to these levels could increase momentum and initiate a new wave of growth.
Supports: $0.18566 – $0.17766 – $0.16686
Resistances: 0.19909 – 0.21154 – 0.22632
LINK/USDT
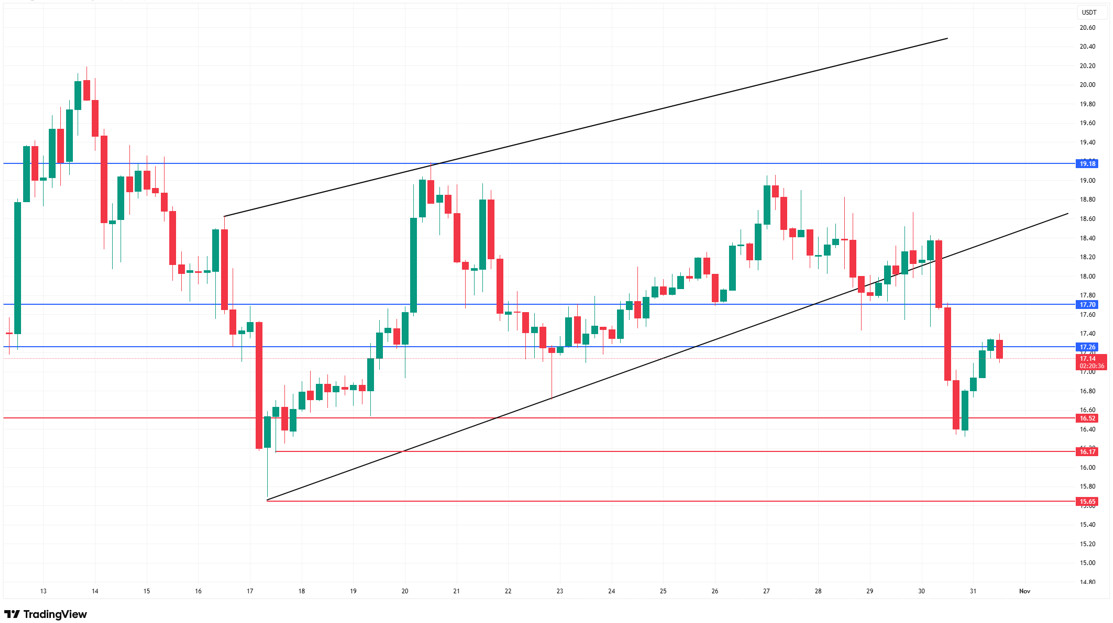
Link continues to maintain its downward pressure by staying below the $17.70 resistance level we mentioned in our previous analysis. Indeed, this level acts as a strong resistance in the short term, as it corresponds to the lower band of the broken rising channel. While the search for equilibrium continues at the $17.20 level, the price’s inability to maintain stability above this region has triggered a new wave of selling.
Looking at the current technical situation, $17.20 has now become a short-term intermediate resistance level. Upward attempts will remain weak unless the price manages to stay above this region. The main resistance zone, the $17.70–17.88 band, intersects with the lower band of the broken channel, making it critically important for a trend reversal. Unless there are 4-hour closes above this level, the current downtrend will technically remain valid.
In possible downward scenarios, if the price tests the $16.52 level again and buying interest remains weak, the $16.17 and $15.85 levels could come into play. The $15.85 level, in particular, stands out as our main support area in the short term. If the price falls below this region, we can expect the selling wave to gain momentum and the downtrend to deepen. In the event of a potential upward recovery, the first resistance is at $17.70, followed by expansion potential towards the $19.18 level. However, for this scenario to materialize, the price needs to maintain stability above $17.70 and gain strength with volume support.
Although the Relative Strength Index (RSI) indicator shows a slight recovery signal at the 42 level, it is still below the 50 level, indicating that sellers are still dominant. Despite a limited recovery in momentum, a trend reversal signal has not yet formed.
Supports: 16.26 – 16.52 – 15.65
Resistances: 17.26 – 17.70 – 19.18
Legal Notice
The investment information, comments, and recommendations contained herein do not constitute investment advice. Investment advisory services are provided individually by authorized institutions taking into account the risk and return preferences of individuals. The comments and recommendations contained herein are of a general nature. These recommendations may not be suitable for your financial situation and risk and return preferences. Therefore, making an investment decision based solely on the information contained herein may not produce results in line with your expectations.


