
Teknik Analiz
BTC/USDT
ABD Başkanı Donald Trump, federal düzenleyicilerin kripto para sektörüyle çalışan finans kurumlarını hedef almasını engelleyen bir kararname imzaladı. Emir, artan düzenleme için bir gerekçe olarak "itibar riski" kullanımını geçersiz kılıyor. İngiltere merkezli The Smarter Web Company, 50 BTC daha satın alarak toplam Bitcoin varlığını 2.100'e çıkardı. Bitcoin spot ETF'lerine toplam 281 milyon $ net giriş kaydedilirken, tek günlük en büyük giriş 157 milyon $ ile BlackRock IBIT ETF'sinde gerçekleşti.
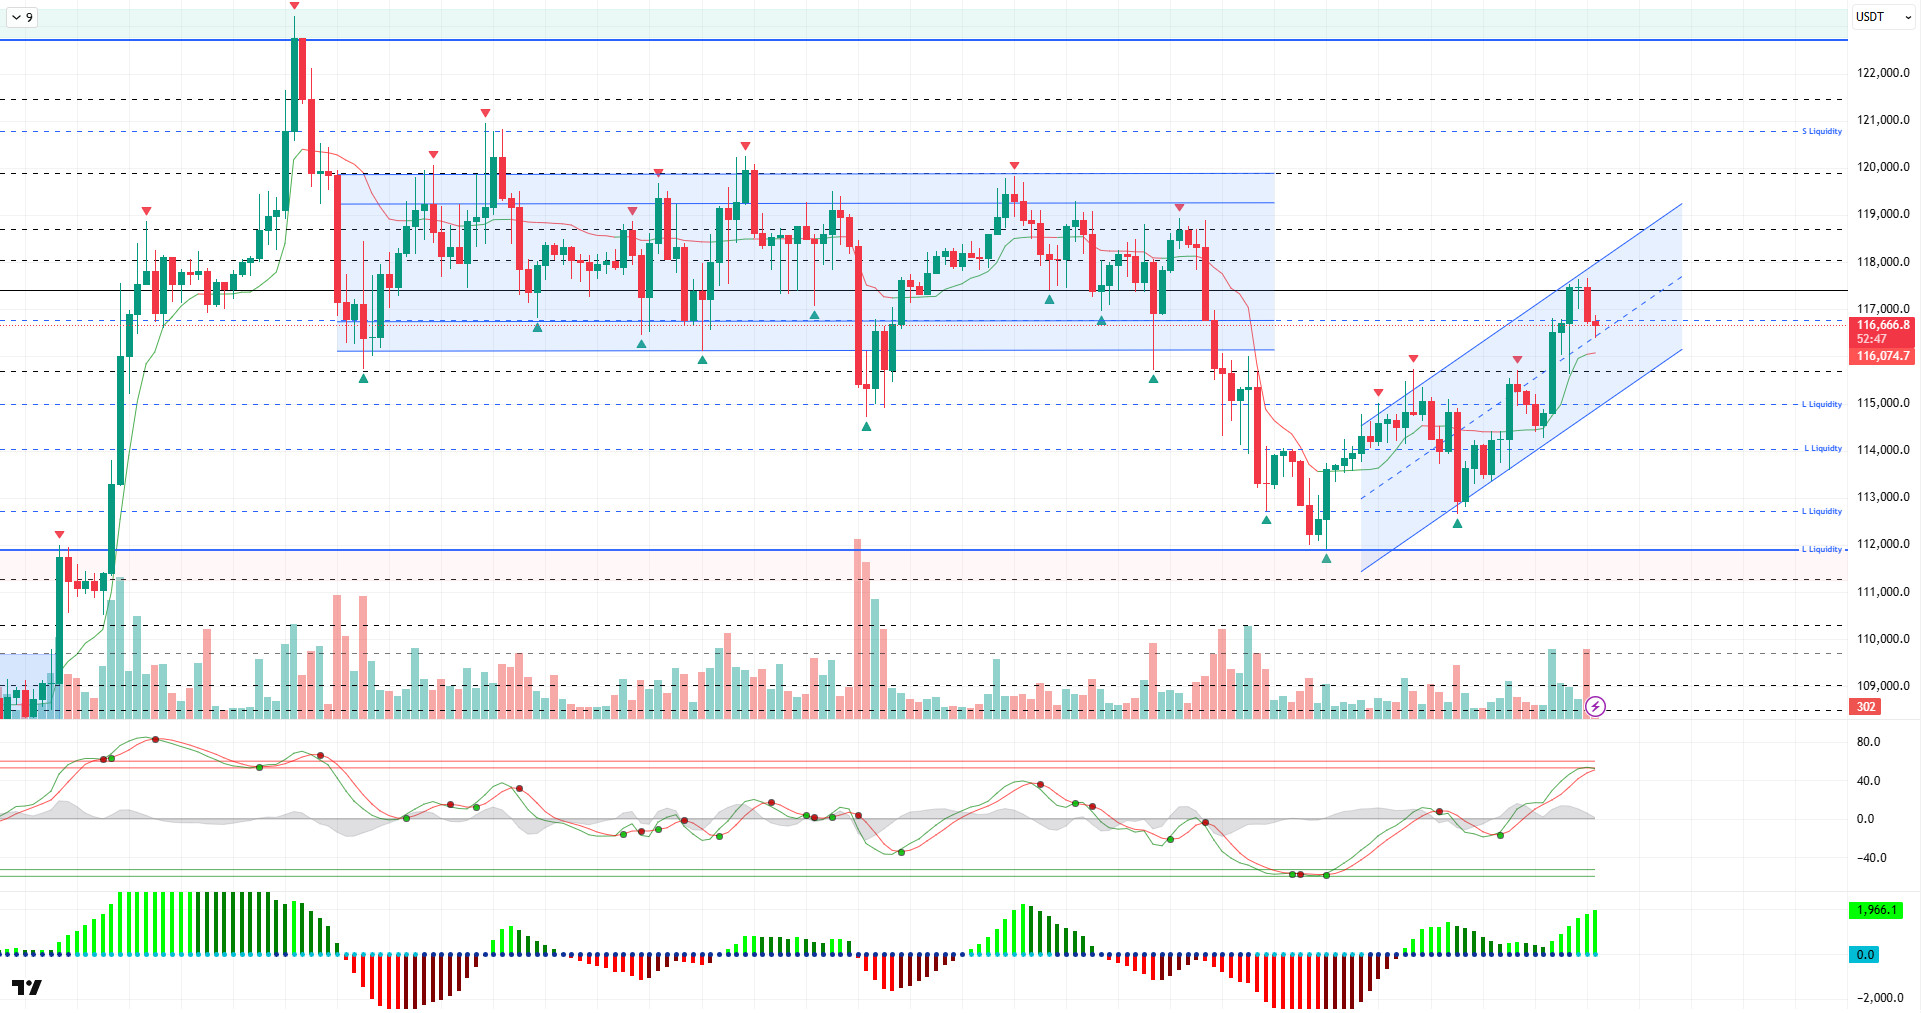
Teknik tabloya bakıldığında BTC, son gelişmelerin ortasında 117.600 seviyesini test ederek bir önceki analize kıyasla yukarı yönlü hareketini sürdürdü. Daha önce konsolide olduğu yatay bant aralığına geri dönen fiyat, yazının kaleme alındığı sırada 116.600 seviyesinden trading görüyordu.
Teknik göstergeler Dalga Eğilimi osilatörünün (WT) aşırı alım bölgesine girdiğini ve potansiyel olarak bir trend dönüşüne işaret ettiğini gösteriyor. Bununla birlikte, Squeeze Momentum (SM) göstergesi pozitif bölgede ivme kazanıyor. Kaufman hareketli ortalaması şu anda 116.000 seviyesinde fiyatın altında hareket ediyor.
Likidite verilerine bakıldığında, 116.000-117.000 bandında açılan satış yönlü işlemlerin likide edildiği gözlendi. Daha geniş zaman diliminde, satış yönlü pozisyonlar 120.000 seviyesinin üzerinde yoğunlaşmaya devam ediyor. Kısa vadeli alış yönlü işlemler ise 115.200, 114.000, 113.100 ve 111.800 seviyelerinde kademeli olarak birikmiş durumda.
Özetle, temel cephedeki son gelişmeler, Trump yönetiminden gelen açıklamalarla birleşerek risk iştahında artışa yol açtı ve BTC'nin ay başında yaşadığı kayıpların toparlanmasıyla sonuçlandı. Teknik yapı, daha önce atılan olumlu zemin doğrultusunda yukarı doğru hareket ediyor ve bir doygunluk noktasına ulaştıktan sonra trendin tersine dönmesine hazırlanıyor olabilir. Likidite verileri açısından alım yönlü işlemler hız kazanmış durumda ve fiyat geri çekilmelerinde birikimlerin oluştuğu alanlar destek seviyeleri olarak izlenecek. Önümüzdeki dönemde 115.000 seviyesinin üzerindeki günlük kapanışları izleyerek yükseliş trendi için yeniden tanımladığımız parametrelerin özellikle likidite ve teknik göstergeler açısından dengeli olup olmadığını değerlendireceğiz. Aksi takdirde, bir fiyat düzeltmesi ve belirlenen likidite bölgelerinin test edilmesi beklenmektedir.
Destek seviyeleri: 115.700 - 115.000 - 114.000
Direnç seviyeleri: 117.400 - 118.600 - 119.200
ETH/USDT
ABD Başkanı Donald Trump dün, finansal piyasalar ve kripto varlık ekosistemi için önemli bir politika değişikliğini temsil eden iki icra emri imzaladı. İlk emir, özel varlıkların 401(k) emeklilik fonlarına dahil edilmesini kolaylaştırarak bireysel yatırımcıların portföylerini çeşitlendirmelerine olanak tanıyor. İkinci icra emri, kripto para şirketlerinin bankalarla çalışmasını kısıtlayan düzenlemeleri kaldırmayı ve böylece sektöre doğrudan operasyonel ve likidite avantajları sağlamayı amaçlıyor. Bu gelişmeler piyasa psikolojisi üzerinde güçlü bir pozitif katalizör etkisi yaratarak ETH fiyatının hızla 3.900 dolar seviyesinin üzerine çıkmasına neden oldu.
Zincir üstü veriler detaylı incelendiğinde, hem spot hem de vadeli piyasalarda Kümülatif Hacim Deltası (CVD) göstergelerinde senkronize bir artış olduğu görülebilir. CVD'lerdeki bu eğilim hareketin sağlıklı bir talebe dayandığına işaret ederken, fonlama oranlarında ve açık faizde eş zamanlı olarak görülen keskin yükseliş piyasadaki kaldıraçlı uzun pozisyonlarda hızlı bir artışa işaret ediyor ve bu da kısa vadeli bir düzeltme riskini artırıyor. Özellikle açık faizdeki ivmelenme, mevcut yükselişin bir kısmının spekülatif pozisyonlardan kaynaklanabileceğini düşündürmekte ve likidasyon dalgalarının tetiklenmesi olasılığını artırmaktadır.
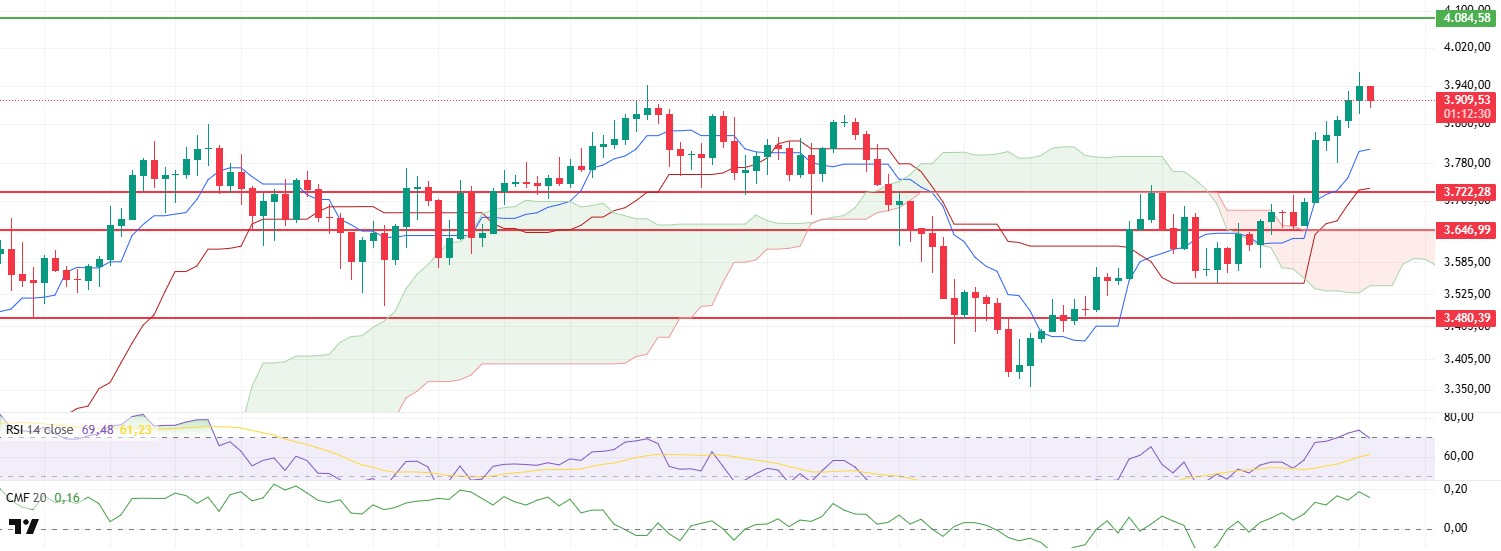
Teknik göstergeler tarafında, Göreceli Güç Endeksi (RSI) güçlü fiyat hareketiyle birlikte aşırı alım bölgesine geçti ve burada doygunluğa ulaşarak hafif bir geri çekilme eğilimine girdi. Bu görünüm, momentumu zayıflatabilecek ve fiyatlar üzerinde kısa vadeli baskı oluşturabilecek teknik bir uyarı görevi görüyor. Ancak Chaikin Para Akışı (CMF) göstergesinin pozitif bölgede yukarı yönlü eğilimini sürdürmesi, piyasalara net sermaye girişlerinin devam ettiğini ve alıcıların güçlü pozisyonda kaldığını teyit ediyor.
Ichimoku göstergesi incelendiğinde, fiyatın kumo bulutu seviyesini yeniden kazanması ve bulutun yeşile dönerek yukarı doğru genişlemesi, piyasanın orta vadeli teknik görünümünün olumlu yapısını pekiştiren önemli bir sinyaldir. Bu yapı, fiyatın ana trendde hala yukarı yönlü seyrettiği ve geri çekilmelerin şimdilik düzeltici nitelikte kalacağı görüşünü destekliyor.
Genel olarak zincir üstü verilerdeki aşırı ısınma işaretleri ve RSI'daki doygunluk seviyeleri nedeniyle kısa vadede gün içinde hafif düzeltme hareketleri beklenebilir. Bu senaryoda ilk ara destek olarak 3.806$ seviyesindeki tenkan çizgisi, ana destek olarak ise 3.722$ seviyesi izlenebilir. Bu seviyelerden gelecek herhangi bir toparlanma, yükseliş eğiliminin sağlıklı bir şekilde devam etmesine zemin hazırlayabilir. Öte yandan, 4.084$ seviyesinin yüksek hacimle aşılması piyasa katılımcılarının risk iştahını artırarak daha hızlı ve geniş bir yukarı yönlü dalgayı tetikleyebilir. Böyle bir senaryoda likidite akışının ve açık pozisyon artışlarının devam etmesi halinde 4,381 doların üzerindeki hedeflerin gündeme gelme ihtimali güçlenecektir.
Formun Üstü
Formun Altında
Destek seviyeleri: 3,722 - 3,646 - 3,480
Direnç seviyeleri: 4,084 - 4,381 - 4,857
XRP/USDT
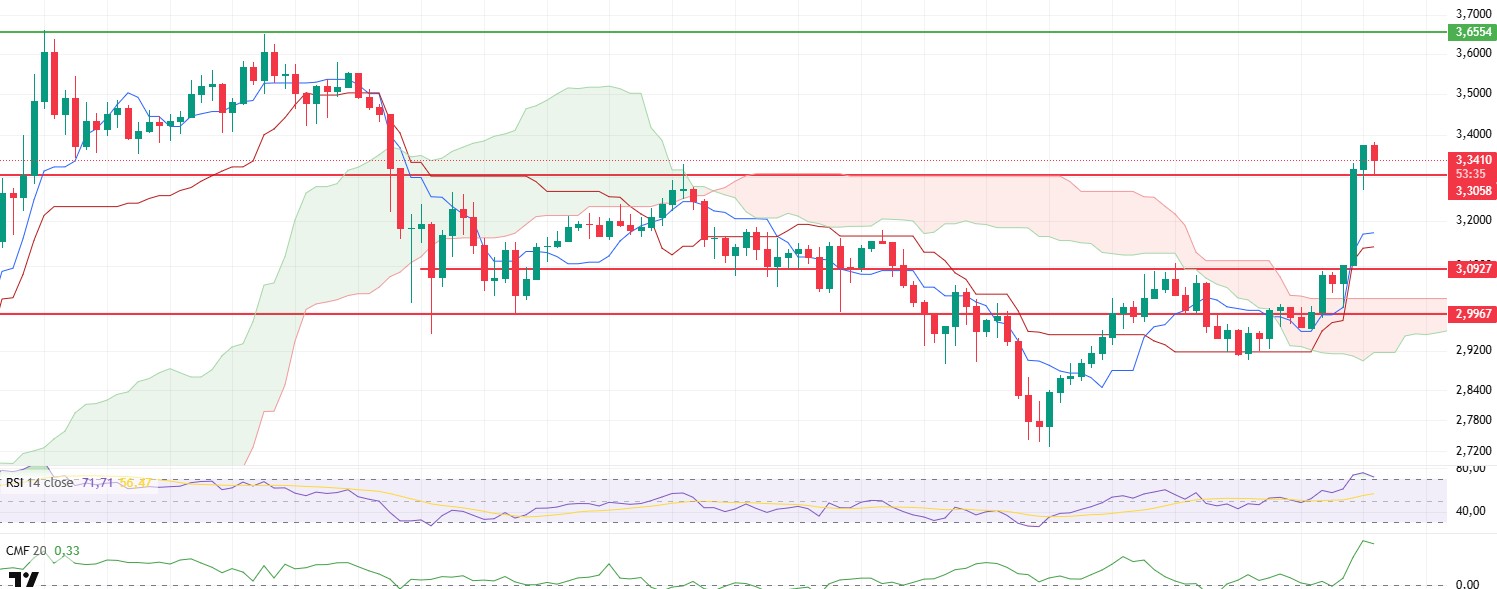
SEC ile Ripple arasında yaklaşık beş yıldır devam eden hukuki süreç, tarafların ortak red talebinin kabul edilmesiyle resmen sona erdi ve piyasada önemli bir dönüm noktası yarattı. Bu gelişme, hem belirsizliğin ortadan kalkması hem de XRP için düzenleyici risk algısının azalması açısından yatırımcı güvenini önemli ölçüde artırdı. Haber akışının yarattığı güçlü pozitif katalizör etkisi, XRP'nin yüksek trading hacmiyle kritik direnç seviyesi olan 3,09 doları aşmasını sağladı ve fiyat hızla 3,38 dolara yükseldi. Kâr alımlarının ardından fiyat 3,30$ destek bölgesi civarında dengelendi.
Teknik göstergeler genel olarak olumlu eğilimlerini sürdürüyor. Ichimoku göstergesi, fiyatın kumo bulutunun üzerine çıktığını ve bulut renginin yeşile dönerek genişlemeye başladığını göstererek piyasanın orta vadeli teknik görünümü açısından olumlu bir trende döndüğünü teyit ediyor. Bu yapı, kısa vadeli geri çekilmelere rağmen fiyatın yukarı yönlü kalması olasılığını artırıyor.
Chaikin Para Akışı (CMF) göstergesindeki keskin yukarı yönlü ivme, piyasa katılımcılarının alım iştahının güçlendiğini ve likidite girişlerinin yoğunlaştığını göstermektedir. Bu durum, yukarı yönlü hareketin sadece fiyat kaynaklı olmadığını, aynı zamanda güçlü sermaye girişleriyle de desteklendiğini ortaya koymaktadır.
Göreceli Güç Endeksi (RSI) göstergesi yukarı yönlü ivme nedeniyle aşırı alım bölgesine yükseldi, ardından hafif bir geri çekilme göstermeye başladı. Bu durum, kısa vadeli teknik perspektiften bakıldığında, fiyatın bir nefes alması gerekebileceğini ve küçük düzeltici hareketlerin devreye girebileceğini gösteriyor. Ancak, RSI yüksek bölgede kaldığı için, alıcıların genel hakimiyeti sürdürmeye devam ettiği söylenebilir.
Gün içi fiyat hareketleri açısından bakıldığında, 3,30$ seviyesinin korunması kritik önem taşıyor. Bu destek seviyesi kırılırsa, tenkan çizgisine 3,17 dolardan geri çekilme olasılığı vardır. Öte yandan, fiyat 3,30 dolar seviyesinin üzerinde kalırsa, kısa vadeli yatay bir konsolidasyon aşamasına girebilir ve yeni bir yükseliş dalgası için zemin hazırlayabilir. Ayrıca, 3,38 dolar seviyesinin üzerinde önemli bir kırılma, 3,65 dolar ve üzeri hedeflerin önünü açabilir.
Destekler: 3.3058 - 3.0927 - 2.9967
Dirençler: 3.6554 - 4.0055 - 4.4022
SOL/USDT
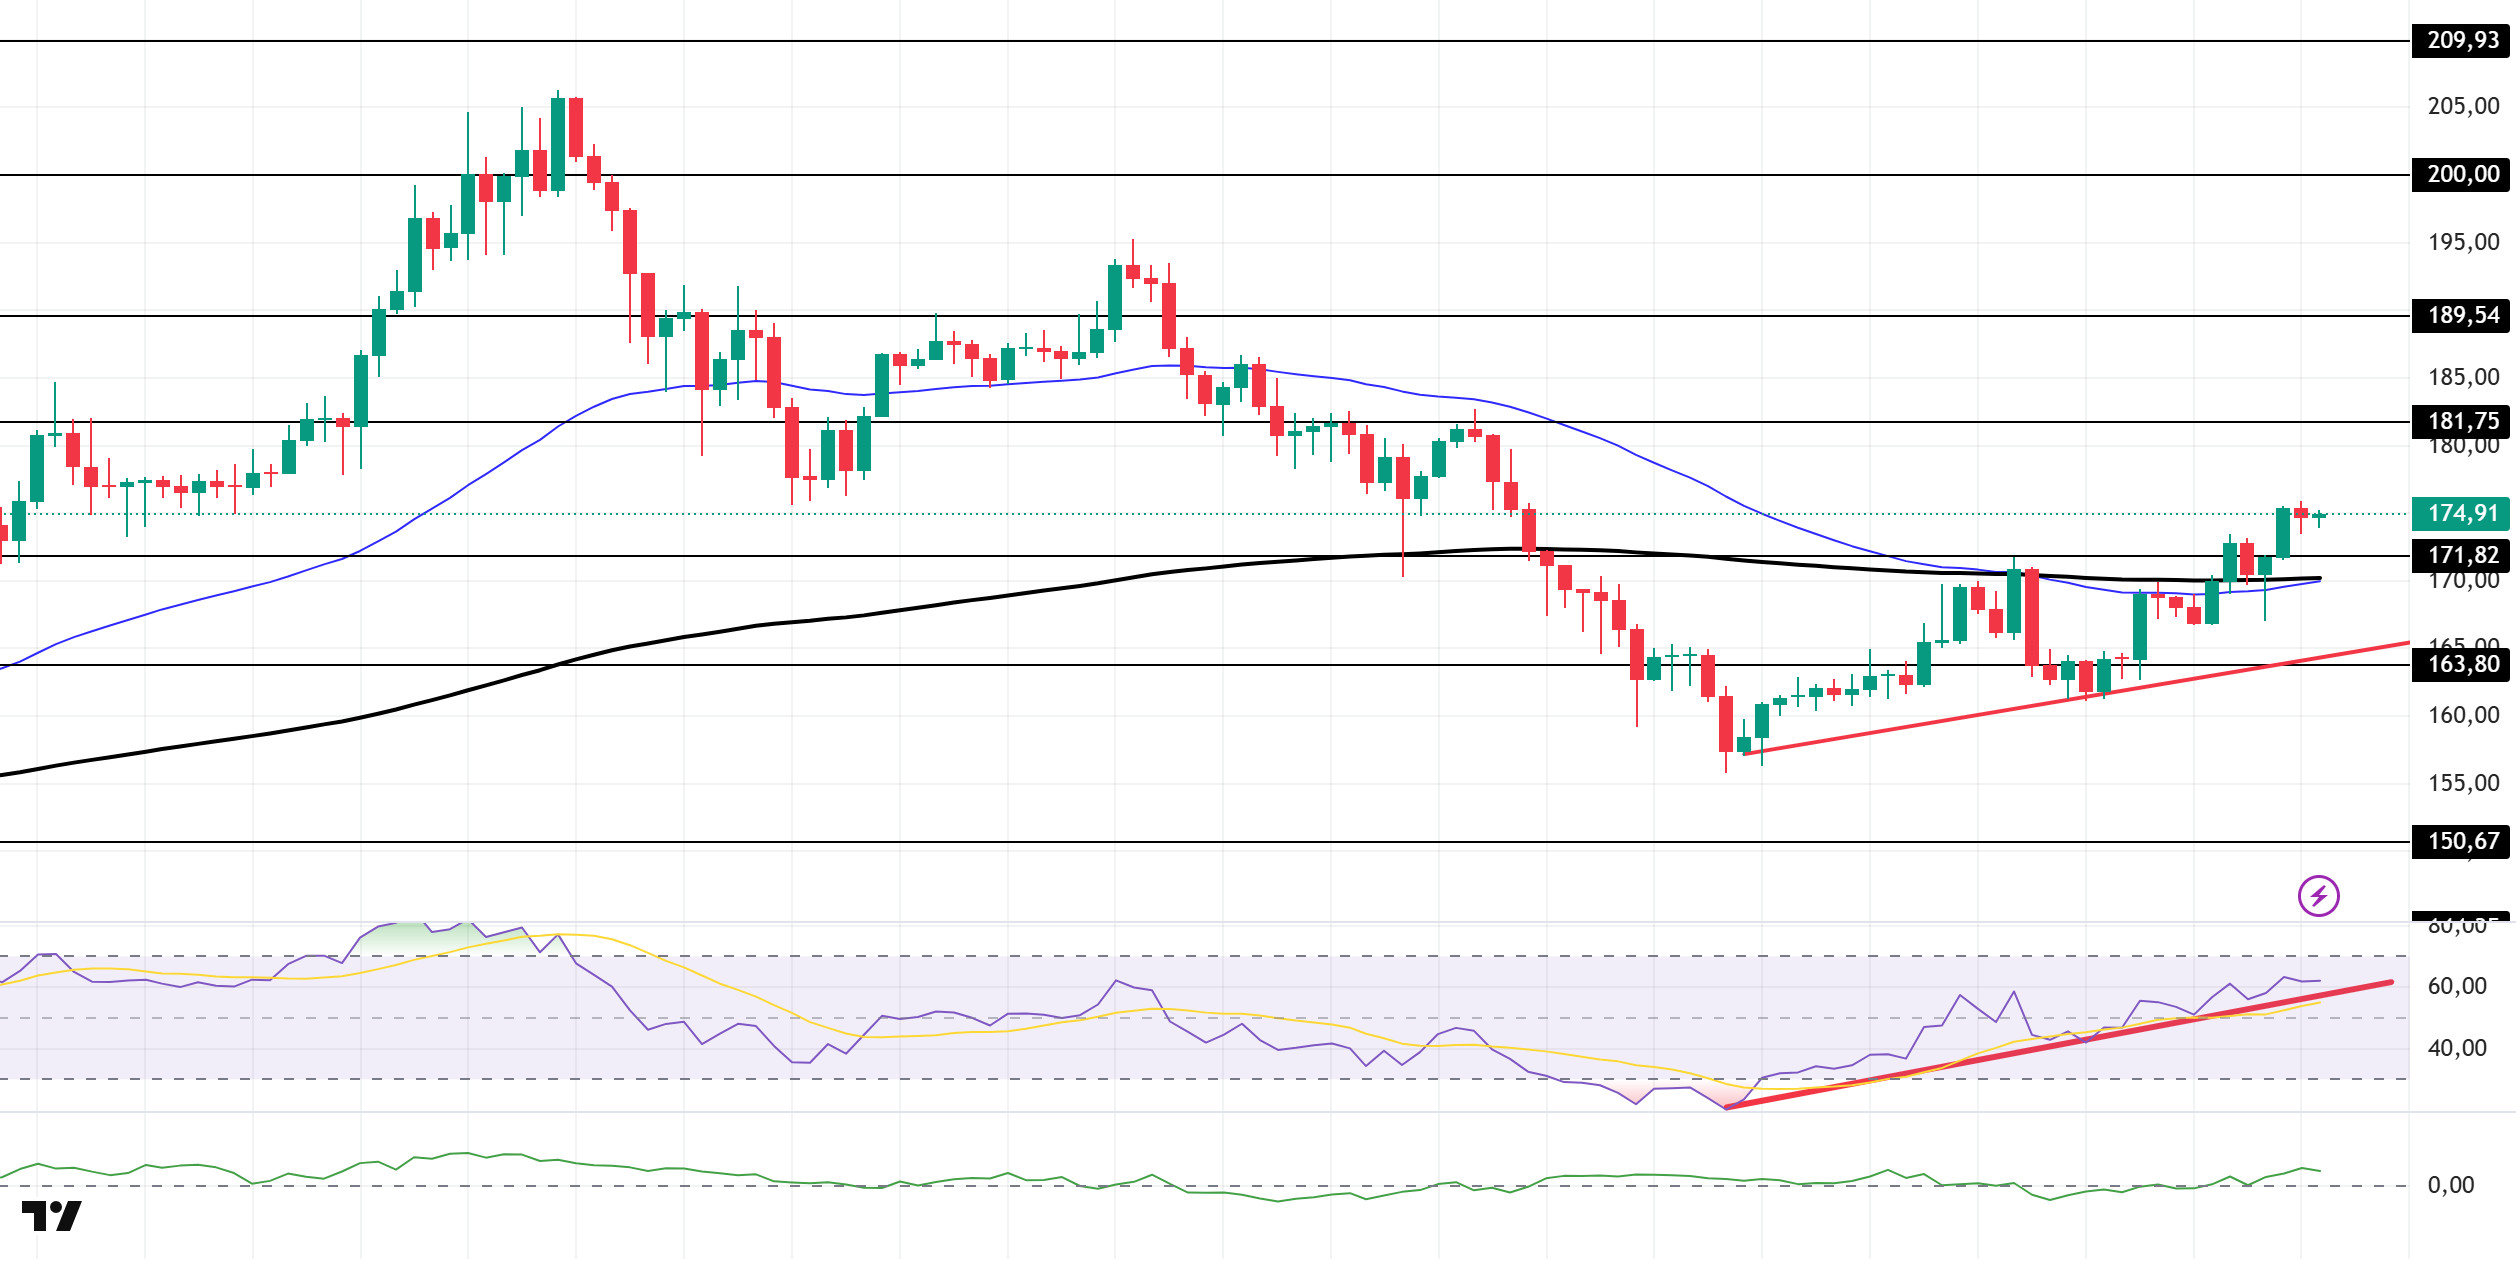
SOL fiyatı yükseliş eğiliminde. Varlık, 2 Ağustos'ta başlayan yükseliş trend çizgisinin üzerinde kaldı. 171,82 $ 'lık güçlü direnç seviyesini aşan fiyat, yükseliş eğilimi devam ederse 181,75 $ seviyesini test edebilir. Tersi durumda, yükseliş eğilimi destek olarak hareket edebilir.
4 saatlik grafikte, 50 EMA (Mavi Çizgi) 200 EMA'nın (Siyah Çizgi) altında kalmaktadır. Bu, düşüş eğiliminin orta vadede devam edebileceğini gösterir. Aynı zamanda, fiyatın her iki hareketli ortalamanın da üzerinde olması, piyasanın şu anda yükseliş eğiliminde olduğunu gösteriyor. Chaikin Para Akışı (CMF-20) pozitif bir seviyede. Ancak, para girişlerindeki bir azalma CMF'yi negatif bölgeye itebilir. Göreceli Güç Endeksi (RSI-14) 2 Ağustos'ta başlayan yükseliş trendinin üzerinde kalmaya devam ediyor. Bu durum alım baskısı olabileceğine işaret ediyor. Makroekonomik veriler veya Solana ekosistemiyle ilgili olumlu haberler nedeniyle yukarı yönlü bir hareket olması durumunda 181,75$ seviyesi güçlü bir direnç noktası olarak ortaya çıkıyor. Bu seviyenin yukarı yönde kırılması halinde yukarı yönlü hareketin devam etmesi bekleniyor. Ters yönde gelişmelerin yaşanması ya da kar alımları nedeniyle geri çekilmeler 163,80 dolar seviyesini test edebilir. Bu destek seviyelerine doğru bir gerileme, alım momentumunda bir artış görerek yukarı yönlü bir hareket için potansiyel bir fırsat sunabilir.
Destek seviyeleri: 171,82 - 163,80 - 150,67
Direnç seviyeleri: 181,75 - 189,54 - 200,00
DOGE/USDT
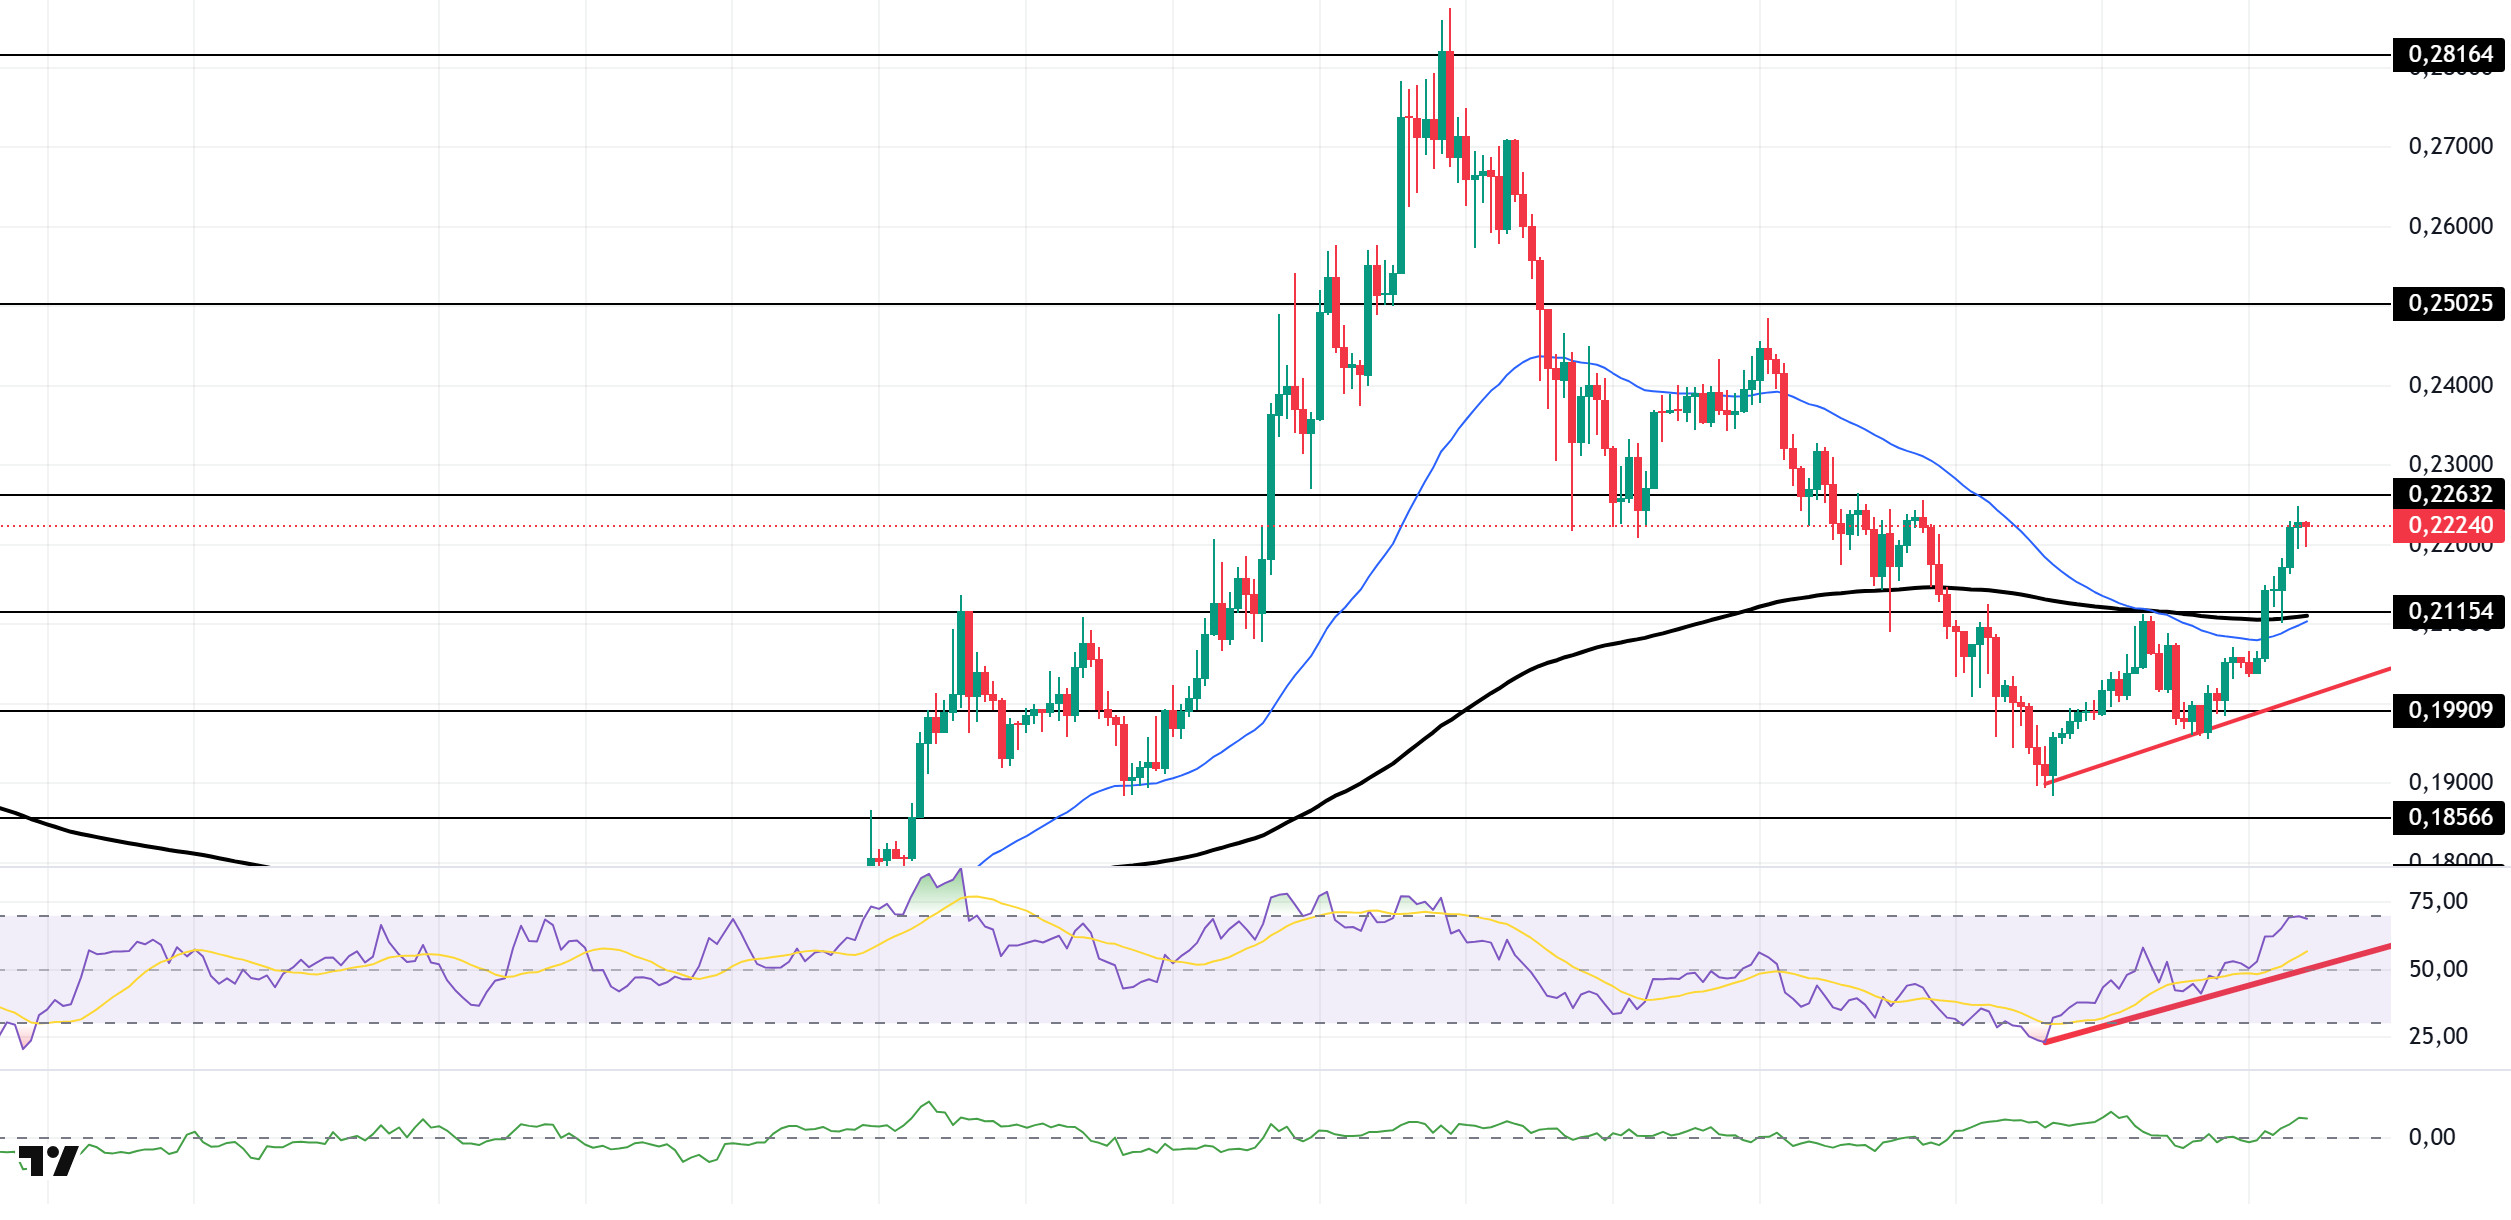
DOGE fiyatı yükseliş eğilimini sürdürdü. Varlık, 2 Ağustos'ta başlayan yükseliş trendinin üzerinde kaldı ve yukarı yönlü hareketini sürdürdü. Aynı zamanda, fiyat 50 EMA (Mavi Çizgi) ve 200 EMA (Siyah Çizgi) hareketli ortalamalarının üzerine çıktı ve 0,21154 dolarlık güçlü direnç seviyesini de aştı. Yükseliş eğiliminin devam etmesi halinde 0,22632 dolardaki güçlü direnç seviyesi izlenmelidir.
4 saatlik grafikte, 50 EMA (Mavi Çizgi) 200 EMA'nın (Siyah Çizgi) altında kaldı. Bu, varlığın orta vadede düşüş eğiliminde olduğunu gösterir. Her iki hareketli ortalamanın üzerinde bir hareket, varlık için kısa vadeli bir yükseliş eğilimine işaret edecektir. Chaikin Para Akışı (CMF-20) pozitif bölgeye geçti. Ek olarak, negatif nakit girişleri CMF'yi negatif bölgeye itebilir. Göreceli Güç Endeksi (RSI-14) pozitif bölgede kalmaya devam ediyor. Aynı zamanda, 2 Ağustos'ta başlayan yükseliş trendinin üzerindeki gösterge alım baskısının devam ettiğine işaret ediyor. Ancak, aşırı alım bölgesindeki konumu kâr alımlarını tetikleyebilir. Siyasi gelişmeler, makroekonomik veriler ya da DOGE ekosistemindeki olumlu haber akışından kaynaklanan yukarı yönlü hareketler durumunda, 0,22632$ seviyesi güçlü bir direnç bölgesi olarak ortaya çıkıyor. Tersi senaryoda ya da olumsuz haber akışı durumunda ise 0,21154 dolar seviyesi tetiklenebilir. Bu seviyelere doğru bir düşüş momentumu artırabilir ve potansiyel olarak yeni bir yükseliş dalgası başlatabilir.
Destek seviyeleri: 0,21154 - 0,19909 - 0,18566
Dirençler: 0.22632 - 0.25025 - 0.28164
Yasal Uyarı
Burada yer alan yatırım bilgi, yorum ve tavsiyeleri yatırım danışmanlığı kapsamında değildir. Yatırım danışmanlığı hizmetleri, kişilerin risk ve getiri tercihleri dikkate alınarak yetkili kuruluşlar tarafından bireysel olarak verilmektedir. Burada yer alan yorum ve tavsiyeler genel niteliktedir. Bu tavsiyeler mali durumunuz ile risk ve getiri tercihlerinize uygun olmayabilir. Bu nedenle, sadece burada yer alan bilgilere dayanarak yatırım kararı vermeniz beklentileriniz doğrultusunda sonuç vermeyebilir.

