
Technical Analysis
BTC/USDT
October ADP employment in the US rose by 42,000, reaching a 15-month high and surprising the markets; the dollar index strengthened while bond yields fell slightly. Expectations for a December interest rate cut rose to 70.1%. President Donald Trump said the government shutdown caused “temporary damage” to the markets but that the stock market was poised for new records. On the crypto mining front, CleanSpark produced 612 BTC and Riot Platforms produced 437 BTC, continuing their production growth. Japan’s Remixpoint increased its reserves to 1,411 BTC with an additional purchase of 29.46 BTC, while MetaPlanet raised $100 million in Bitcoin-backed funds.
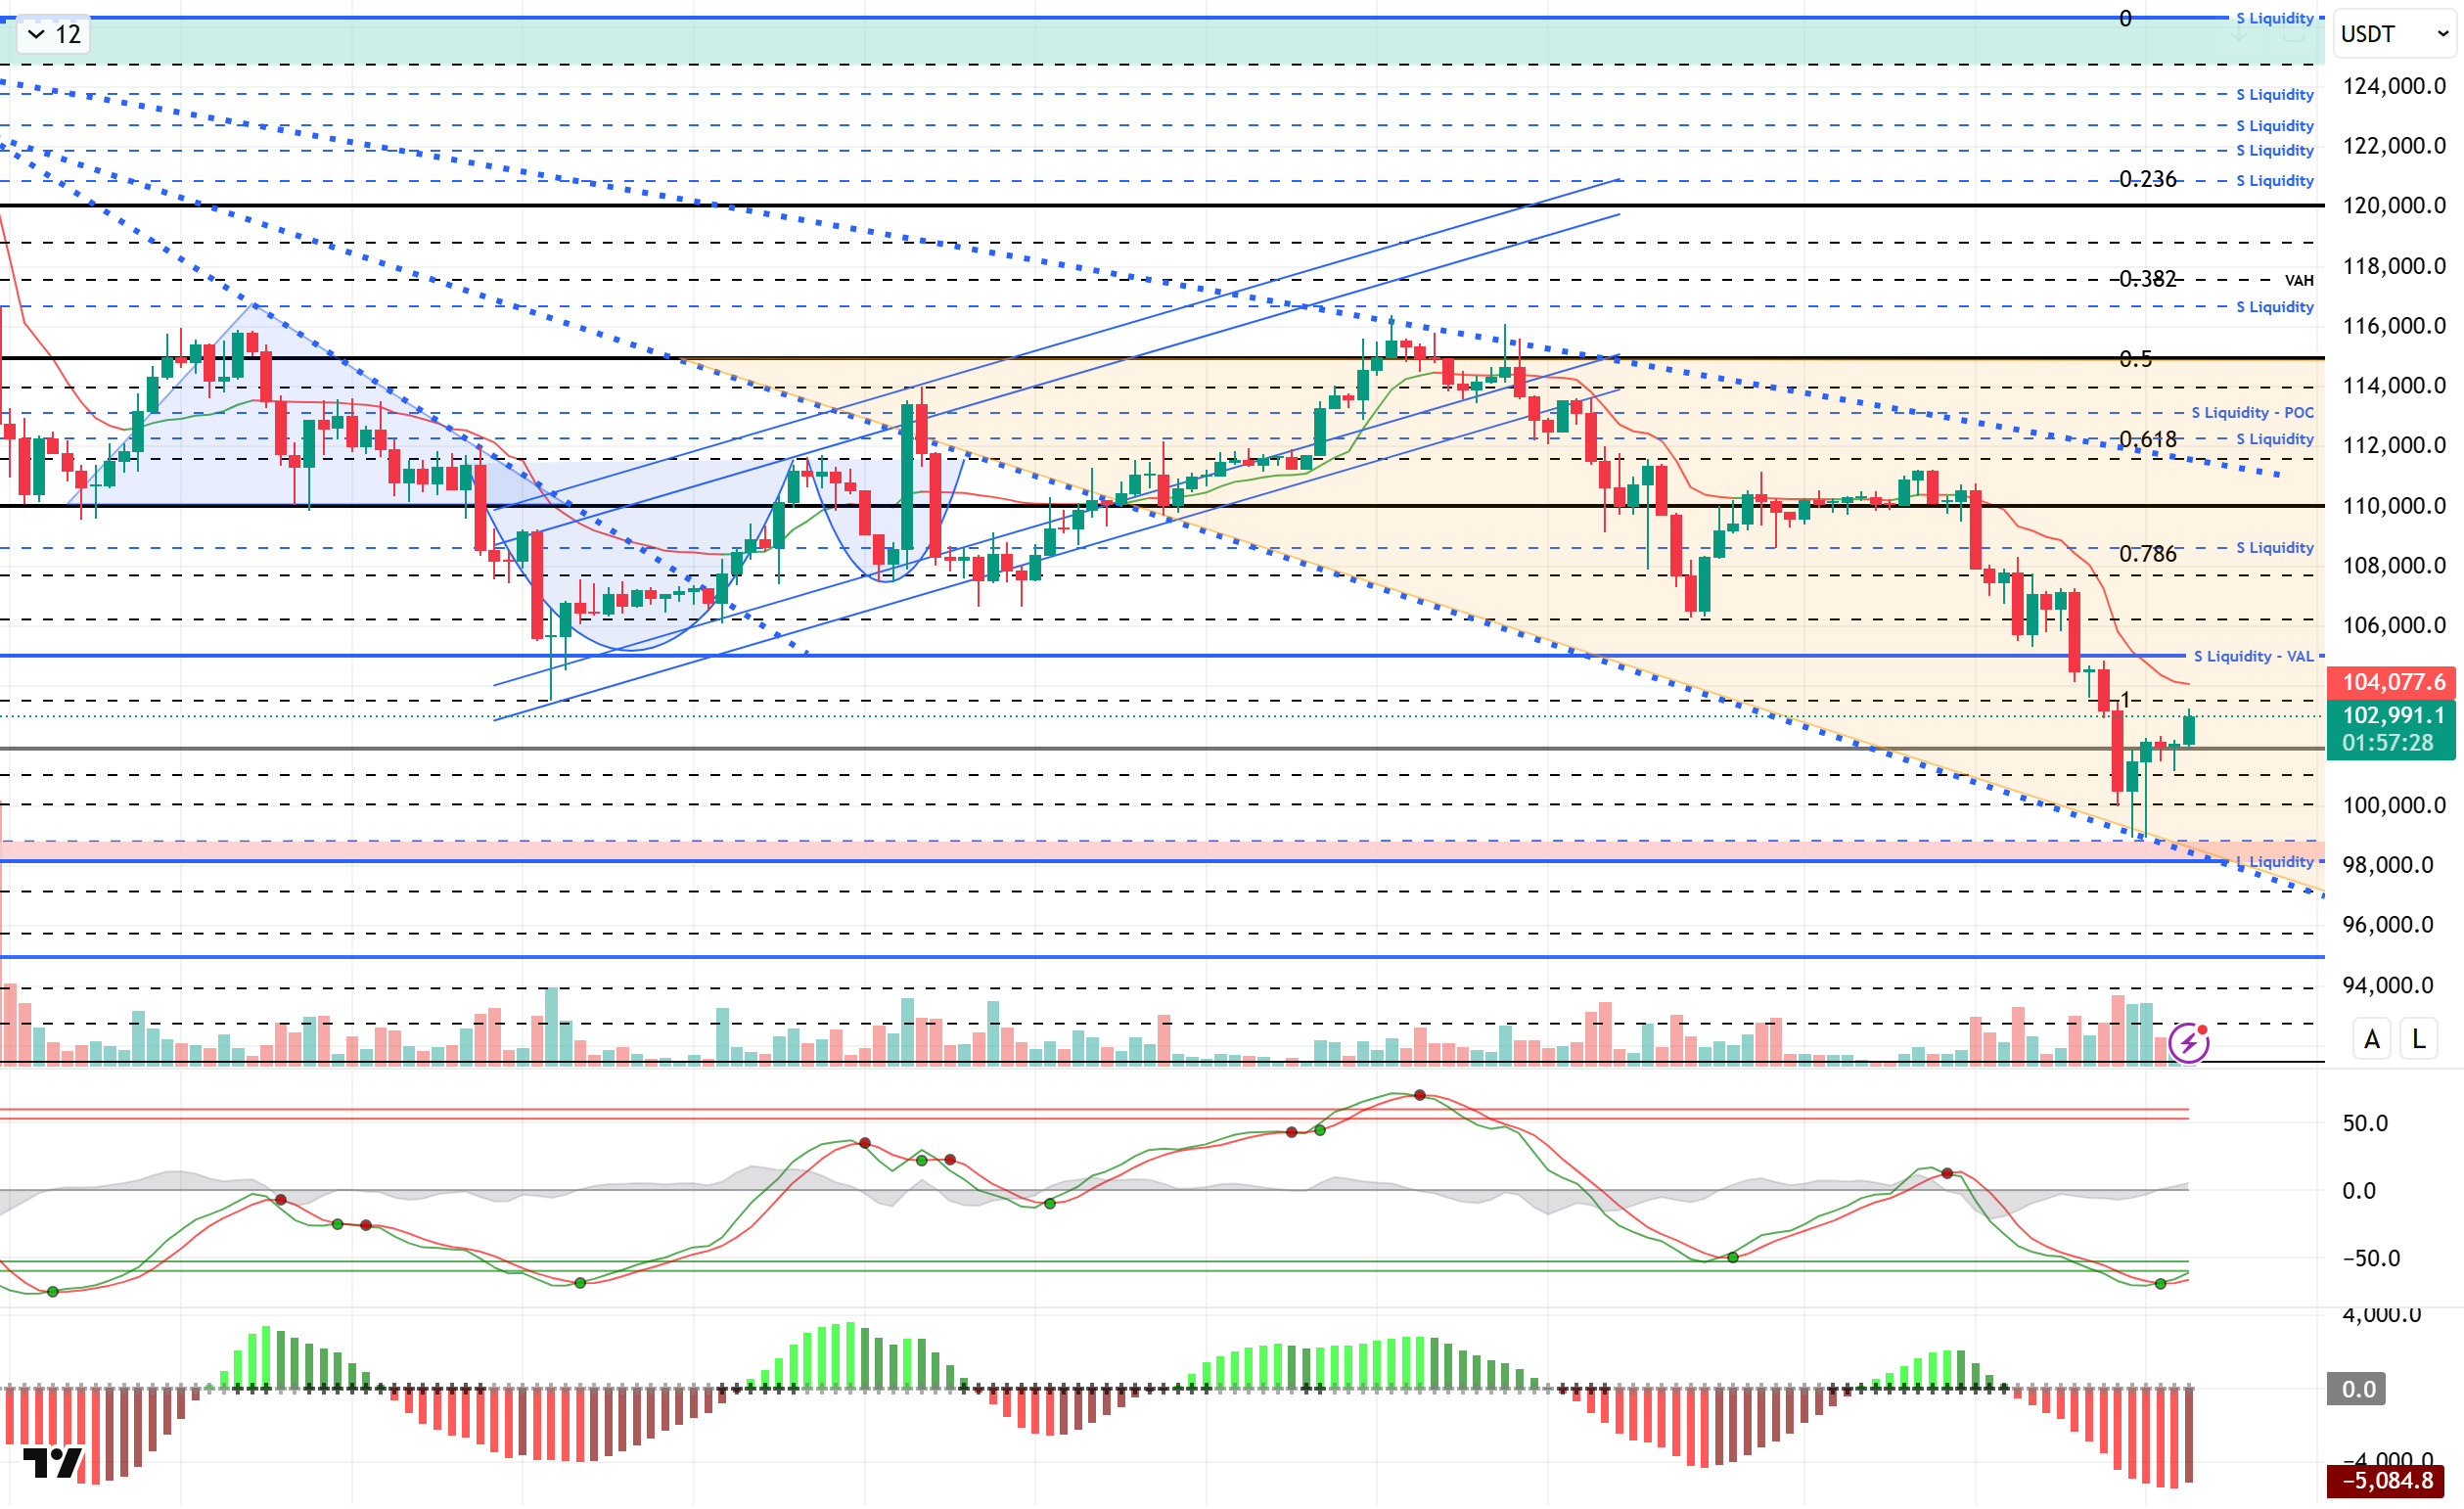
From a technical perspective, BTC continues its upward reaction after touching the lower line of the falling trend band. For the correction of the decline not to be a “dead cat bounce,” the price may need to regain the 105,000 reference zone. At the time of writing, the price, which exceeded the 103,000 level, continues to be priced within the falling structure.
Technical indicators show that Wave Trend (WT) has fallen below the oversold zone with the latest decline, signaling a buy. The Squeeze Momentum (SM) indicator’s histogram has reached maximum weakness in the negative zone. The Kaufman Moving Average (KAMA) is currently at $104,080, positioned above the price.
According to liquidation data, investors who seized the opportunity of the recent decline have recorded a concentration at the 98,000 level. On the other hand, while the first selling level at 102,500 resulted in liquidation, the 105,600 level is another area where accumulation has increased.
In summary, while the effects of the US-China tariff crisis being suspended for a year and resulting in a compromise continue, optimistic developments continue to emerge from both sides. However, the Fed’s hawkish tone on interest rate cuts continues to put pressure on the market, while the uncertainty caused by the US government shutdown persists. On the technical side, although BTC recorded short-term increases from time to time, it touched the lower trend line parallel to the descending trend channel it formed. In liquidity data, while the dominance of the selling side continues, buyers are beginning to reappear. In the coming period, 103,300 will be monitored as a resistance point, and if this level is gained, the 105,000 reference area and then the 105,600 liquidity zone can be monitored.In the event of a potential new selling pressure, 101,800 is the first support point, and if broken, we will follow the 100,000 reference area.
Supports: 101,800 – 100,000 – 99,000
Resistance Levels 103,300 – 105,000 – 106,600
ETH/USDT
Although the ETH price experienced a brief pullback following the release of ADP data during the day, it recovered as buying pressure regained strength and is currently trading at $3,370. This intraday movement indicates that the market is maintaining short-term buyer sentiment, but the overall trend remains weak.
The Chaikin Money Flow (CMF) indicator continues its positive momentum, reaching the zero line and signaling a recovery in market liquidity. The CMF holding at these levels could support continued buying pressure in the short term.
The Relative Strength Index (RSI) indicator also maintains its slight positive trend, as seen in the morning analysis. This gradual increase in momentum reveals that upward attempts are beginning to gain strength. However, for the RSI to sustain its upward movement, the price needs to advance with volume support.
According to the Ichimoku indicator, the price has risen to the Tenkan level and is attempting to break through this area. However, as the price remains below the kumo cloud, the overall technical outlook remains negative. This structure indicates that upward attempts may encounter resistance.
In the short term, the $3,436 level is an important threshold. If the price rises above this level, an upward movement to the $3,672 region may come into play. However, losing the $3,227 support could increase selling pressure again and cause the price to fall to the $3,020 level. Although the overall outlook remains weak, short-term rebound buying could continue to support the price for a while.
Supports: 3,227 – 3,020 – 2,872
Resistances: 3,436 – 3,672 – 3,816

XRP/USDT
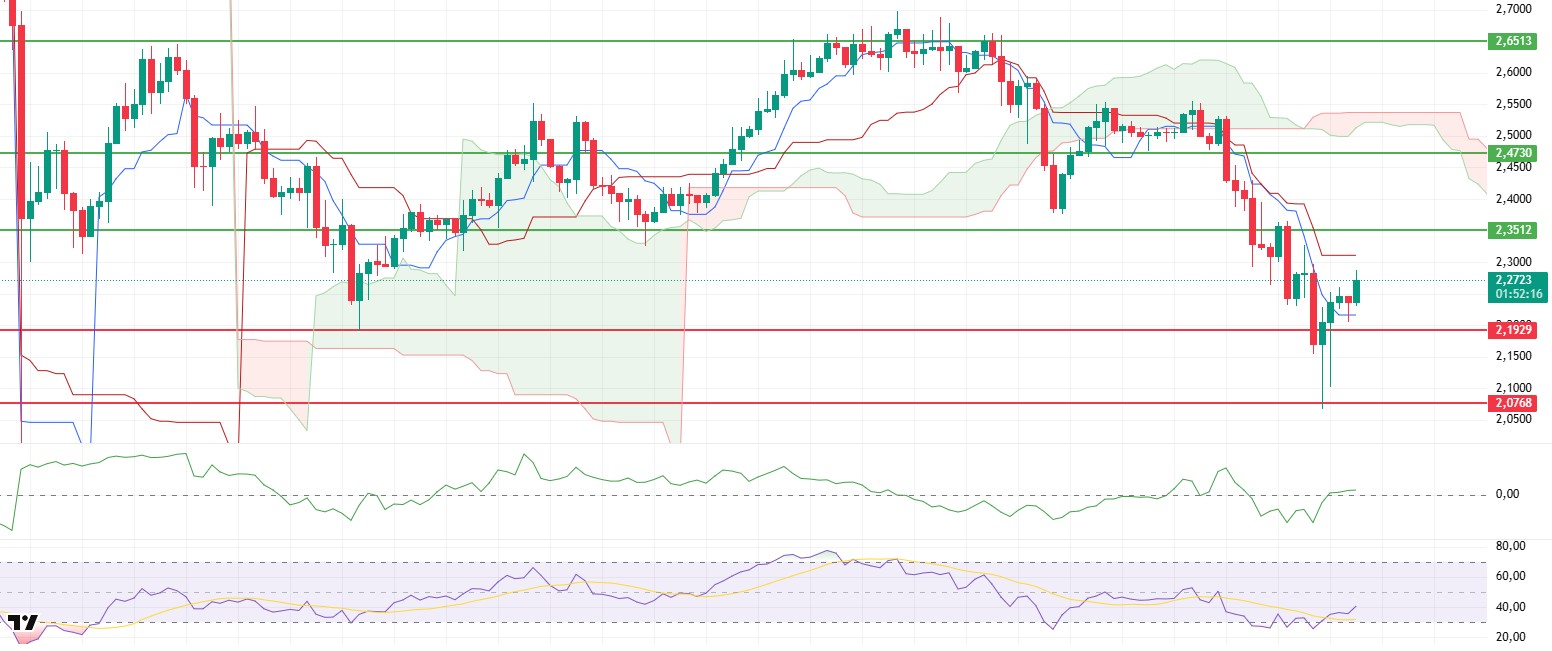
The XRP price rose to $2.28 during the day as buying continued but encountered selling pressure in this region and is currently trading around $2.26. This price movement during the day shows that buyers are still active, but the upward movement remains limited in the short term.
The Chaikin Money Flow (CMF) indicator continues to move in positive territory. This outlook indicates that liquidity inflows into the market are continuing and that the buying side remains strong. The Relative Strength Index (RSI) indicator also maintains its positive trend, signaling that momentum continues to recover in the short term.
According to the Ichimoku indicator, the price is trying to hold above the Tenkan level but is still below the kumo cloud. This structure indicates that despite short-term recovery efforts, the overall trend remains negative and rallies may face strong resistance.
In the short term, the $2.19 level continues to be a critical support. If the price stays above this level, it could support an upward movement towards the $2.30 and $2.35 resistance zones. However, if the $2.19 support is lost, selling pressure could increase again and cause the price to retreat towards the $2.07 level.
Supports: 2.1929 – 2.0768 – 1.9092
Resistances: 2.3512 – 2.4730 – 2.6513
SOL/USDT
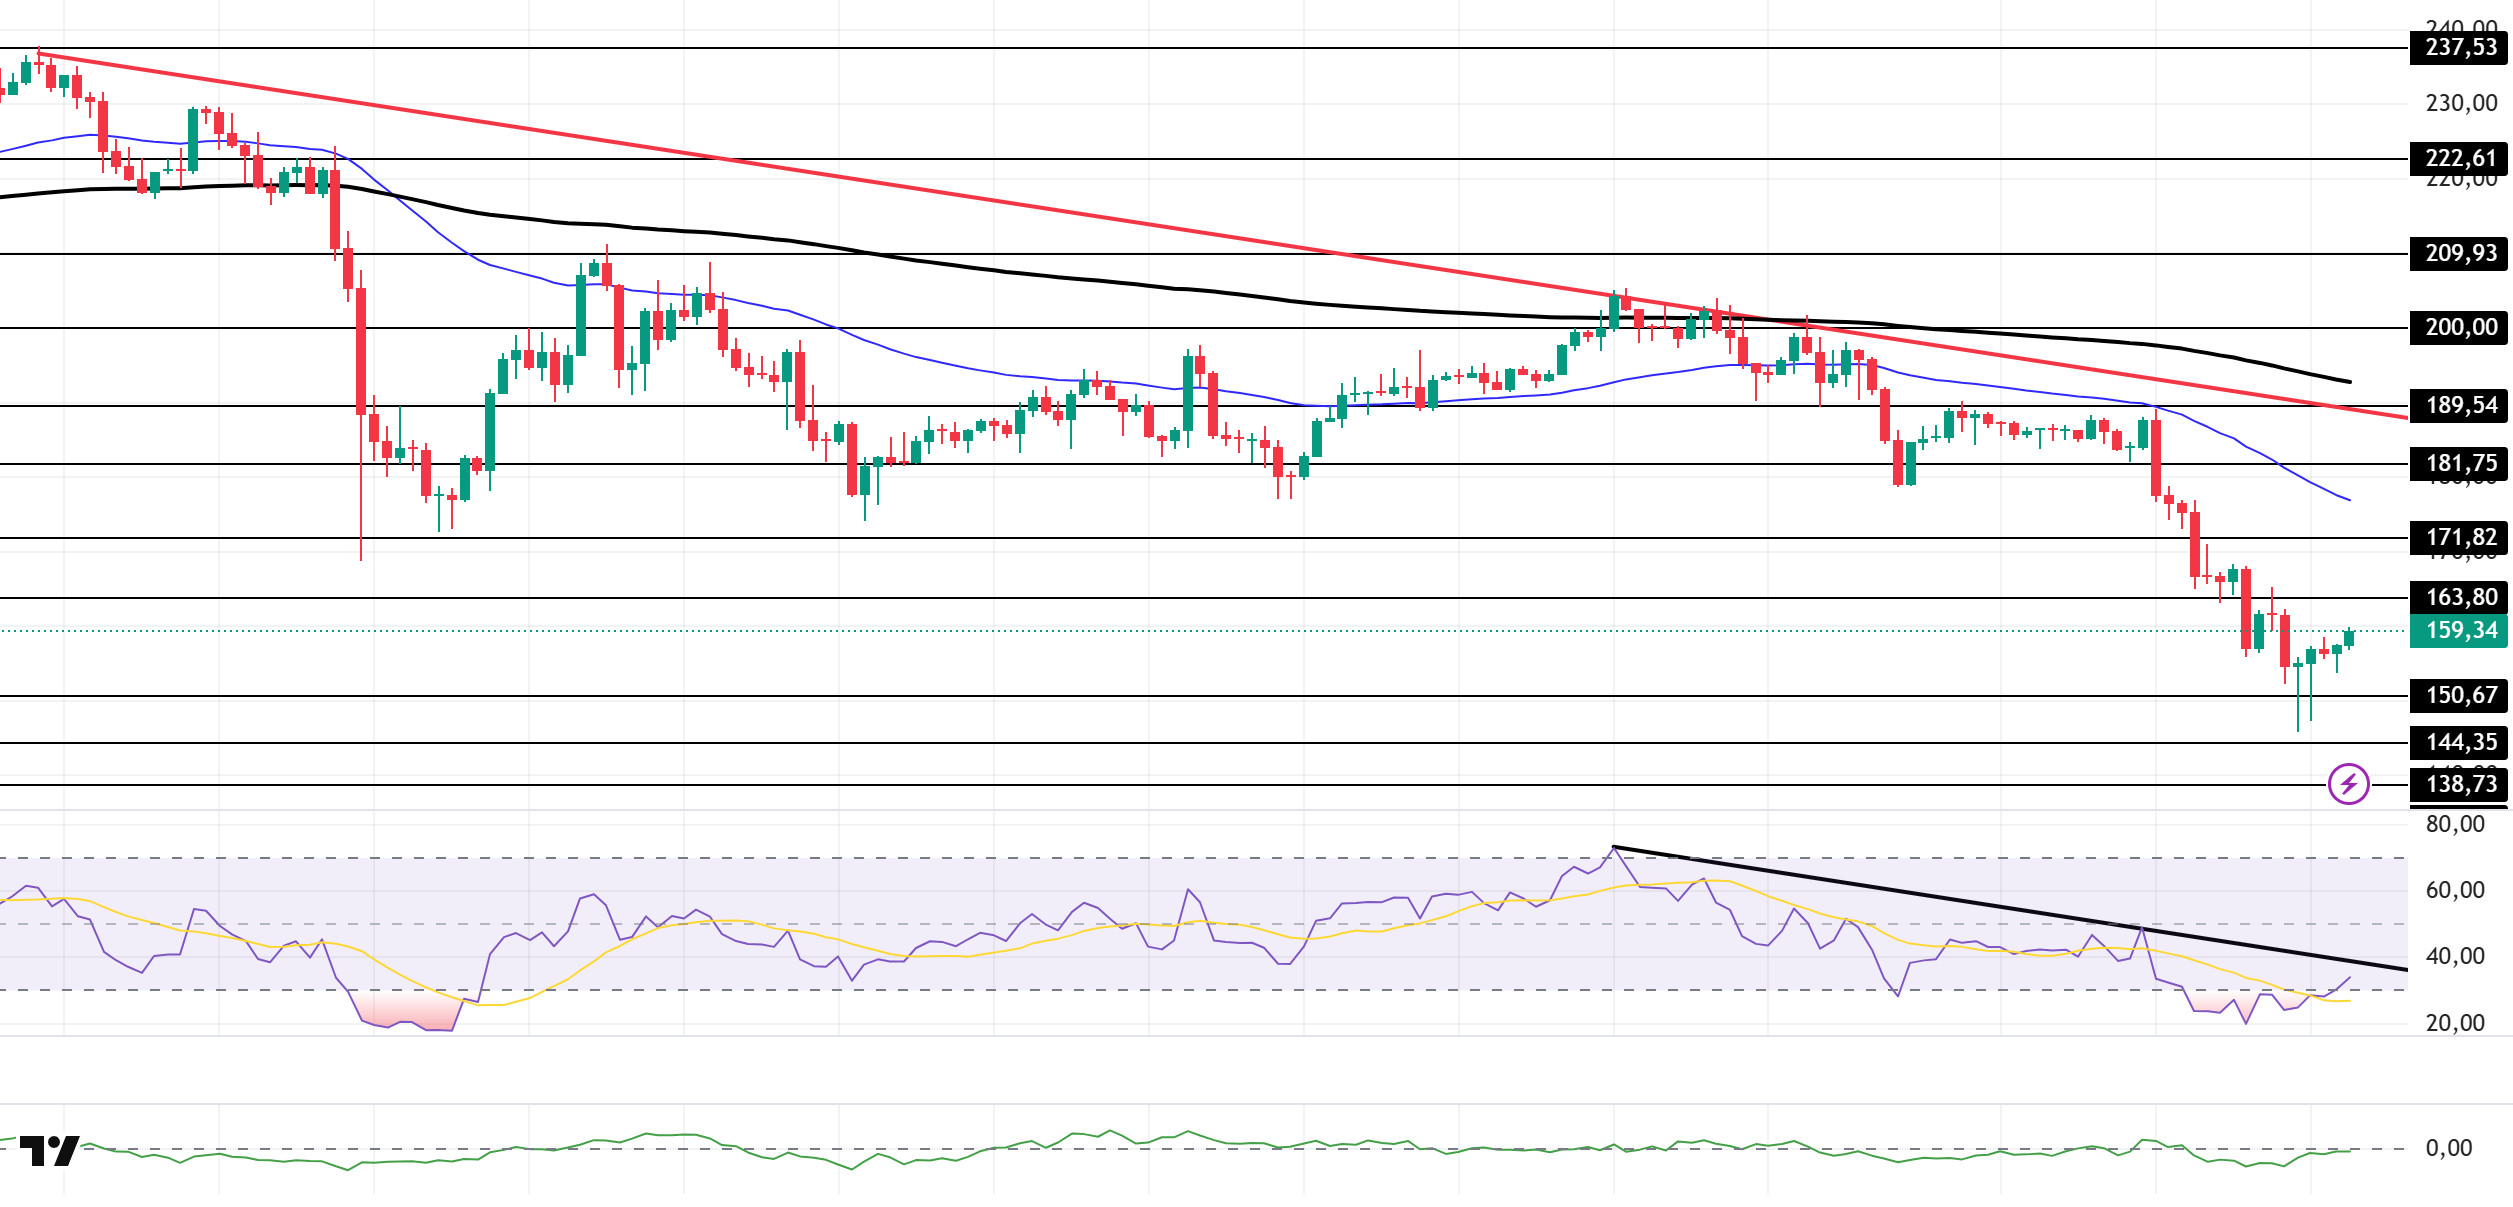
The SOL price traded sideways during the day. The asset tested the strong support level of $150.67 and experienced a slight increase, continuing to trade in the lower region of the downtrend that began on October 6. However, the price being far from the 50 EMA (Blue Line) and 200 EMA (Black Line) moving averages could strengthen the asset’s sideways or upward movement. If the rise begins, it could test the strong level of $163.80. If the pullback continues, it could test the $138.73 level.
The price remained below the 50 EMA (Exponential Moving Average – Blue Line) and 200 EMA (Black Line) on the 4-hour chart. This indicates a potential downtrend in the medium term. Additionally, the price being below both moving averages suggests a downward trend in the short term. The Chaikin Money Flow (CMF-20) is at a neutral level. However, an increase in money inflows could push the CMF into positive territory. The Relative Strength Index (RSI-14) continues to be in the oversold zone. It also remained below the downward trend that began on October 27. This signaled that selling pressure persists. In the event of an uptrend driven by macroeconomic data or positive news related to the Solana ecosystem, the $171.82 level stands out as a strong resistance point. If this level is broken upwards, the uptrend is expected to continue. In the event of pullbacks due to developments in the opposite direction or profit-taking, the $144.35 level could be tested. A decline to these support levels could increase buying momentum, presenting a potential opportunity for an upward move.
Supports: 150.67 – 144.35 – 138.73
Resistances: 163.80 – 171.82 – 181.75
DOGE/USDT
The DOGE price traded sideways during the day. The asset tested the downtrend that began on October 27 and the $0.18566 level as resistance and deepened its pullback. After testing the $0.15680 level as support and rising from there, the price is currently preparing to test the $0.16686 level. Momentum may increase with candle closes above this level. If the pullback begins, the $0.15680 level should be monitored again.
On the 4-hour chart, the 50 EMA (Exponential Moving Average – Blue Line) remained below the 200 EMA (Black Line). This indicates that a downtrend may begin in the medium term. The price being below both moving averages indicates a downward trend in the short term. The Chaikin Money Flow (CMF-20) has started to move into the positive zone, close to the neutral zone. Additionally, a decrease in cash inflows could push the CMF into negative territory. The Relative Strength Index (RSI-14) has risen to the middle of the negative zone. It is currently testing the downward trend that began on October 27. If it breaks through this level, the upward movement could continue. On the other hand, there is a positive divergence, which could increase buying pressure. In the event of an uptrend driven by political developments, macroeconomic data, or positive news flow in the DOGE ecosystem, the $0.17766 level stands out as a strong resistance zone. Conversely, in the event of negative news flow, the $0.15680 level could be triggered. A decline to these levels could increase momentum and initiate a new wave of growth.
Supports: $0.15680 – $0.14952 – $0.14237
Resistances: 0.16686 – 0.17766 – 0.18566

BNB/USDT
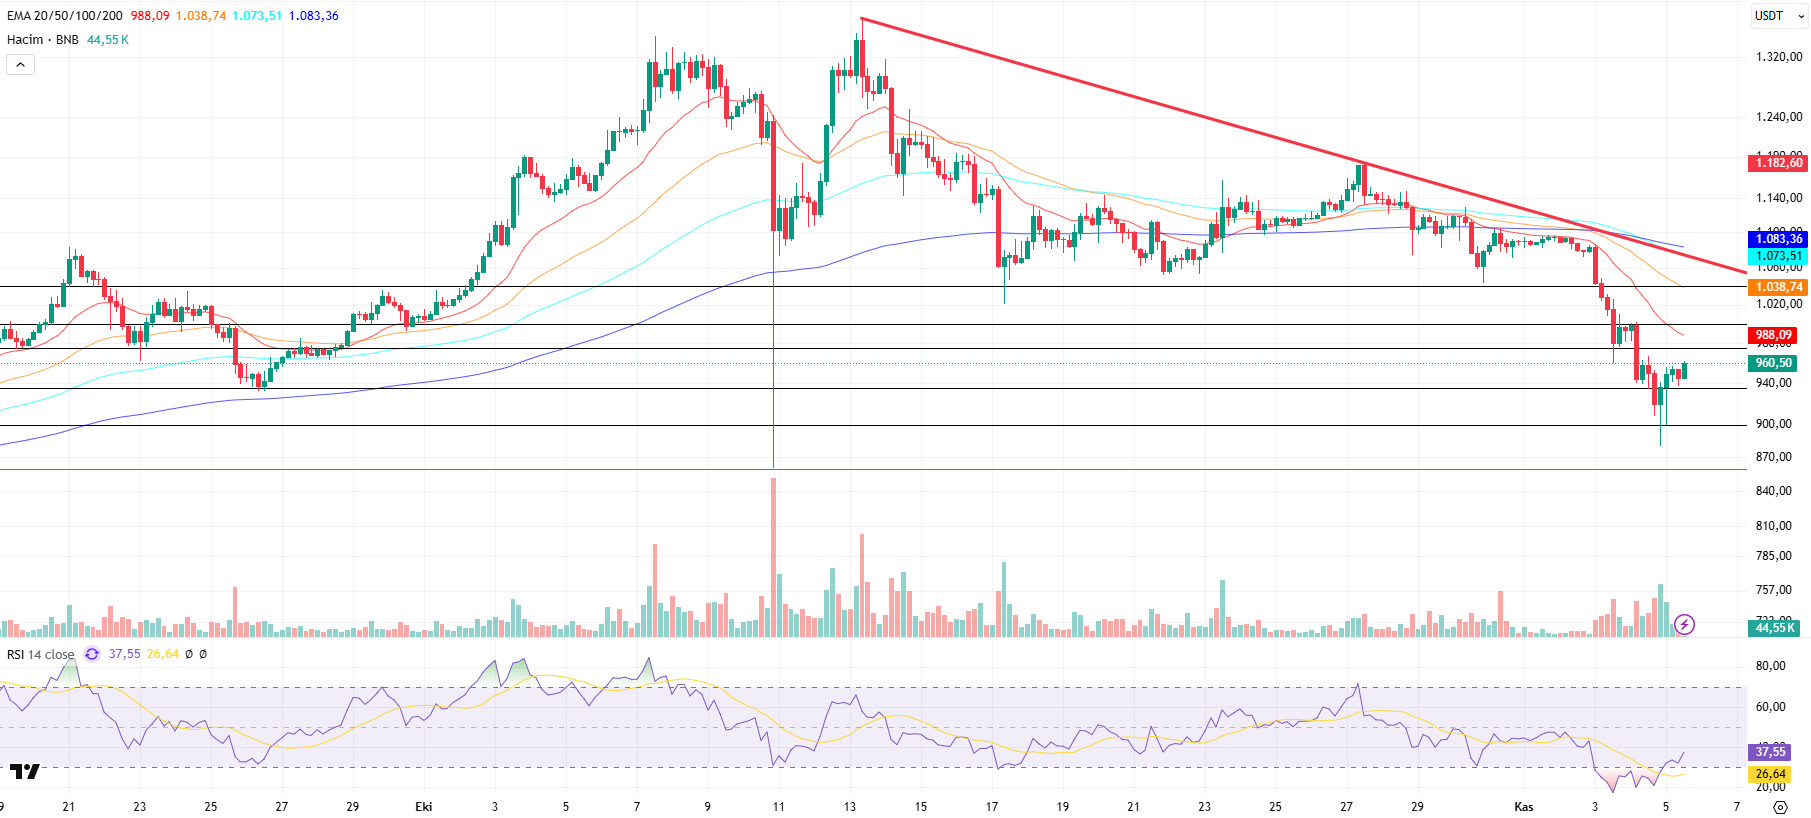
From a technical perspective, the correction that began after the all-time high (ATH) has regained momentum, resulting in a pullback to the $900 support zone identified in previous technical analyses. After testing support at this level for a while, the asset ended its downward momentum with the formation of new candles and reversed its direction upward.
Currently, the BNB/USDT pair has surpassed the $935 level and maintained its short-term positive outlook with support from this region.
Additionally, the positive momentum gained strength with today’s release of the US ADP data, which came in above expectations.
Technical indicators for the pair, currently trading in the $935–975 range, suggest that the increased trading volume during the recent rallies has supported the upward momentum. Furthermore, the Relative Strength Index (RSI) indicator fell below the 30 level for a while due to increased selling pressure. However, this situation ended with the effect of positive momentum, and the RSI rose above the 30 level again.
Based on the current technical picture, if buying appetite is maintained and market momentum recovers, BNB is expected to retest the $975 resistance level in the first stage. If this level is broken, it is technically possible for the price to rise towards the $1,000 and $1,040 levels, respectively. On the other hand, if selling pressure increases again, the price is expected to test the $935 support level. If this level is broken downwards, the price is likely to retreat to the $900 and $860 support zones, respectively.
Supports: 935 – 900 – 860
Resistances: 9 75– 1,000 – 1,040
ADA/USDT
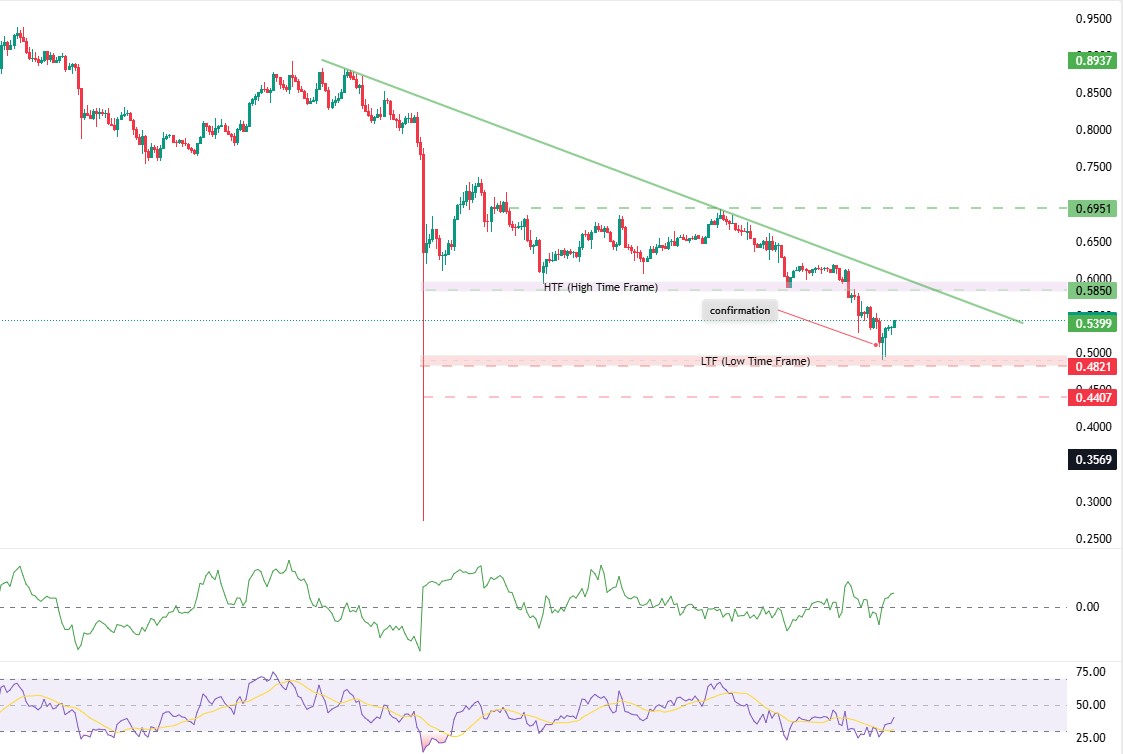
ADA rose to $0.5369 levels in the second half of the day, reacting for the first time to the US ADP Nonfarm Employment data. Yesterday, with Bitcoin falling below $100,000, ADA tested the lowest time frame (LTF) levels of $0.4900. It pulled back and rose to the weekly opening (WO) level (0.5271). Trump’s statements regarding the government shutdown and the narrowing volatility during the day may cause increased selling pressure. In this scenario, the price intersects with the confirmation zone at the entry point of the low time frame (LTF) at the $0.4821 level. This technically increases the importance of the zone. In a more severe correction scenario, the $0.4407 level can be monitored as the main support level. However, confirmation of this movement should be monitored in terms of volume and market structure.
The Relative Strength Index (RSI-14) has rebounded from the 40 levels and, together with the Chaikin Money Flow (CMF-20), has started to approach a buy signal. The increase in cash inflows may keep the CMF in positive territory and indicate that the selling pressure is coming to an end. With possible intraday gains, the price may again face the 0.5850 level, the high time frame (HTF) entry zone resistance point, which we will monitor as an important level. In this case, it may signal that the upward trend could continue in the medium term.
If there is an uptrend due to macroeconomic data or positive news related to the Cardano ecosystem, the $0.6951 level stands out as a strong resistance point. If this level is broken upwards, the uptrend is expected to continue.
Supports: 0.3896 – 0.4407 – 0.4821
Resistances: 0.5850 – 0.6951 – 0.7500
Legal Notice
The investment information, comments, and recommendations contained herein do not constitute investment advice. Investment advisory services are provided individually by authorized institutions taking into account the risk and return preferences of individuals. The comments and recommendations contained herein are of a general nature. These recommendations may not be suitable for your financial situation and risk and return preferences. Therefore, making an investment decision based solely on the information contained herein may not produce results in line with your expectations.


