
Technical Analysis
BTC/USDT
US President Donald Trump is evaluating 11 candidates to replace Fed Chairman Powell, whose term expires in May 2025. Among the candidates are David Zervos, Larry Lindsey, and Rick Rieder. US Treasury Secretary Scott Bessent stated that interest rates should be lowered by 150-175 basis points and that the first step could be a 50 basis point cut in September. Bessent also said that if things do not go well with the Trump-Putin meeting, new sanctions or secondary tariffs could be imposed. ETF expert Nate Geraci said that with the clarification of crypto regulations, a series of ETF approvals could come, which could increase liquidity and investor interest in the market.
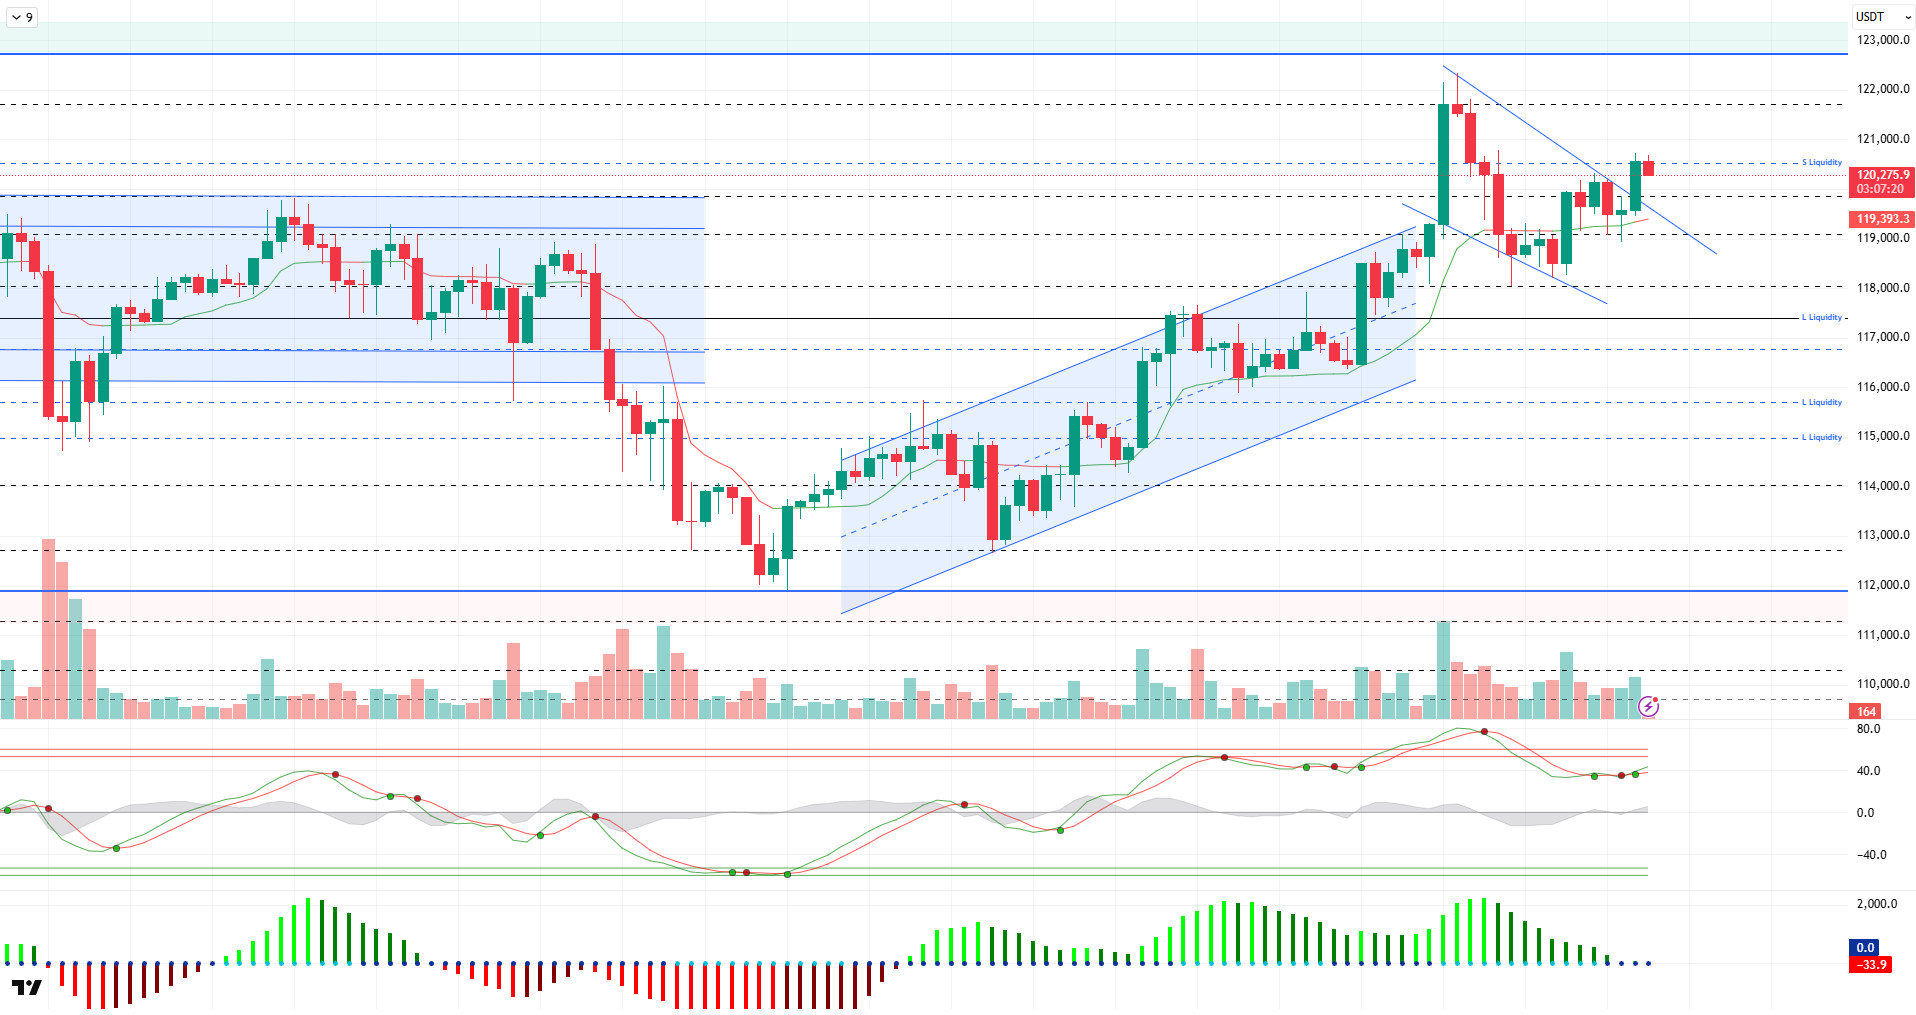
Looking at the technical picture, we see that BTC has regained momentum compared to the previous analysis, breaking the falling minor trend line and testing the 120,700 level. At the time of writing, it continues to trade slightly bearish at the 120,400 level.
Technical indicators show that the Wave Trend oscillator (WT) has shifted direction back upward after displaying an indecisive pattern in the overbought zone, while the Squeeze Momentum (SM) indicator shows a weakening of momentum, with the histogram continuing to hold in the positive zone. The Kaufman moving average is currently acting as support at the 119,400 level below the price.
Looking at liquidity data, short-term sell positions are accumulating at the 121,000 and 123,000 levels, while buy positions are showing increased activity at the 117,000 and 115,000 levels.
In summary, in the key developments section, calls for interest rate cuts continue alongside steps taken regarding tariffs. The technical structure shows an indecisive picture at the saturation point, while liquidity data shows that 115,000 remains an important accumulation zone, despite moving away from this zone. In the event of a new upward move, 120,000 emerges as a critical resistance area. Closures above this level could trigger a new momentum to push the ATH level higher. In the event of potential selling pressure, the 119,000 level will be monitored as a support area, with a break below this level targeting the 117,500 level, followed by the 115,000 liquidity and reference area.
Support levels: 119,000 – 117,500 – 115,000
Resistance levels: 121,500 – 123,000 – 125,000
ETH/USDT
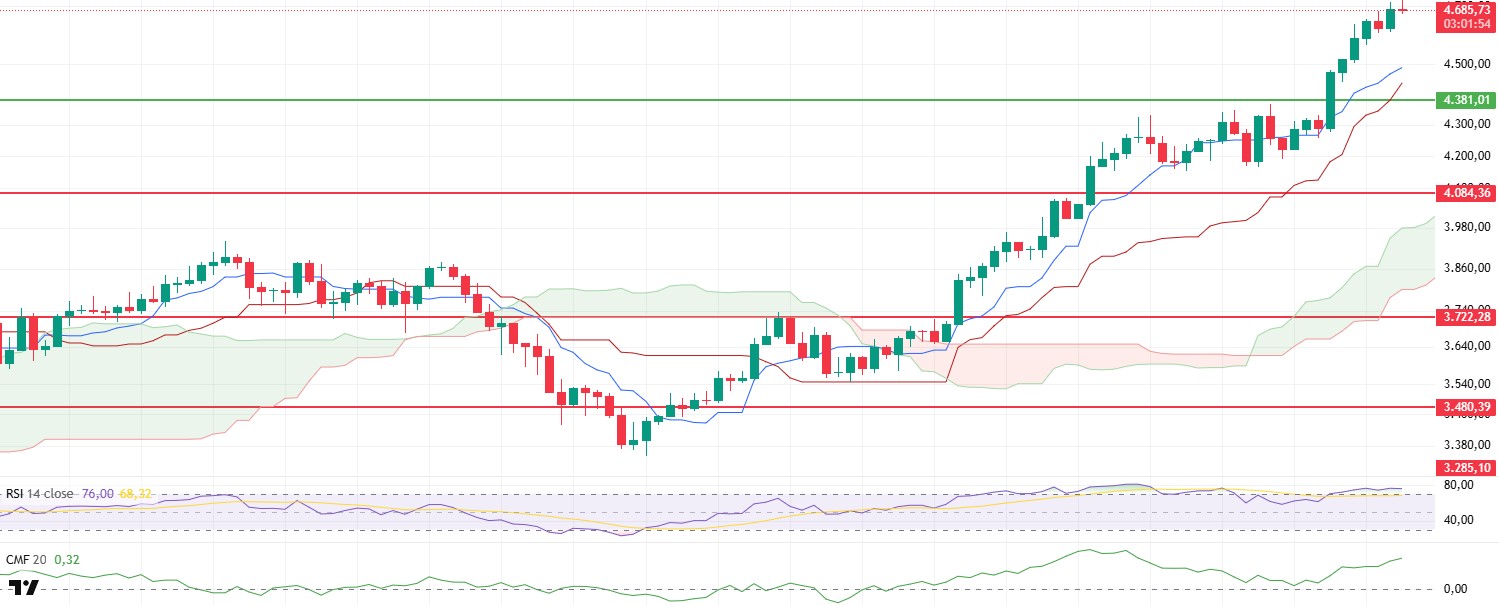
The price of ETH continued its upward trend throughout the day, reaching $4,700 thanks to strong buying pressure. Both technical indicators and on-chain data managed to maintain their positive momentum as the price approached this critical threshold. Notably, the open interest level reaching 33.6 billion dollars, one of the highest levels in recent periods, indicates a significant accumulation of positions in the futures market and a noticeable increase in investor risk appetite. This situation increases the likelihood of rising volatility in the market while also highlighting heightened sensitivity to sudden price movements.
The continued upward movement in Cumulative Volume Delta (CVD) data across both futures and spot markets confirms that the current uptrend is not solely driven by leveraged trading but is also fueled by strong buying demand in the spot market. This alignment indicates that the upward trend is progressing on a healthy foundation and that price movements are not merely the result of an artificial short squeeze or temporary liquidity wave. However, the funding rate remaining at high levels highlights that the cost of holding long positions continues to rise for investors and that the market still faces a significant risk of a correction due to excessive leverage.
The Chaikin Money Flow (CMF) indicator continues its upward trend in positive territory, confirming that liquidity entering the market remains at high levels. While such strong liquidity inflows contribute to maintaining the upward trend, it should not be forgotten that this situation could pave the way for sudden profit-taking in overheated market conditions.
The Relative Strength Index (RSI) is maintaining its horizontal movement in the overbought zone, indicating that momentum remains strong. However, the saturation at this level increases the likelihood of a short-term price correction.
The overall outlook indicates that the $4,600 level is emerging as a critical short-term support level. If this level is sustained, it may be possible to retest the all-time high. However, daily closes below $4,600 could trigger a sharp correction in the market due to technical indicators being in the overbought zone and increased open interest driven by high funding rates. Therefore, while the upside potential remains intact, risk management and stop-loss strategies are of critical importance in the current environment.
Support levels: 4,381 – 4,084 – 3,722
Resistance levels: 4,857 – 5,000 – 5,350
XRP/USDT
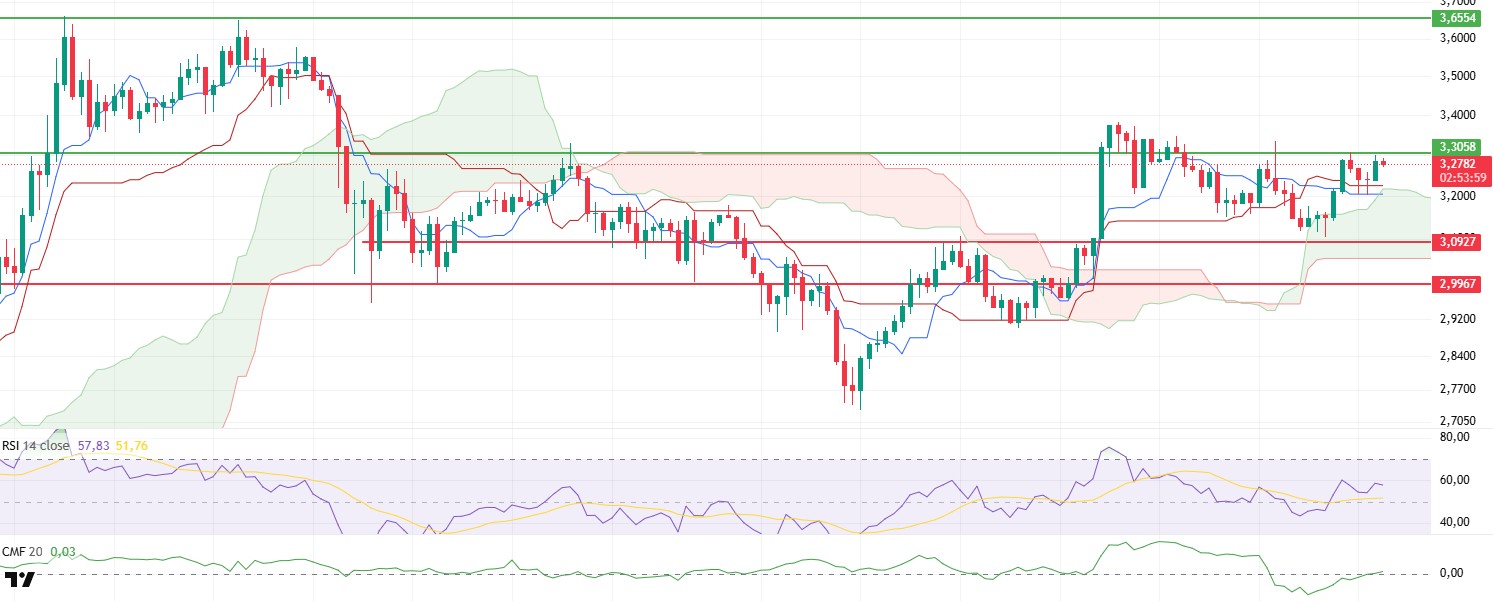
XRP reached the critical resistance level of $3.30 as predicted during the day. This level stands out as an important threshold in terms of both technical analysis indicators and market psychology in recent times. Failure to maintain stability above the resistance level indicates that selling pressure in the region is still active, but the technical structure points to the possibility of a strong breakout.
In particular, the Chaikin Money Flow (CMF) indicator returning to positive territory indicates an increase in net capital inflows into the market and constitutes one of the most important factors supporting the bullish scenario. Such an increase in liquidity inflows suggests that a potential upward breakout could be supported by high volume and that price movements could progress in a healthy manner.
The Relative Strength Index (RSI) indicator continuing to trade above both the MA line and the 50 level is strengthening momentum in a positive direction. This structure indicates that buyers are in control and pullbacks are limited, while the RSI’s horizontal movement at current levels also holds the potential for a move toward the overbought zone.
When examining the Ichimoku indicator, the price regaining the Tenkan and Kijun levels stands out as an important signal confirming that the short-term trend has turned in favor of buyers. This indicates that the price has established a strong technical foundation during the upward trend and that these levels could serve as dynamic support in the event of potential pullbacks.
Looking at the market structure, if the price manages to stay above the 3.30 dollar level and the breakout is supported by volume, there is a high likelihood of a sharp upward price movement in the evening hours . In this scenario, the rapid filling of liquidity gaps triggered by short-term stop-loss levels could increase the upward momentum of the price. However, a strong rejection from the 3.30 dollar level could lead to the price retreating first to the Tenkan and Kijun levels, and then to deeper support zones if it fails to hold in these areas. In this context, risk management is of critical importance, particularly for short-term traders.
Supports: 3.0927 – 2.9967 – 2.7355
Resistance levels: 3.3058 – 3.6554 – 4.0055
SOL/USDT
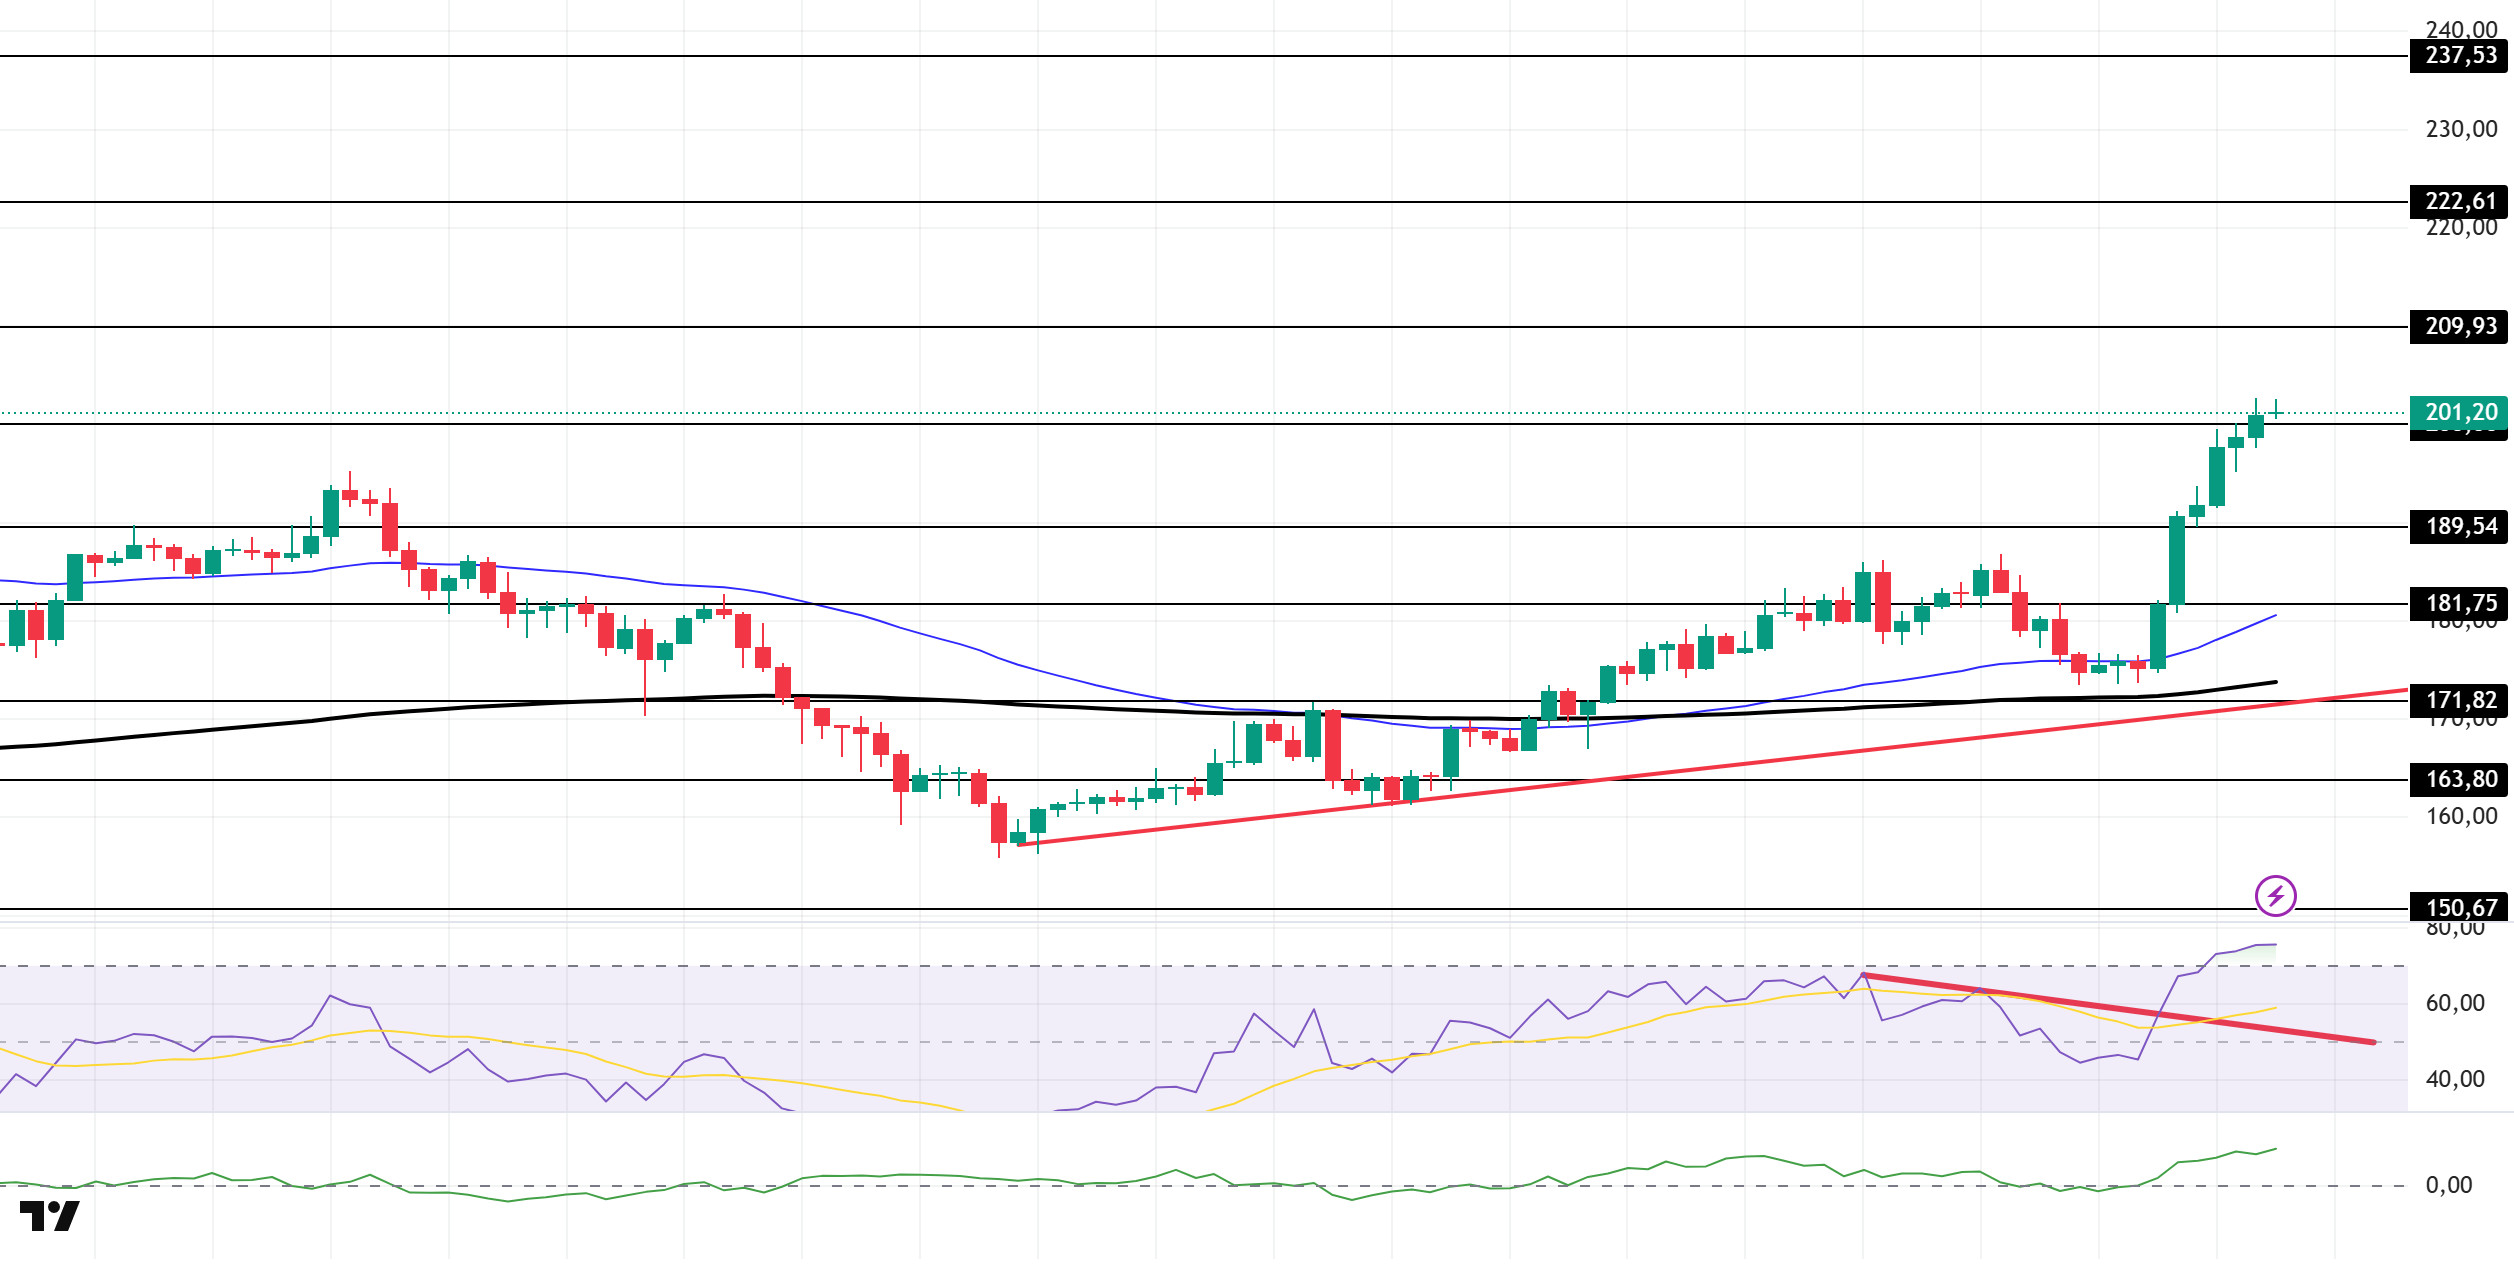
The SOL price showed a slight increase during the day. The asset continued to remain above the upward trend line that began on August 2, while also closing above the strong and psychological resistance level of $200.00. If the upward trend continues, the 209.93 dollar level can be monitored. In the event of a pullback, the 189.54 dollar level could be tested.
On the 4-hour chart, the 50 EMA (Blue Line) remained above the 200 EMA (Black Line). This indicates that the upward trend may continue in the medium term. Additionally, the price being above both moving averages suggests that the market is in an upward trend in the short term. Chaikin Money Flow (CMF-20) is in the upper levels of the positive zone. However, an increase in money inflows could push CMF to the upper levels of the positive zone. The Relative Strength Index (RSI-14) continues to remain above the downward trend that began on August 10. This indicates that buying pressure is continuing. However, the indicator being in the overbought zone could trigger profit-taking. In the event of an upward movement due to macroeconomic data or positive news related to the Solana ecosystem, the $209.93 level emerges as a strong resistance point. If this level is broken to the upside, the upward trend is expected to continue. In the event of a pullback due to adverse developments or profit-taking, the $189.54 level could be tested. A decline to these support levels could see an increase in buying momentum, presenting a potential opportunity for an upward move.
Support levels: 200.00 – 189.54 – 181.75
Resistance levels: 209.93 – 222.61 – 237.53
DOGE/USDT
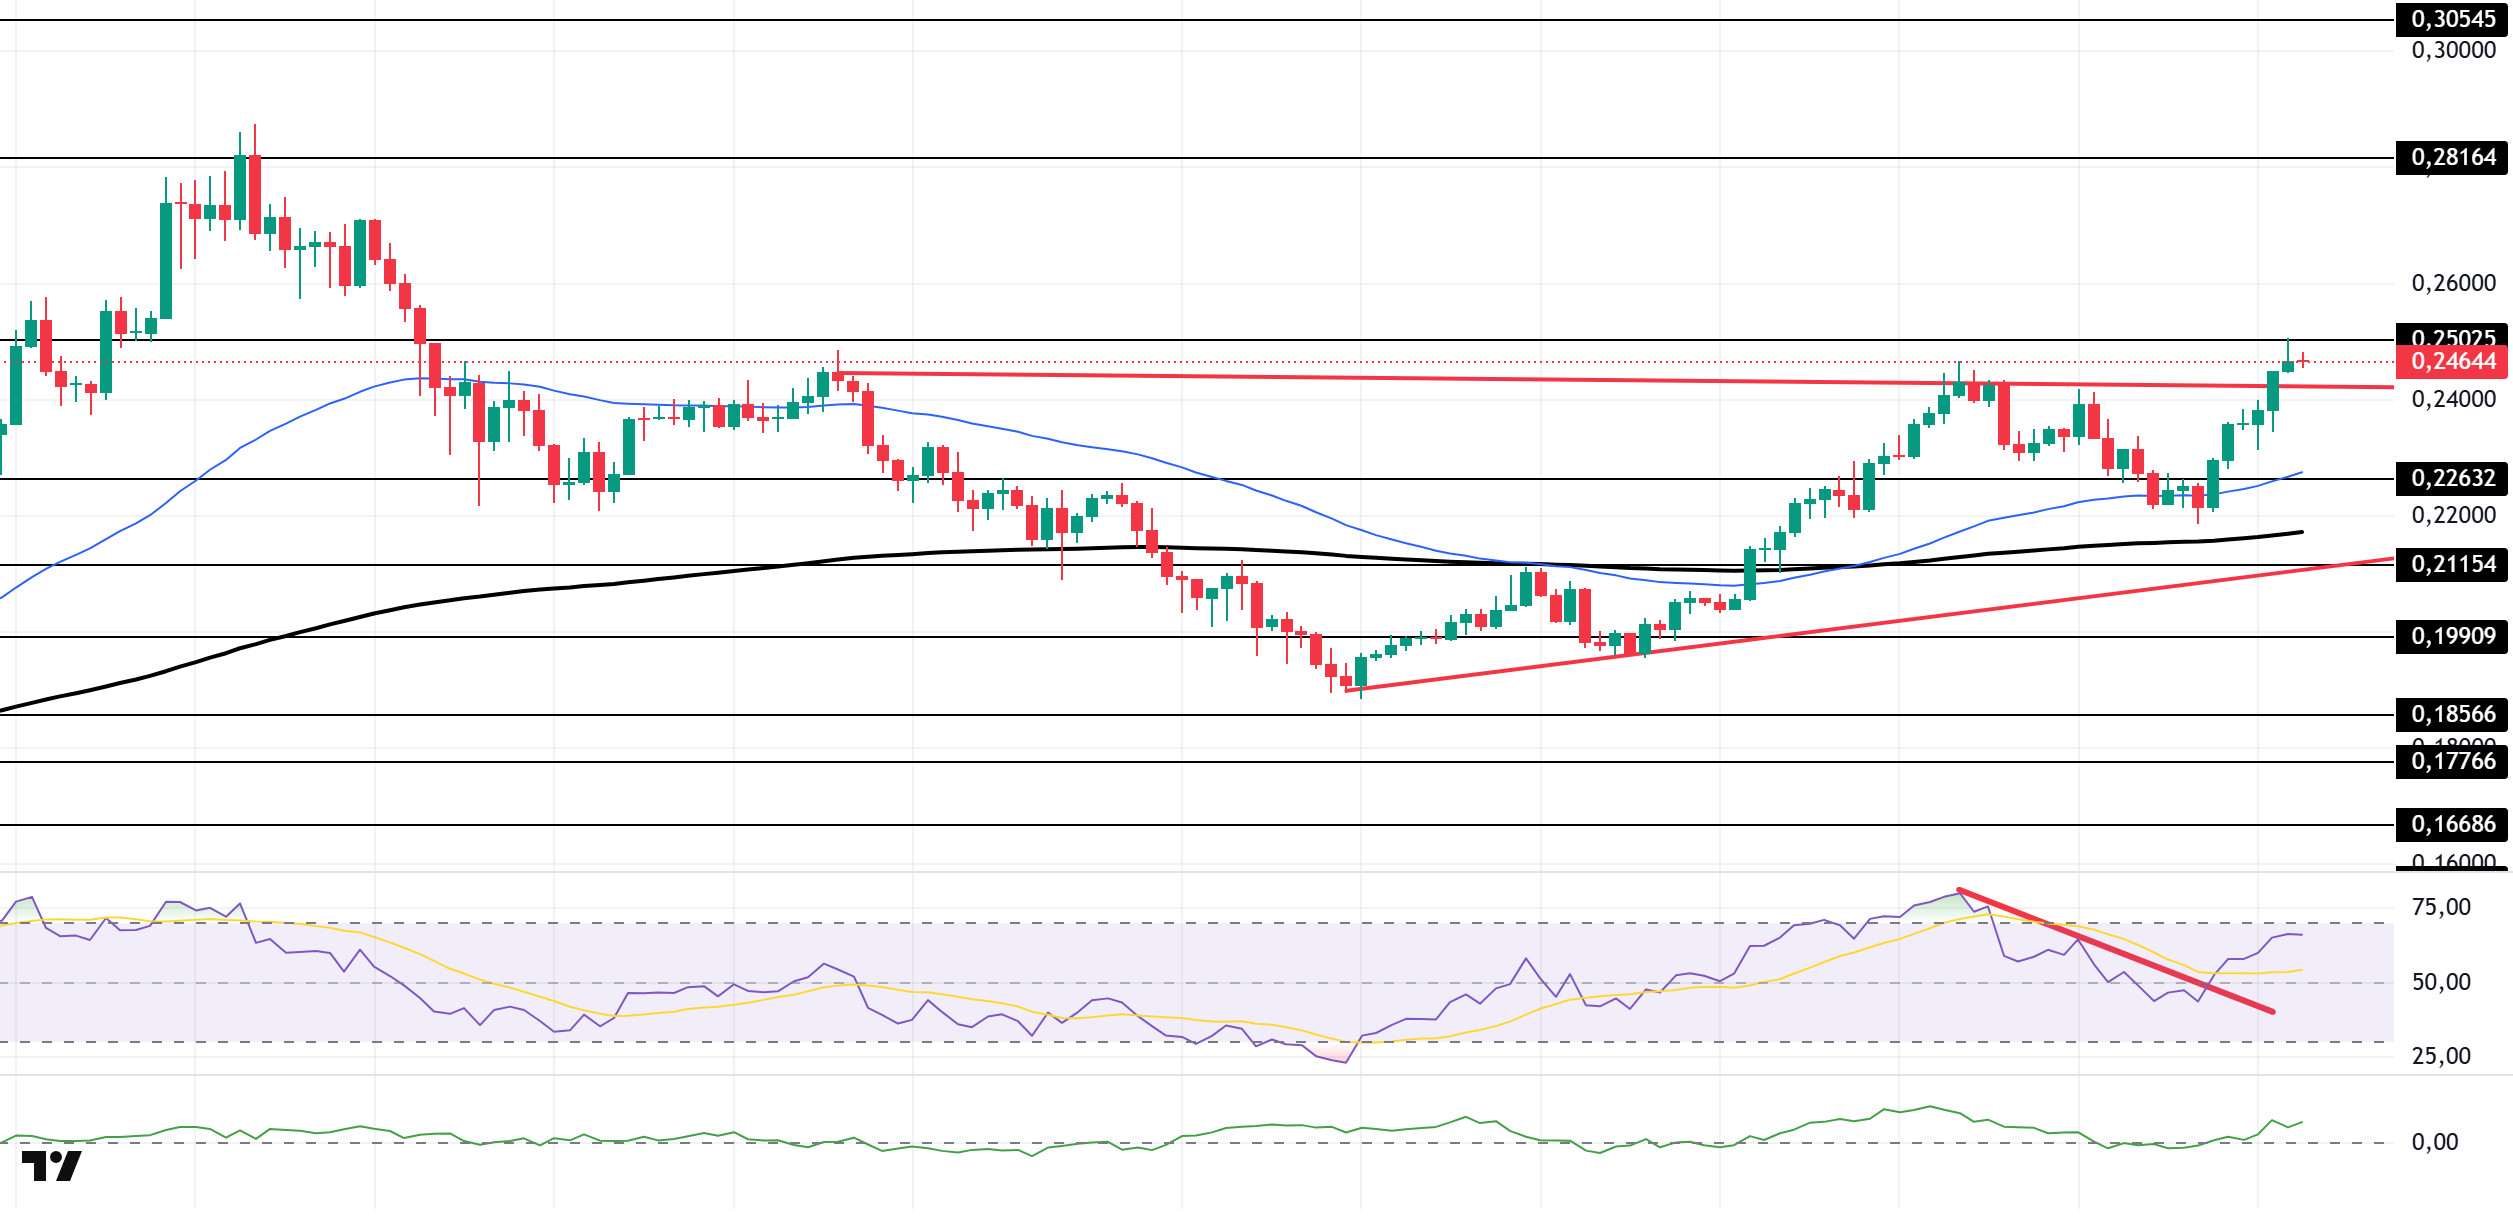
The DOGE price continued its upward trend throughout the day. The asset broke above the resistance level of the symmetrical triangle formation that began on August 2, confirming its upward trend. As of now, it is testing the resistance level at 0.25025 dollars. In case of a pullback, the 0.22632 dollar level can be monitored as support.
On the 4-hour chart, the 50 EMA (Blue Line) remains above the 200 EMA (Black Line). This indicates that the asset is in an upward trend in the medium term. The price being above both moving averages also indicates that the asset is in an upward phase in the short term. The Chaikin Money Flow (CMF-20) continues to accelerate in the positive zone. Additionally, positive cash inflows could push the CMF to higher levels in the positive zone. The Relative Strength Index (RSI-14) is in the positive zone. It has also remained above the downward trend that began on August 9. In the event of upward movements driven by political developments, macroeconomic data, or positive news flow within the DOGE ecosystem, the $0.25025 level emerges as a strong resistance zone. In the opposite scenario or in the event of negative news flow, the 0.22632 dollar level could be triggered. A decline to these levels could increase momentum and potentially trigger a new upward wave.
Support levels: 0.22632 – 0.21154 – 0.19909
Resistance levels: 0.25025 – 0.28164 – 0.30545
SHIB/USDT
A significant increase in the burn rate was observed in the Shiba Inu ecosystem today. Approximately 85.8 million SHIB were removed from circulation in the last 24 hours, and the burn rate increased by 83.891%. Shibarium’s total transaction count surpassed the 1.5 billion mark. The number of addresses conducting transactions exceeded 267,000, and the number of blocks is around 12.5 million. An increase in net exchange outflows is being observed, which may indicate a potential easing of selling pressure in the short term and a supply-side contraction effect in the medium term. The steady growth in transaction volume on the network and the increase in the number of addresses signal strong organic expansion of the ecosystem. These developments can be interpreted as a long-term structural strengthening signal for the ecosystem.
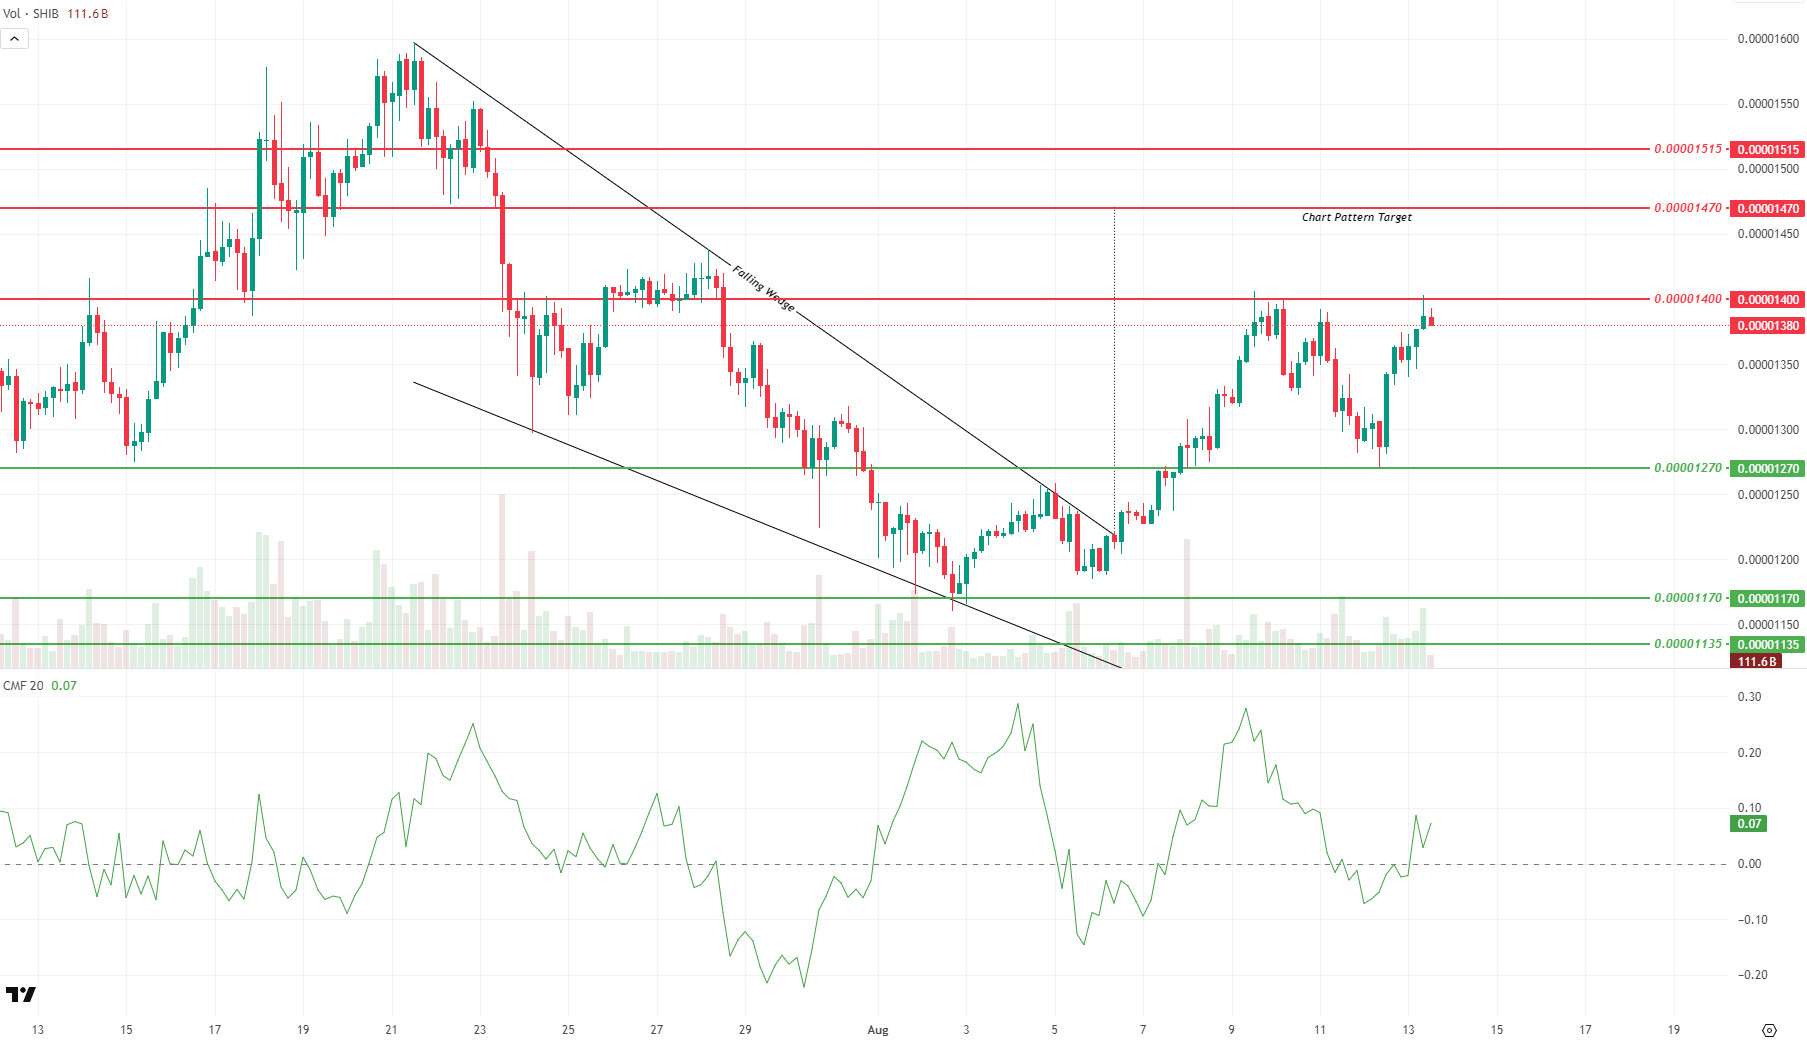
On the technical side, the price recovered from the $0.00001270 support level and is currently holding at the $0.00001400 resistance level. If there are volume-supported four-hour closes above this level, the 0.00001470 dollar level remains the target, and if it extends further, the 0.00001515 dollar level could come into focus. However, if the rejection from this area continues, the 0.00001350 dollar level becomes an intermediate support, and the risk of a decline to the 0.00001320 dollar level increases. The 0.00001270 dollar level remains the main support. Chaikin Money Flow (CMF) is at 0.07 in the positive zone and trending upward, indicating that the buying side is strengthening but that an increase in trading volume is needed to confirm the breakout.
The most important factor supporting the medium-term technical outlook is the breakout of the Falling Wedge formation formed since July 21 on August 6 and the continued validity of the formation target at the 0.00001470 dollar level. This formation structurally helps maintain upward momentum, while the market’s reaction at critical resistance levels will determine the short-term trend direction. Additionally, the possibility of a double top forming around the 0.00001400 dollar level should not be overlooked. Therefore, closing levels and volume dynamics should be closely monitored.
Support levels: 0.00001270 – 0.00001170 – 0.00001135
Resistance levels: 0.00001400 – 0.00001470 – 0.00001515
ADA/USDT
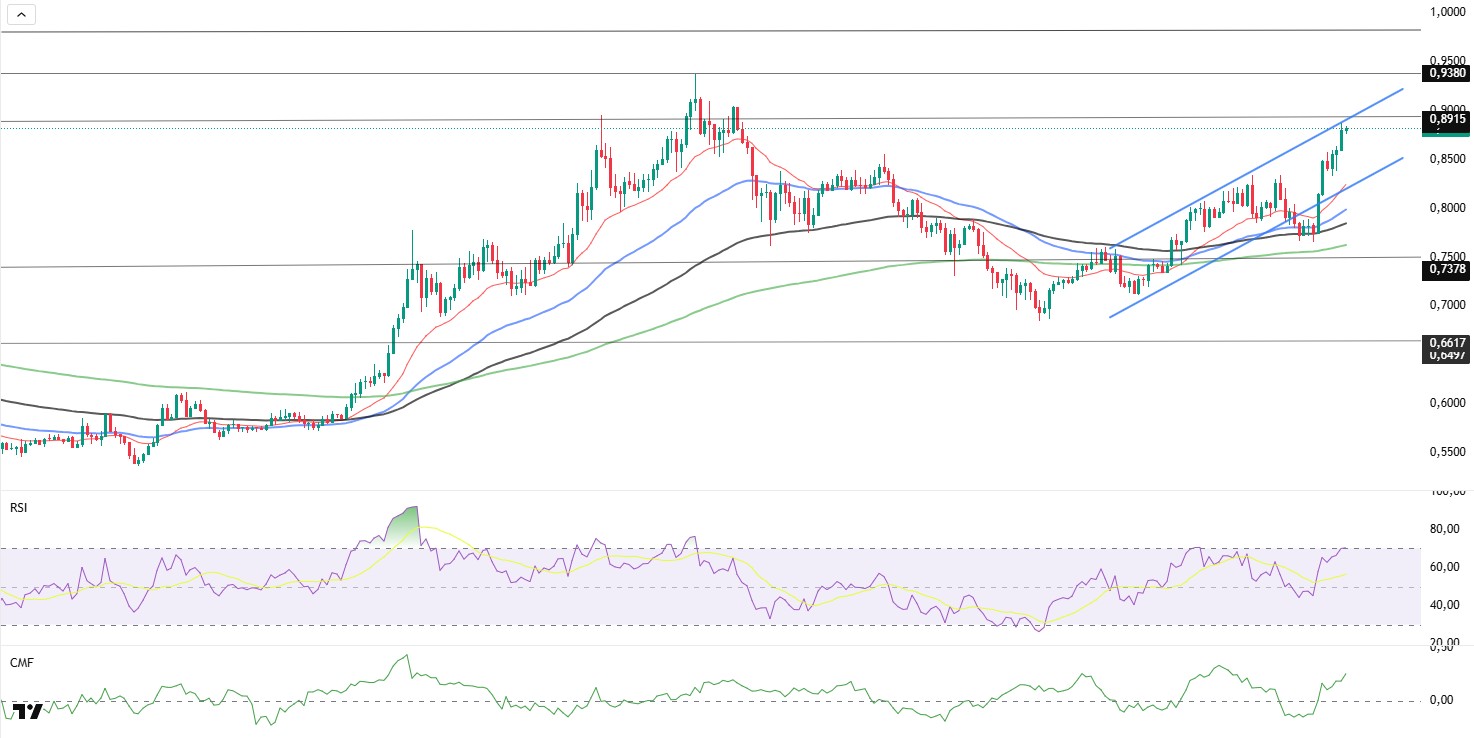
ADA continued its upward movement within the rising channel band during the day, testing the resistance level of 0.8413 before breaking through the second resistance level of 0.8811. This upward movement may continue as long as the EMA 20 (Red Line) remains within the rising channel. If the upward trend continues, the 0.8915 level will be the important resistance level to watch on the 4-hour chart. If the price closes at these levels, the 0.9380 levels may emerge as strong resistance points.
The price remains above the 50 and 100-day Exponential Moving Averages (EMA-Blue Line) and (EMA-Black Line) on the 4-hour chart, indicating that buyers are gaining strength. The Relative Strength Index (RSI-14) has risen to 69 levels, continuing its movement close to the overbought zone, while the Chaikin Money Flow (CMF-20) also indicates the continuation of an upward signal. An increase in capital inflows could keep the CMF in the region and potentially exert a bullish influence. In the event of negative macroeconomic data or news related to the Cardano ecosystem, the price could test the 0.7378 dollar level.
Support levels: 0.7378 – 0.6938 – 0.6617
Resistance levels: 0.8915 – 0.9318 – 0.9752
LINK/USDT
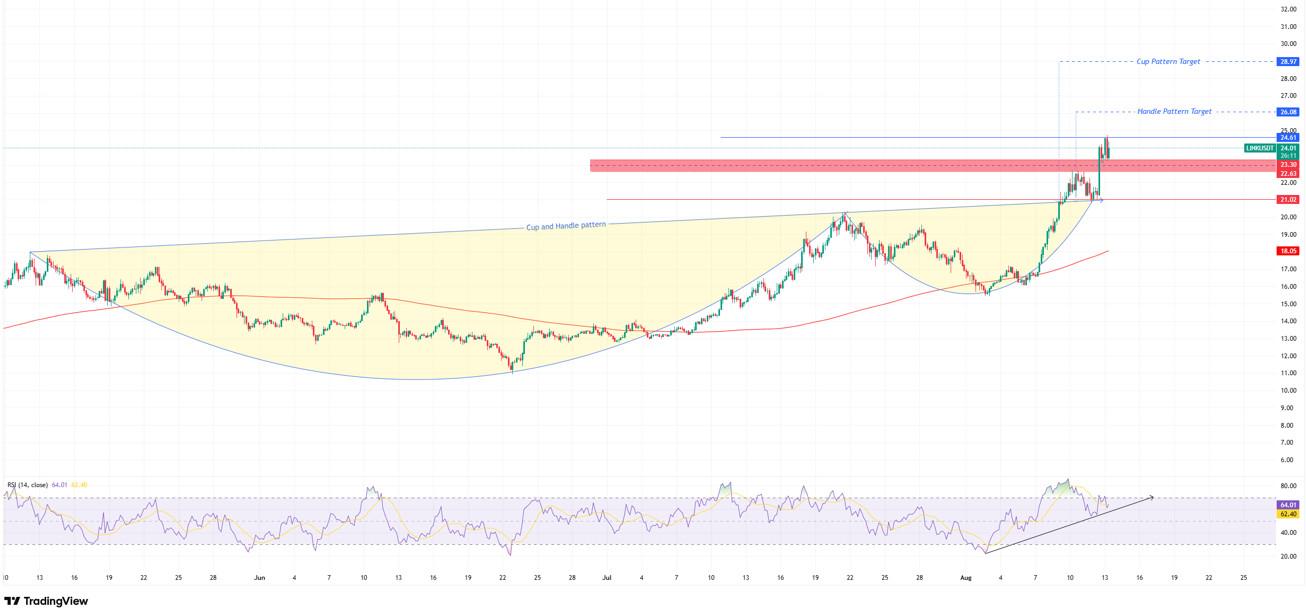
LINK broke above the long-term cup and handle formation on August 9, gaining strong upward momentum. The price then retreated to $21, but this decline did not break the formation structure and remained a technical retest. The positive close on August 12 indicated strong buying demand in this area. Currently, the price is at $24.01, with the $23.30–$22.63 range emerging as the primary short-term support level. As long as this area holds, the upward scenario remains technically valid.
In the upward scenario, the first target is 26.08 dollars according to the handle formation measurement, and the cup formation target is 28.97 dollars. These levels can be monitored for profit realization if the trend continues. In the downside scenario, if the price falls below $22.63, the $22.00 and $21.02 levels become critical for a second retest. Losing these levels could weaken the validity of the formation and lead to a deeper correction in the price.
The Relative Strength Index (RSI) indicator has maintained its positive trend since the August 2 handle low and is currently at 64. As long as this trend continues, the likelihood of upward momentum persisting remains high. However, a break below the RSI trend line could signal a weakening of buying pressure and push the price back to 22.68 USD, and then to the main support zone around 21 USD.
Support levels: 23.30 – 22.63 – 21.02
Resistances: 24.61 – 26.08 – 28.97
Legal Notice
The investment information, comments, and recommendations contained herein do not constitute investment advice. Investment advisory services are provided individually by authorized institutions taking into account the risk and return preferences of individuals. The comments and recommendations contained herein are of a general nature. These recommendations may not be suitable for your financial situation and risk and return preferences. Therefore, making an investment decision based solely on the information contained herein may not produce results in line with your expectations.

