
Technical Analysis – September 30, 2025 – Evening
BTC/USDT
As the risk of a government shutdown increases in the US, Trump said that if the government shuts down, a large number of employees could be laid off. Tether increased its Bitcoin reserves by purchasing 8,888 BTC worth $1 billion at the end of the second quarter of 2025. Alameda Research transferred 500 BTC in the last 8 hours. FTX announced that it will distribute a total of $1.6 billion to creditors, with additional rates on top of previous payments and payments of up to 120.5% to some creditors.
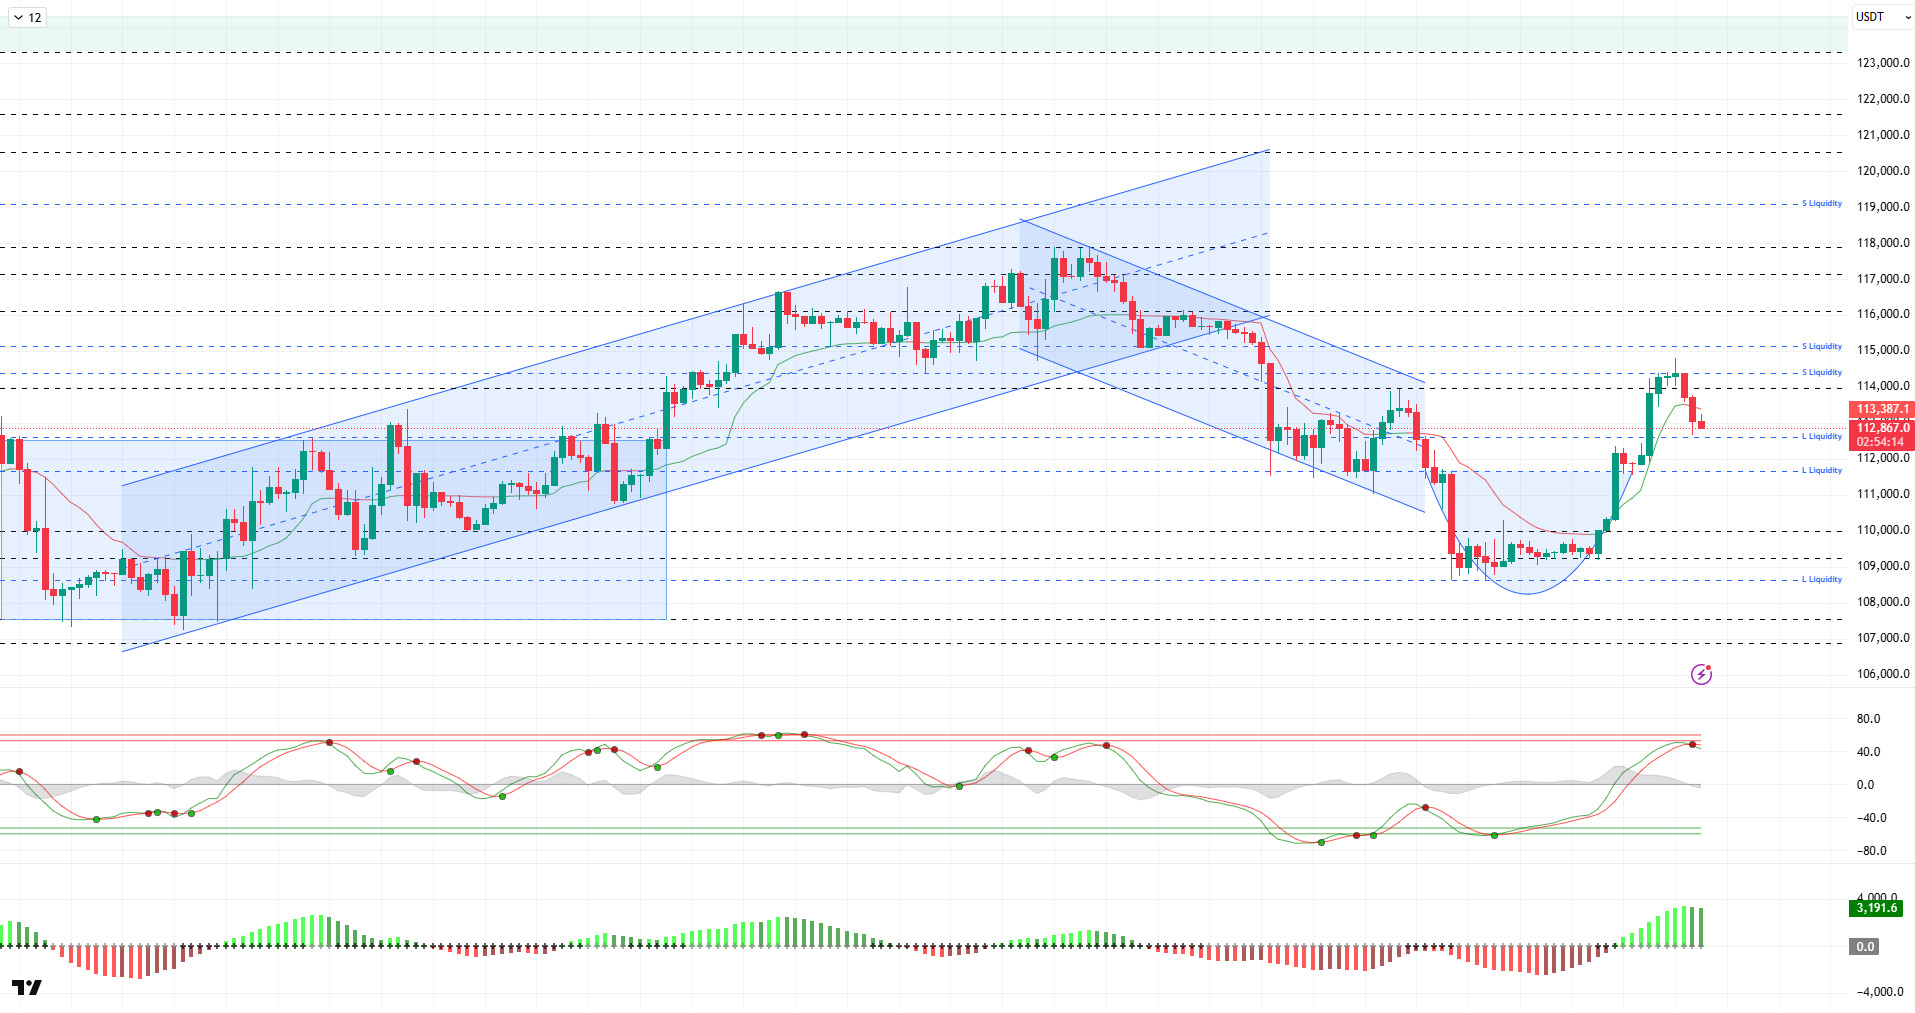
Looking at the technical picture, BTC continues to carry its upward momentum with its cup formation. In the previous analysis, BTC, which was trading at 112,000 levels, tested the 114,800 level with its recorded increases. Then, facing some selling pressure, the price fell back to 112,800 levels.
Technical indicators show that the Wave Trend oscillator (WT) has crossed the middle band of the parallel channel into the overbought zone, in line with the buy signal it gave in the oversold zone. Along with the weakening buy signal, this points to a renewed short-term trend reversal. The Squeeze Momentum (SM) indicator’s histogram continues its momentum within the positive zone. The Kaufman moving average is currently trading below the price at the 113,500 level.
According to liquidation data, short positions concentrated in the 114,000–115,000 range were liquidated with the latest rise. However, accumulation is being observed again in sell-side transactions, and this concentration is particularly evident at the 115,100 level. On the buy side, short-term positions are concentrated at the 113,000 level, while long-term trades are concentrated at the 111,500 level. In the last 24 hours, a total of $62 million in short positions and approximately $7 million in long positions were liquidated. The total liquidation amount in the overall market reached $311 million.
In summary, looking at the key developments, the decline in expectations for interest rate cuts, along with US macroeconomic data reducing the risk of recession, led to the loss of a positive short-term environment for the market. Differing views among Fed members on interest rate cuts and the reintroduction of tariffs have emerged as pessimistic developments for the market. On the other hand, with October approaching, a month dominated by gains in crypto, the price has rebounded from its low. Technically, BTC has rebounded with the formation of a cup pattern. Liquidity data shows that increasing sell-side transactions have become the target. In this context, the 114,000 level is being monitored as a resistance point in the continuation of the upward movement, while we will monitor the 112,600 and then 111,400 support levels in the event of a possible selling pressure.
Supports: 112,600 – 111,400 – 110,000
Resistances: 114,000 – 115,000 – 116,000
ETH/USDT
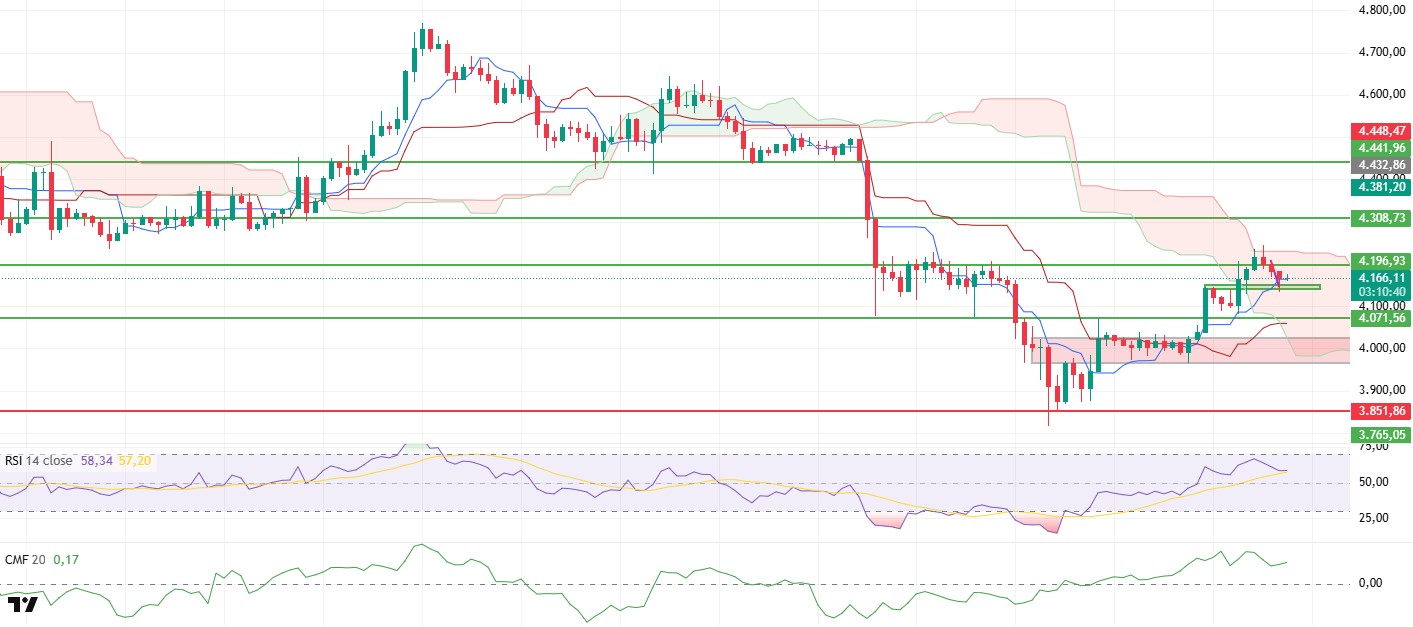
The ETH price retreated to the demand zone during the day, then rebounded from this area and resumed its upward movement, currently trading at $4,170. This movement indicates that buyers remain strong and have managed to keep the market balanced despite selling pressure. In particular, the rebound from the demand zone stands out as an important development supporting the likelihood of continued growth in the short term.
The Chaikin Money Flow (CMF) indicator moving upward in the positive zone indicates that liquidity inflows into the market are continuing and buyers remain in an advantageous position. This outlook confirms that the bullish scenario remains valid.
In the Ichimoku indicator, the price remaining above the Tenkan level and continuing to trade within the kumo cloud strengthens the market’s positive structure. This outlook supports the upward trend while indicating that buyers are still dominant.
Although some weakening is observed on the momentum side, it is clear that the overall trend remains upward. This situation indicates that in the short term, the price could regain upward momentum with the reaction it receives from strong support levels.
As a result, price movements at the critical levels mentioned in the morning analysis will be decisive in determining the direction for the remainder of the day. In particular, staying above $4,196 could pave the way for the price to move towards the $4,230 and $4,308 resistance levels, while any pullbacks below this level could bring the $4,140 support level back into focus. Prices below the $4,140 level could bring sharp declines.
Top of Form
Below the Form
Supports: 4,071 – 3,851 – 3,672
Resistances: 4,196 – 4,308 – 4,441
XRP/USDT
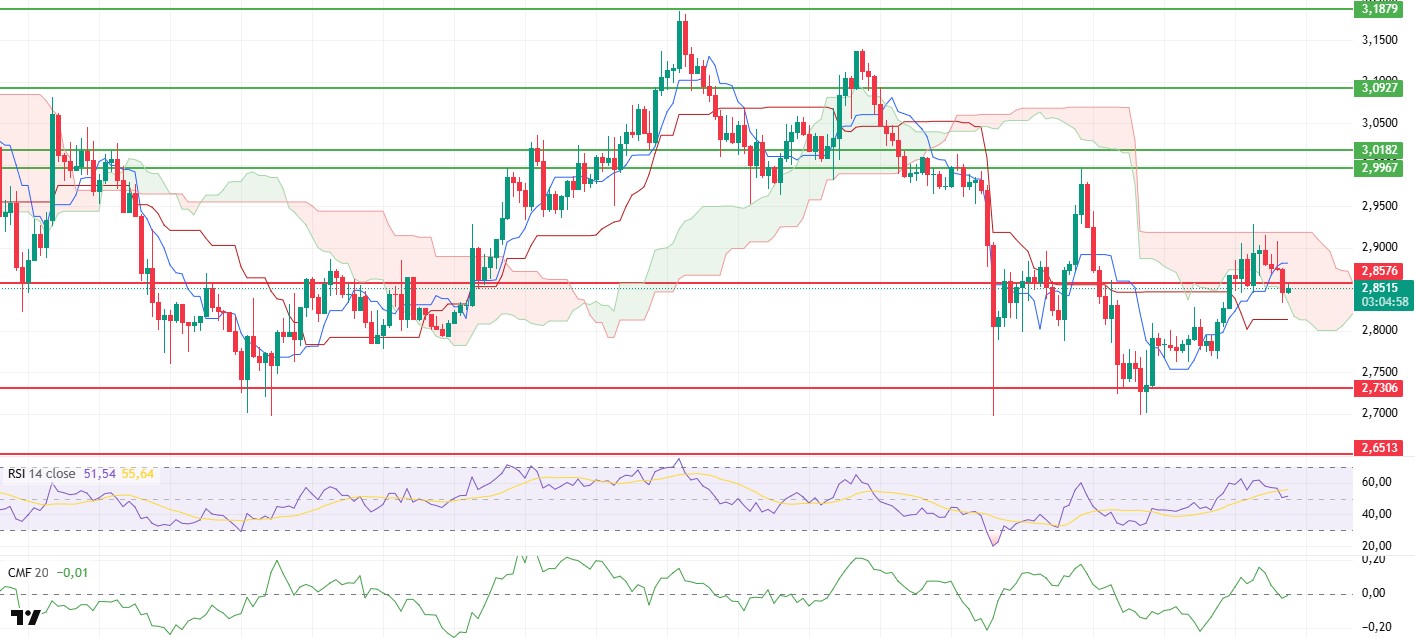
The XRP price lost momentum during the day, falling below the $2.8570 level, clearly indicating a loss of momentum in the short term. In particular, pricing below this critical level signals that the market is under selling pressure and that buyers are beginning to lose strength.
The sharp decline of the Chaikin Money Flow (CMF) indicator to the zero line reveals accelerated liquidity outflows from the market and investors’ risk aversion. This outlook confirms that buyers are withdrawing from the market and sellers are gaining ground.
The loss of the Tenkan level in the Ichimoku indicator is another development that strengthens the short-term bearish scenario. This scenario weakens the possibility of an upward recovery in the price while increasing the likelihood of continued selling pressure.
On the Relative Strength Index (RSI) side, the downward break of the base line is noteworthy. This movement indicates that momentum is weakening and selling pressure may increase further in the coming sessions. This deterioration in the RSI, in particular, limits the market’s chances of recovery in the short term.
In general terms, staying below the $2.8570 level could pave the way for the price to retreat to the $2.73 level. Conversely, if the price rises above this level again, it could contribute to a reversal of the negative outlook and bring the possibility of a short-term recovery in the market to the fore. However, the current technical picture indicates that selling pressure remains dominant.
Supports: 2.7306 – 2.6513 – 2.4730
Resistances: 2.8576 – 2.9183 – 2.9967
SOL/USDT
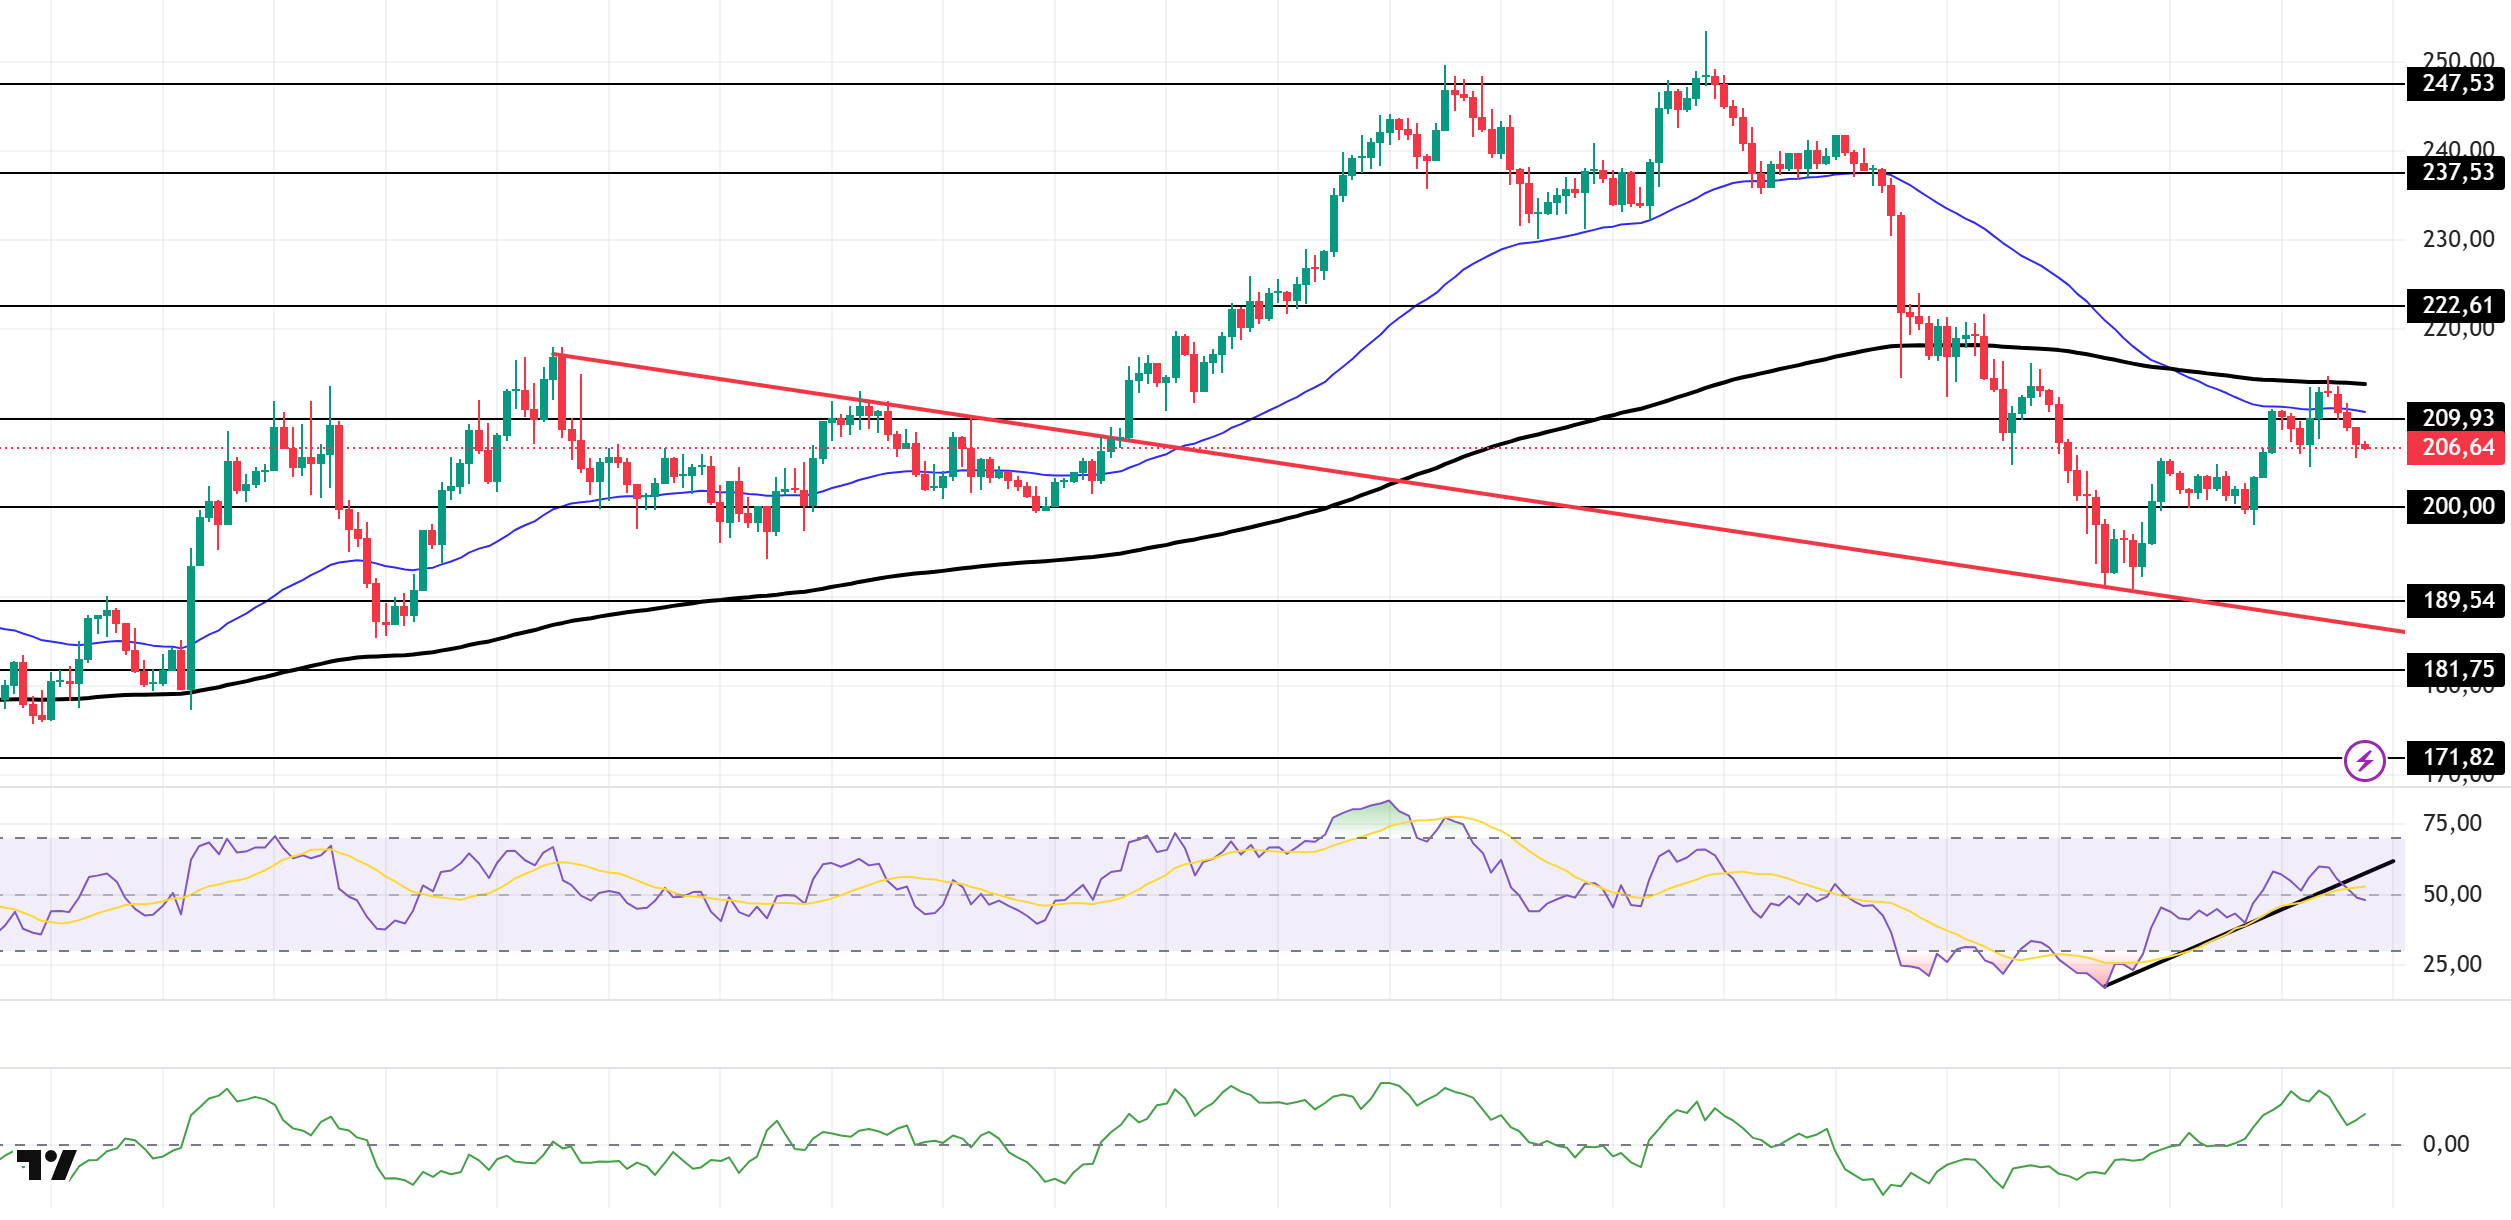
The SOL price experienced a pullback during the day. The asset continues to be in the upper region of the downward trend that began on August 29. Currently, the price, which is facing resistance at the 200 EMA (Black Line) moving average, experienced a slight pullback and began to trade below the 50 EMA (Blue Line) moving average. If the pullback continues, the $200.00 level can be monitored. In the event of candle closes above the 200 EMA, the $222.61 level should be monitored.
The price remained below the 50 EMA (Exponential Moving Average – Blue Line) and 200 EMA (Black Line) on the 4-hour chart. This indicates a possible downward trend in the medium term. At the same time, the price being below both moving averages shows us that the market is trending downward in the short term. The Chaikin Money Flow (CMF-20) remained in positive territory. However, a decrease in money inflows could push the CMF into negative territory. The Relative Strength Index (RSI-14) moved to a neutral level. At the same time, it crossed into the lower region of the upward trend that began on September 25, indicating increased selling pressure. If there is an uptrend due to macroeconomic data or positive news related to the Solana ecosystem, the $222.61 level stands out as a strong resistance point. If this level is broken upwards, the uptrend is expected to continue. If pullbacks occur due to developments in the opposite direction or profit-taking, the $200.00 level may be tested. A decline to these support levels could increase buying momentum, presenting a potential upside opportunity.
Supports: 200.00 – 189.54 – 181.75
Resistances: 209.93 – 222.61 – 237.53
DOGE/USDT
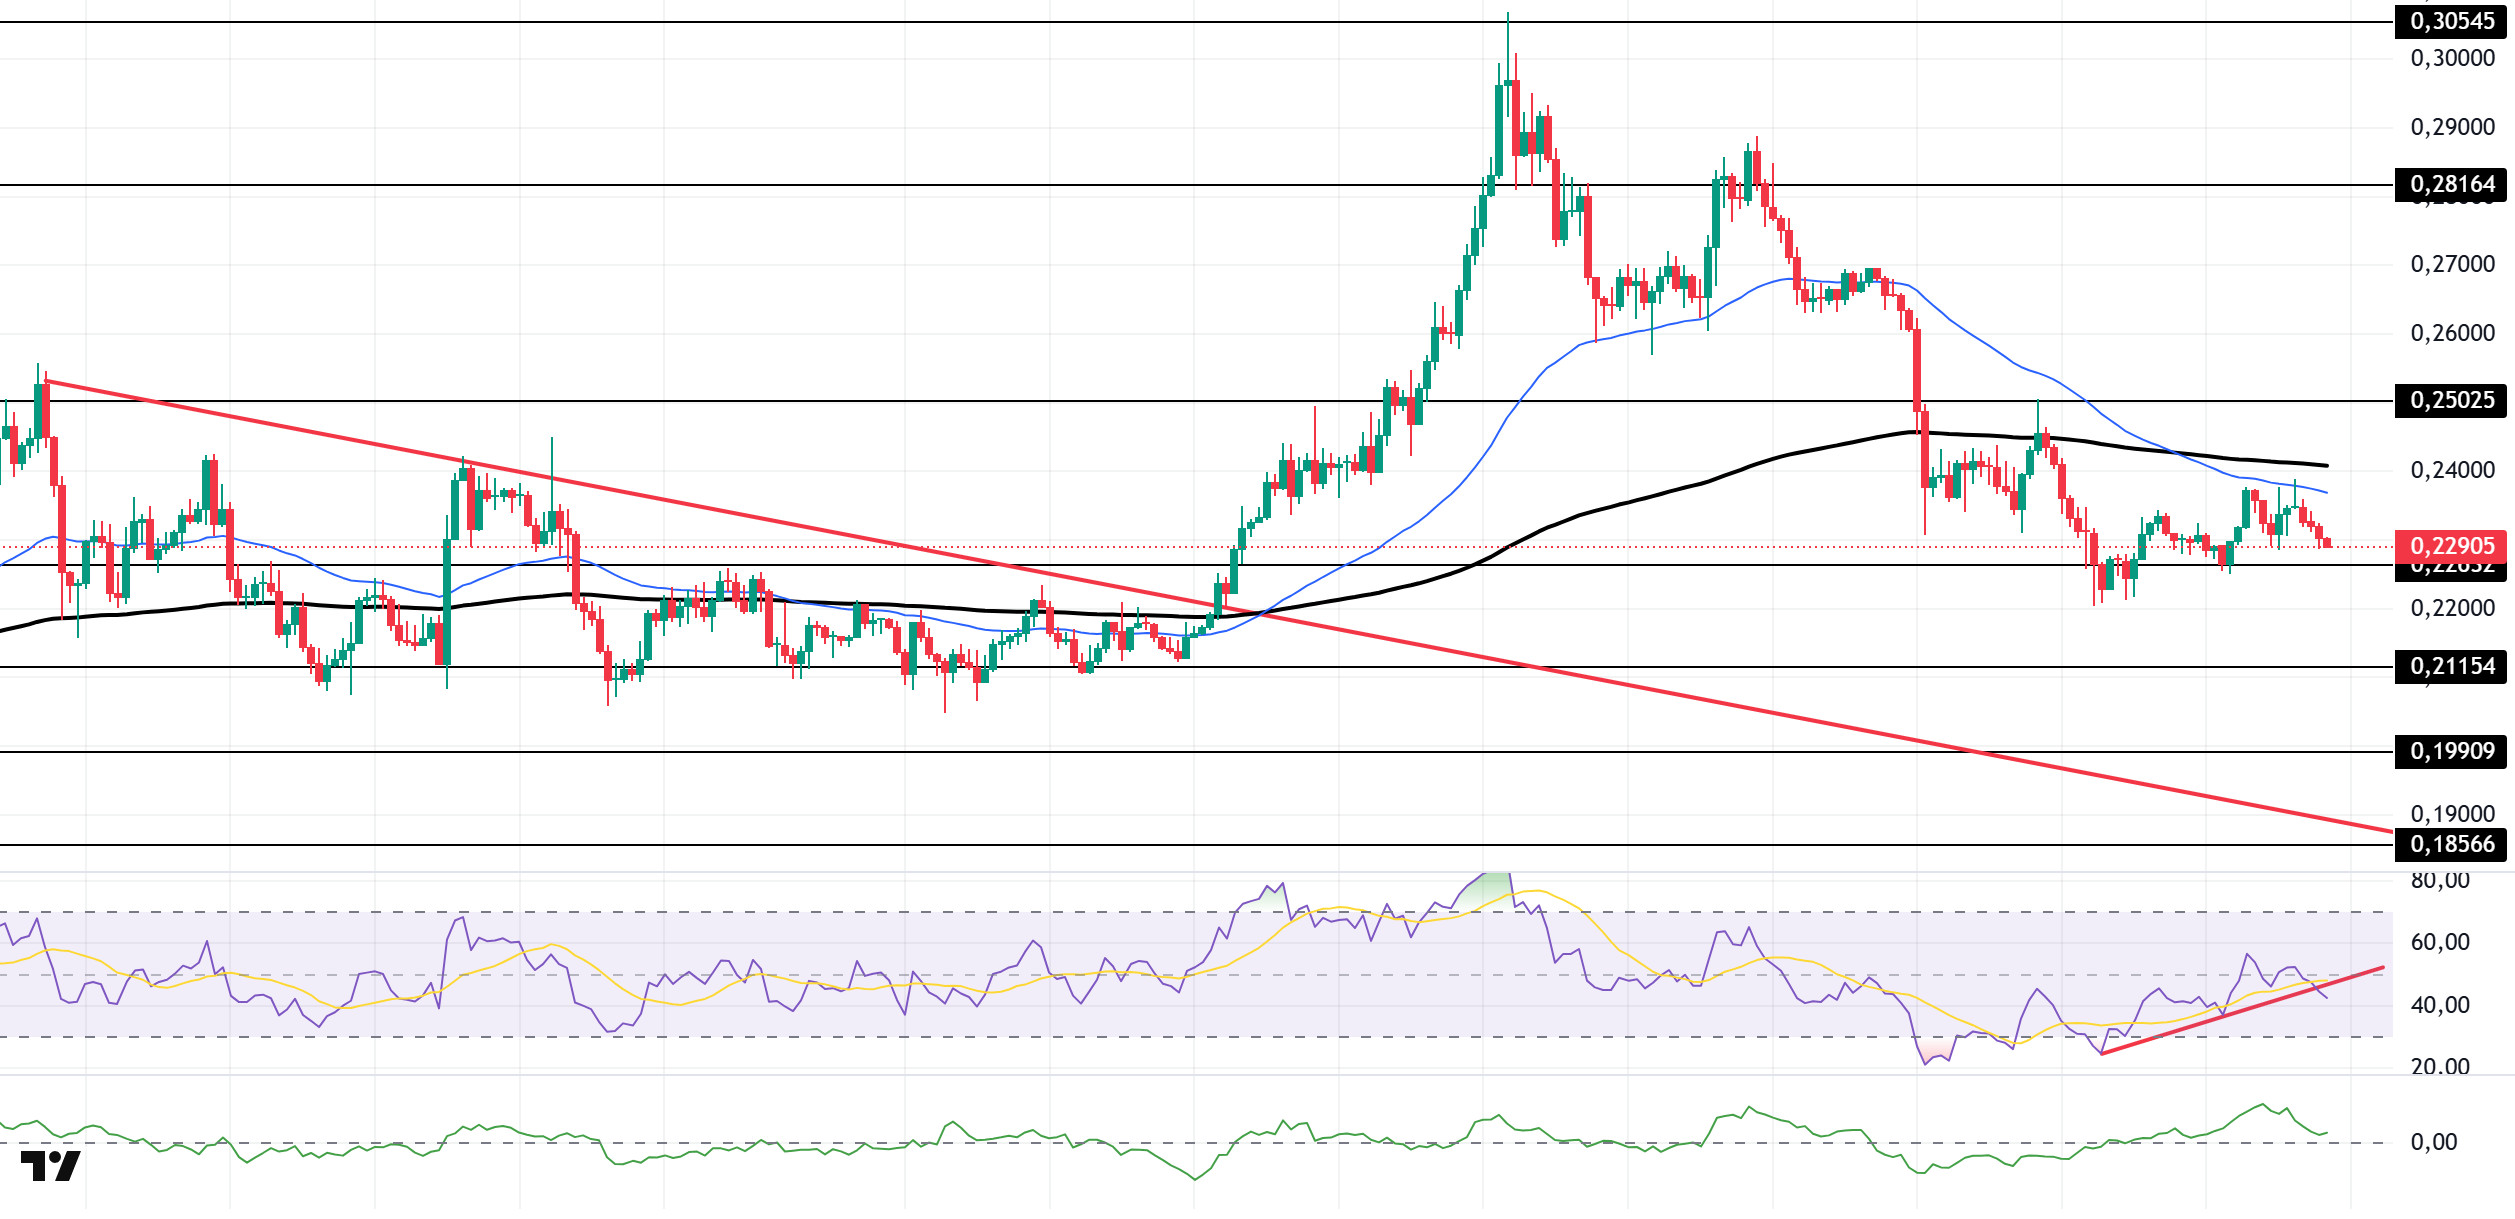
The DOGE price showed a slight decline during the day. The asset remained above the downward trend that began on August 14. Testing the 50 EMA (Exponential Moving Average – Blue Line), a strong resistance level, the price failed to break through and declined. It is now preparing to test the strong support level of $0.22632. If the moving average closes above this level, it could test the resistance level of $0.25025.
On the 4-hour chart, the 50 EMA (Exponential Moving Average – Blue Line) remained below the 200 EMA (Black Line). This indicates a downward trend in the medium term. The price being below both moving averages indicates a downward trend in the short term. Chaikin Money Flow (CMF-20) managed to stay in positive territory. Additionally, a decrease in money inflows could push CMF into negative territory. The Relative Strength Index (RSI-14) fell into negative territory and broke below the upward trend that began on September 25. This could lead to selling pressure. In the event of an upturn driven by political developments, macroeconomic data, or positive news flow in the DOGE ecosystem, the $0.25025 level stands out as a strong resistance zone. Conversely, in the event of negative news flow, the $0.21154 level could be triggered. A decline to these levels could increase momentum and initiate a new wave of growth.
Supports: 0.22632 – 0.21154 – 0.19909
Resistances: 0.25025 – 0.28164 – 0.30545
TRX/USDT
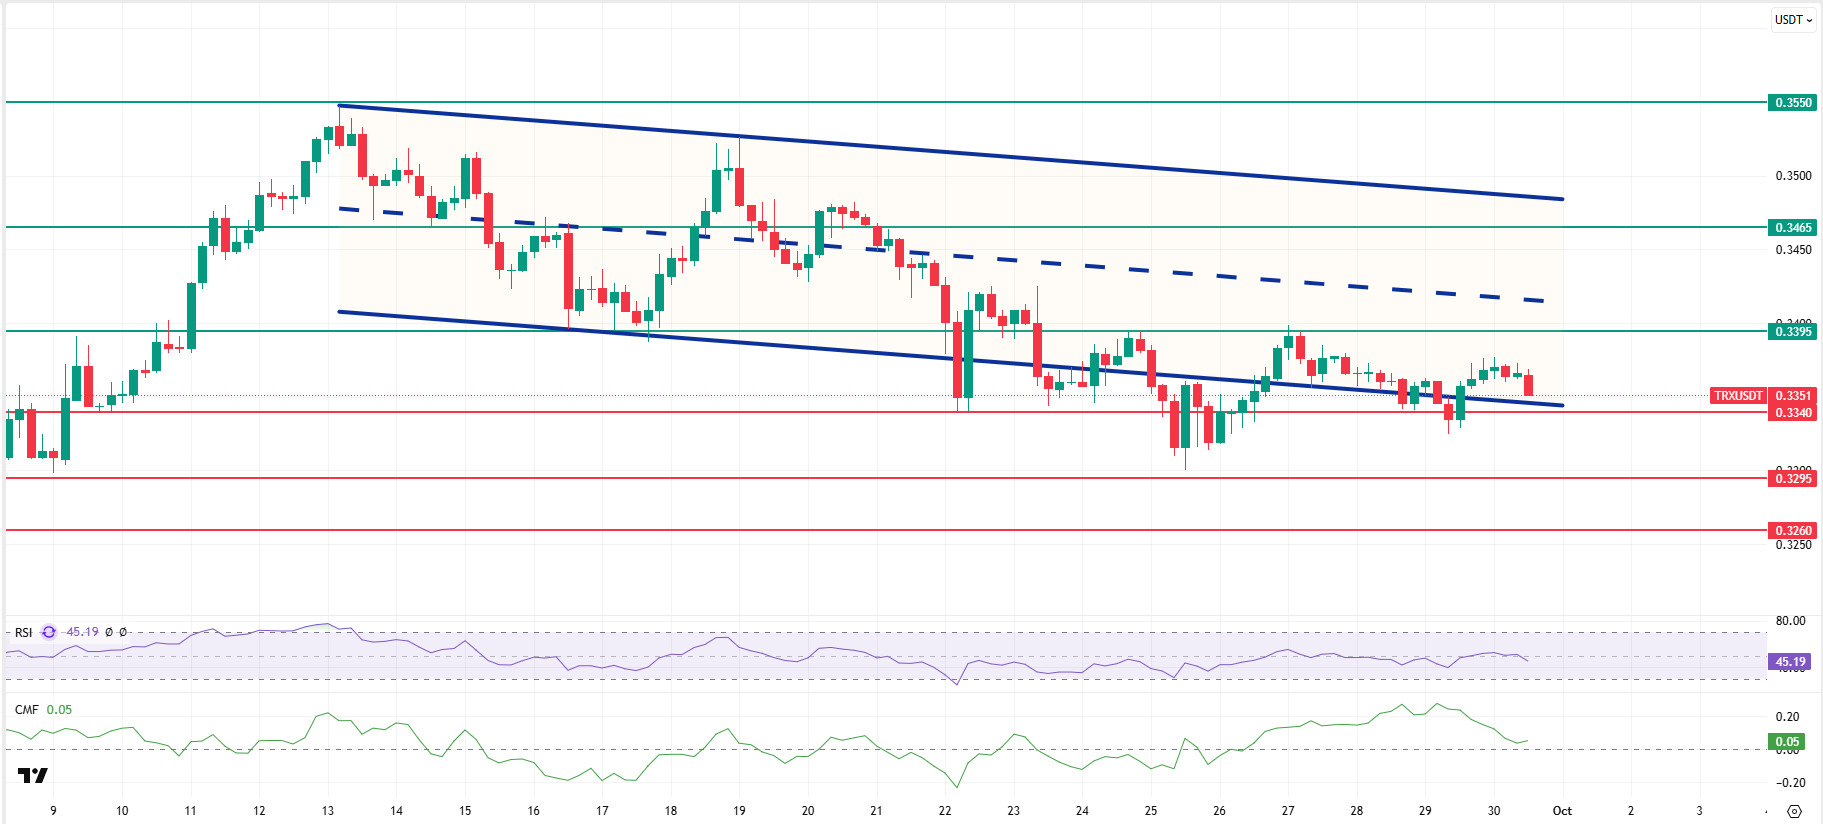
As mentioned in this morning’s analysis, TRX failed to break above the 0.3395 resistance level after the recent rally and continues to move within a bearish channel, currently trading at 0.3351. Currently just above the lower band of the bearish channel, TRX is trading very close to the 0.3340 support level on the 4-hour chart. The Relative Strength Index (RSI) value of 45 indicates that it is in the sell zone. In addition, the Chaikin Money Flow (CMF) indicator remains above zero at a value of 0.05, indicating that money inflows continue. The CMF remaining in positive territory can be considered an indicator that the price may experience an increase.
In light of all these indicators, TRX may rise slightly in the second half of the day and move towards the middle band of the bearish channel. In such a case, it may test the 0.3395 resistance level. With a candle close above the 0.3395 resistance level, it may continue its rise and then attempt to test the 0.3465 resistance level by breaking through the middle band of the channel. If the candle does not close above the 0.3395 resistance level, the CMF may move into negative territory, causing inflows to weaken significantly. Following a likely decline in price, it may test the 0.3340 and 0.3295 support levels in sequence.
On the 4-hour chart, 0.3260 is an important support level, and as long as it remains above this level, the upward momentum is expected to continue. If this support level is broken, selling pressure may increase.
Supports: 0.3340 – 0.3295 – 0.3260
Resistances: 0.3395 – 0.3465 – 0.3550
SHIB/USDT
After a prolonged period of stagnation on the Shiba Inu network, 100 billion SHIB moved, and a 26% increase in net flows on exchanges was recorded. The recording of a net inflow of 23.1 billion SHIB on September 30 indicates a significant deviation from the low flow rates seen in previous weeks. While this picture suggests that some investors have repositioned themselves against the possibility of short-term volatility or profit-taking, the continued decline in total reserves on exchanges in recent months indicates that supply is gradually tightening. In summary, on-chain data points to increased caution with a meaningful inflow into exchanges, while also implying that the declining supply on centralized exchanges reflects a sustained medium-to-long-term holding bias.
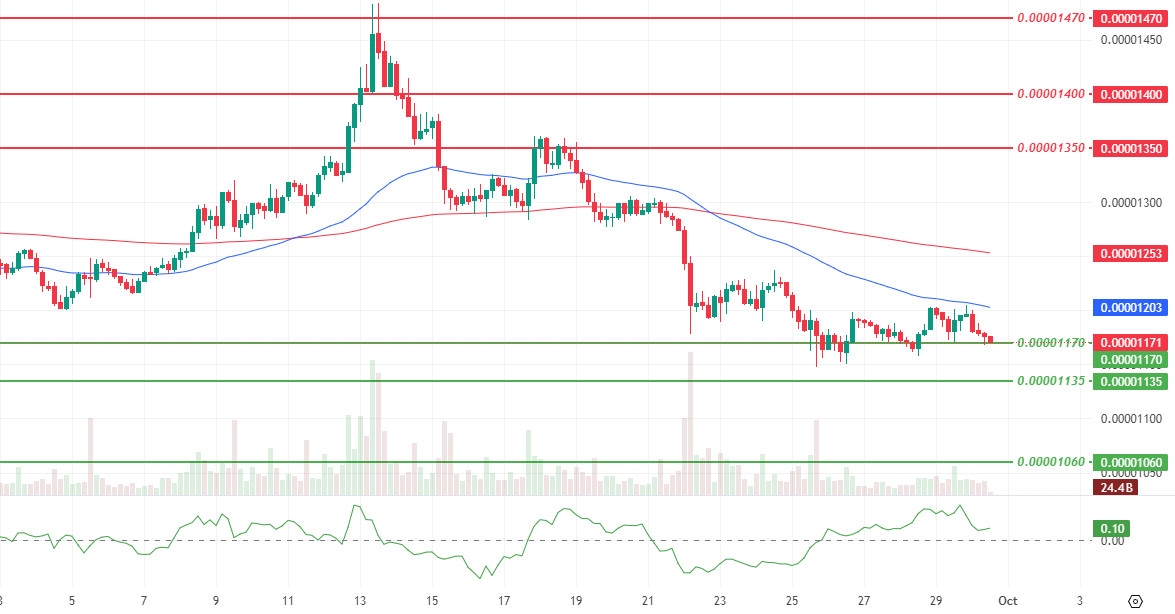
The technical outlook remains cautiously balanced, with limited momentum gains offset by declining trading volume and persistent volatility, confining price action to a tighter range. The reaction from the support zone at $0.00001170 strengthens short-term defense, while the Chaikin Money Flow (CMF) remains in positive territory, confirming that money flow is supporting the price, albeit weakly. However, the price trading below the 50-day and 200-day Exponential Moving Averages (EMA) suggests that upward attempts may remain limited. Therefore, it is difficult to say that the momentum has become sustainable without seeing four-hour closes above $0.00001205 and especially above $0.00001240. If this condition is met, intermediate resistance levels at $0.00001255 and $0.00001350 may come back into play. while the $0.00001170 region continues to serve as the current defense line on the downside. If prices remain below this level, the likelihood of testing the $0.00001135 and $0.00001060 areas increases.
Overall, the slightly recovering momentum, declining volatility, and weakening volume, when read together, indicate that the search for reactive equilibrium continues, maintaining a framework where closing above moving averages and volume confirmation are required for sustainability. (EMA50 Blue line, EMA200 Red line)
Supports: 0.00001170 – 0.00001135 – 0.00001060
Resistances: 0.00001350 – 0.00001400 – 0.00001470
Legal Notice
The investment information, comments, and recommendations contained herein do not constitute investment advice. Investment advisory services are provided individually by authorized institutions taking into account the risk and return preferences of individuals. The comments and recommendations contained herein are of a general nature. These recommendations may not be suitable for your financial situation and risk and return preferences. Therefore, making an investment decision based solely on the information contained herein may not produce results in line with your expectations.

