
Technical Analysis
BTC/USDT
Eight Democratic senators in the US raised allegations of a conflict of interest regarding the crypto assets of Trump’s Special Representative for the Middle East, Steve Witkoff. The senators stated that Witkoff still holds shares in World Liberty Financial and its affiliates, which he co-owns with Trump, and that this could conflict with his diplomatic role in the UAE. On the corporate front, iShares Digital Assets AG announced the third tranche of its Bitcoin ETP. With 1.13 million new securities issued, the ETP reached a total of 61.53 million units. The new tranche will begin trading on the London Stock Exchange under the code IB1T on October 23. In addition, Japanese crypto finance company Remixpoint was included in the Bitwise BTC Standard Corporations ETF.
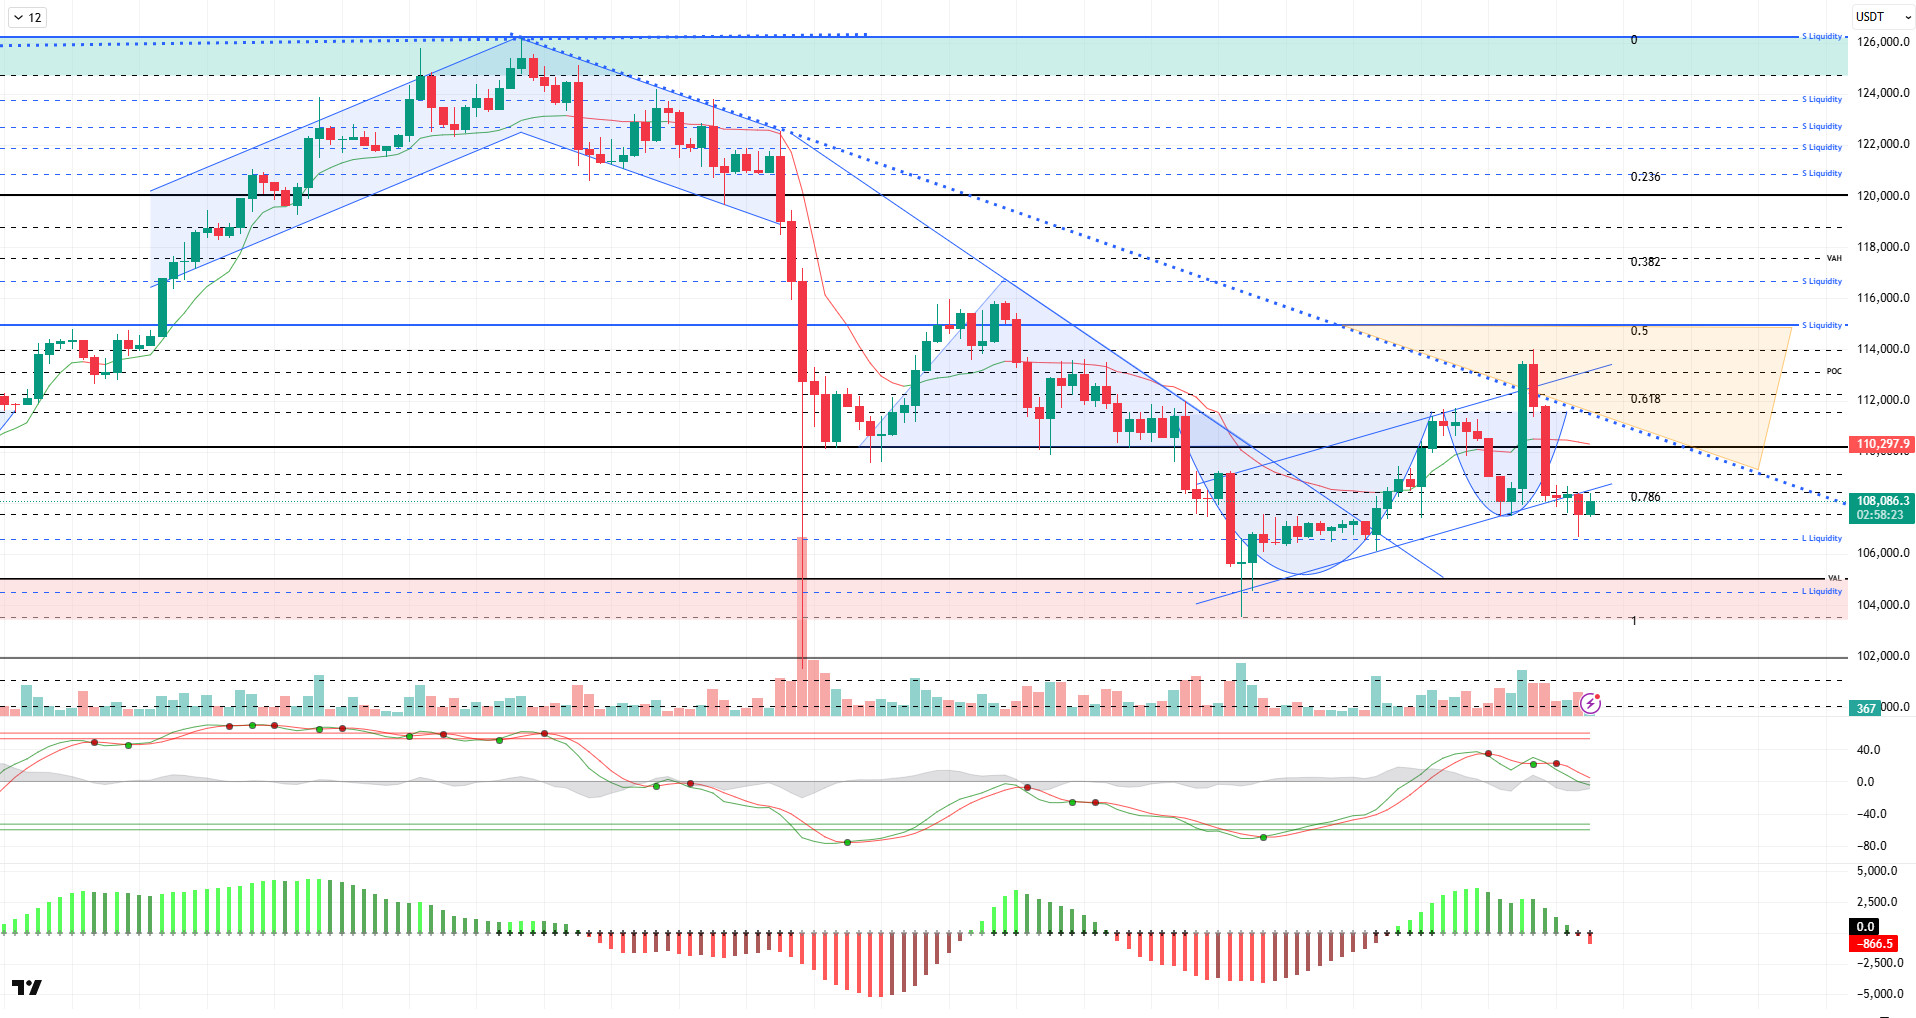
From a technical perspective, compared to the previous analysis, BTC lost its trend lower channel and dropped to the 106,600 level. The price then quickly recovered and settled just below the minor rising channel. At the time of writing, it continues to trade at the 108,000 level.
Technical indicators show that the Wave Trend (WT) oscillator gave a short-term buy signal above the channel midband before reverting to a sell signal. The Squeeze Momentum (SM) indicator’s histogram moved into negative territory. The Kaufman Moving Average (KAMA) is currently at $110,290, positioned above the price.
According to liquidation data, although the 106,600 level has been cleared in the short-term buy zone, congestion continues at the 106,000 level. In a broader time frame, another buy zone continues to maintain its congestion at the 104,300 level. In contrast, the selling level was liquidated in the short term at 112,300, followed by the 113,700 – 113,900 range. New selling intensity is at the 115,000 level.
In summary, setbacks in the reconciliation process between the US and China on the fundamental side are causing continued strong selling pressure in the market. Statements from the Trump camp continue to be decisive for the direction of the markets during this period. The lack of concrete developments regarding the reopening of the US government is another factor that investors are watching closely. On the other hand, the search for a solution on the Russia-Ukraine front, carried out with the support of the EU, stands out as an optimistic development for the markets. Technically, although BTC occasionally manages to rise above the 110,000 reference level, its inability to hold on to this level shows that bears continue to dominate the market. Liquidation data continues to stand out as a test area during this process, revealing market maker control. In the coming period, with the price losing the lower line of the minor uptrend, we will monitor the 107,400 support level, and in case of a breakout, we will follow the 106,600 liquidity area. Here, if the price fails to hold, the last reference point for maintaining levels below 105,000 appears. On the other hand, if it catches a rebound from this level, we will follow the 110,000 level and above.
Supports: 107,400 – 106,600 – 105,000
Resistances: 108,500 – 110,000 – 111,400
ETH/USDT
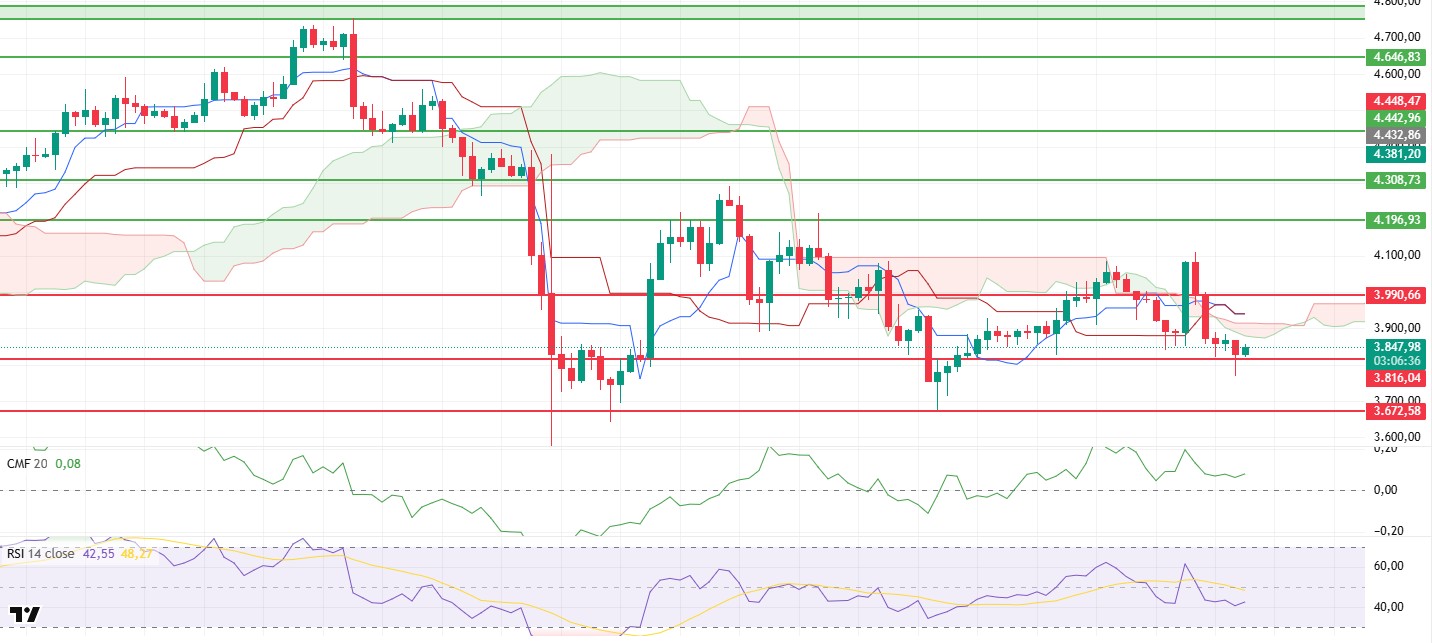
The ETH price fell to $3,770 during the day, breaking through the $3,819 support level. With the reaction at this level, the price quickly reversed direction and recovered to $3,850. This movement observed throughout the day reveals that selling pressure is still strong in the market, but buyers are actively defending the bottom levels. While volatility continues to be high in the short term, the price appears to be seeking equilibrium around $3,800.
The Chaikin Money Flow (CMF) indicator remains in positive territory. This structure indicates that liquidity is still entering the market and that the buyer side has not completely weakened. However, despite the positive CMF, the price’s inability to gain upward momentum suggests that purchases are more focused on short-term opportunities.
On the Relative Strength Index (RSI) side, there is limited change. The indicator is still trading below the 50 level, confirming the market’s weak momentum. The RSI remaining in this zone signals that the price is struggling to find direction and that a sideways or slightly downward trend could continue in the short term.
Looking at the Ichimoku indicator, the price is still trading below the kumo cloud. This indicates that the downtrend has not yet been broken technically. Furthermore, the Tenkan line trading below the Kijun line and the widening gap between them supports the continuation of short-term selling pressure. Although the price is approaching the lower boundary of the cloud, its failure to break through this area indicates that upward movements are limited for now.
Overall, the outlook reflects an unstable market structure and cautious investors. The $3,816 level stands out as the main short-term support, with closes below this level potentially deepening the decline. On the other hand, a break above $3,990 could see buyers regain strength and attempt a recovery towards the $4,050 region.
Top of Form
Below the Form
Supports: 3,816 – 3,672 – 3,500
Resistances: 3,990 – 4,196 – 4,308
XRP/USDT
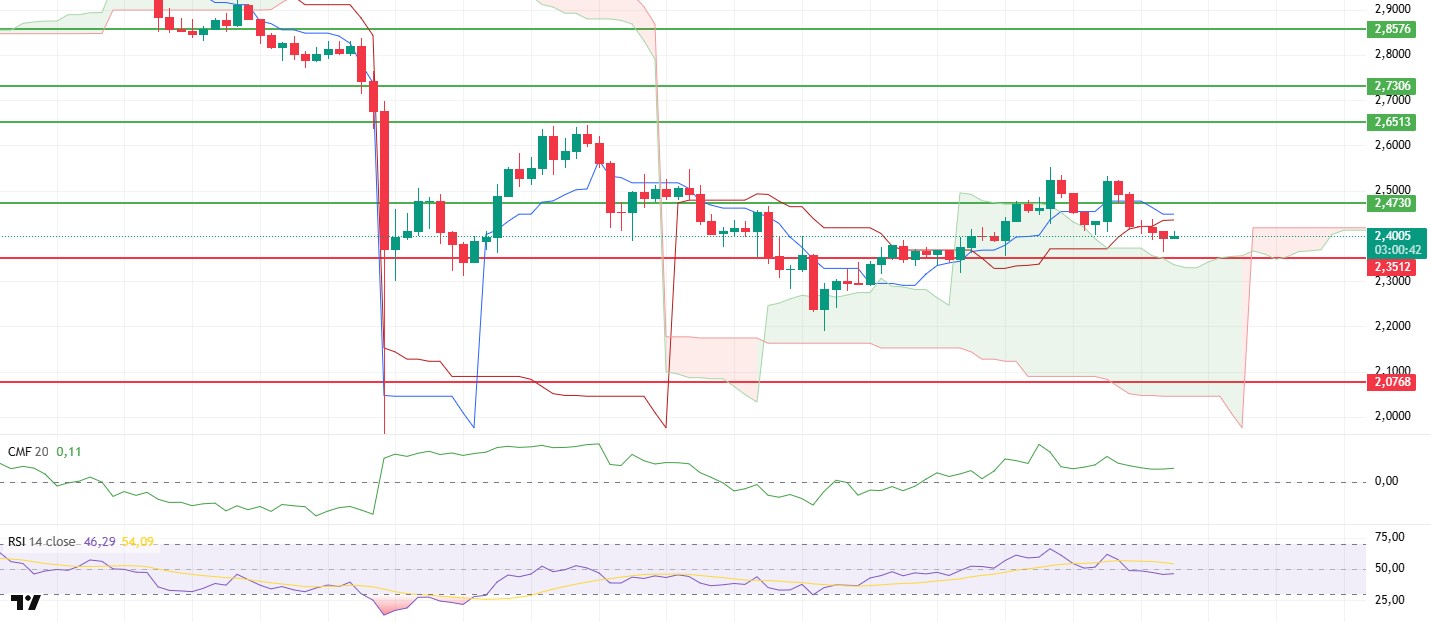
The XRP price moved within a narrow range during the day, finding support at the $2.36 level and stabilizing around $2.40 again at the end of the day. This limited price movement during the day indicates that the market is still searching for direction and that buyers and sellers are trying to establish equilibrium in the short term.
The Chaikin Money Flow (CMF) indicator remains in positive territory, but a slight pullback is noticeable. This suggests that partial liquidity outflows from the market are continuing and that the influence of buyers has diminished compared to previous days.
The Relative Strength Index (RSI) indicator continues to remain below the 50 level. The index’s inability to hold in this zone reveals that buyers remain weak and that the price is struggling to find direction in the short term.
The overall technical structure is maintained in the Ichimoku indicator. The price still trading above the kumo cloud shows that the main uptrend has not been completely broken. However, the close proximity between the tenkan and kijun lines indicates that the market is struggling to gather strength.
The overall outlook shows that XRP remains in a sideways pattern in the short term and that the $2.35 support level remains important. Closing below this level could increase selling pressure. On the upside, breaking above the $2.47 level could bring the possibility of a short-term rebound back into focus.
Supports: 2.3512 – 2.2100 – 2.0768
Resistances: 2.4730 – 2.6513 – 2.7306
SOL/USDT
Hong Kong’s first spot Solana ETF will begin trading on October 27.
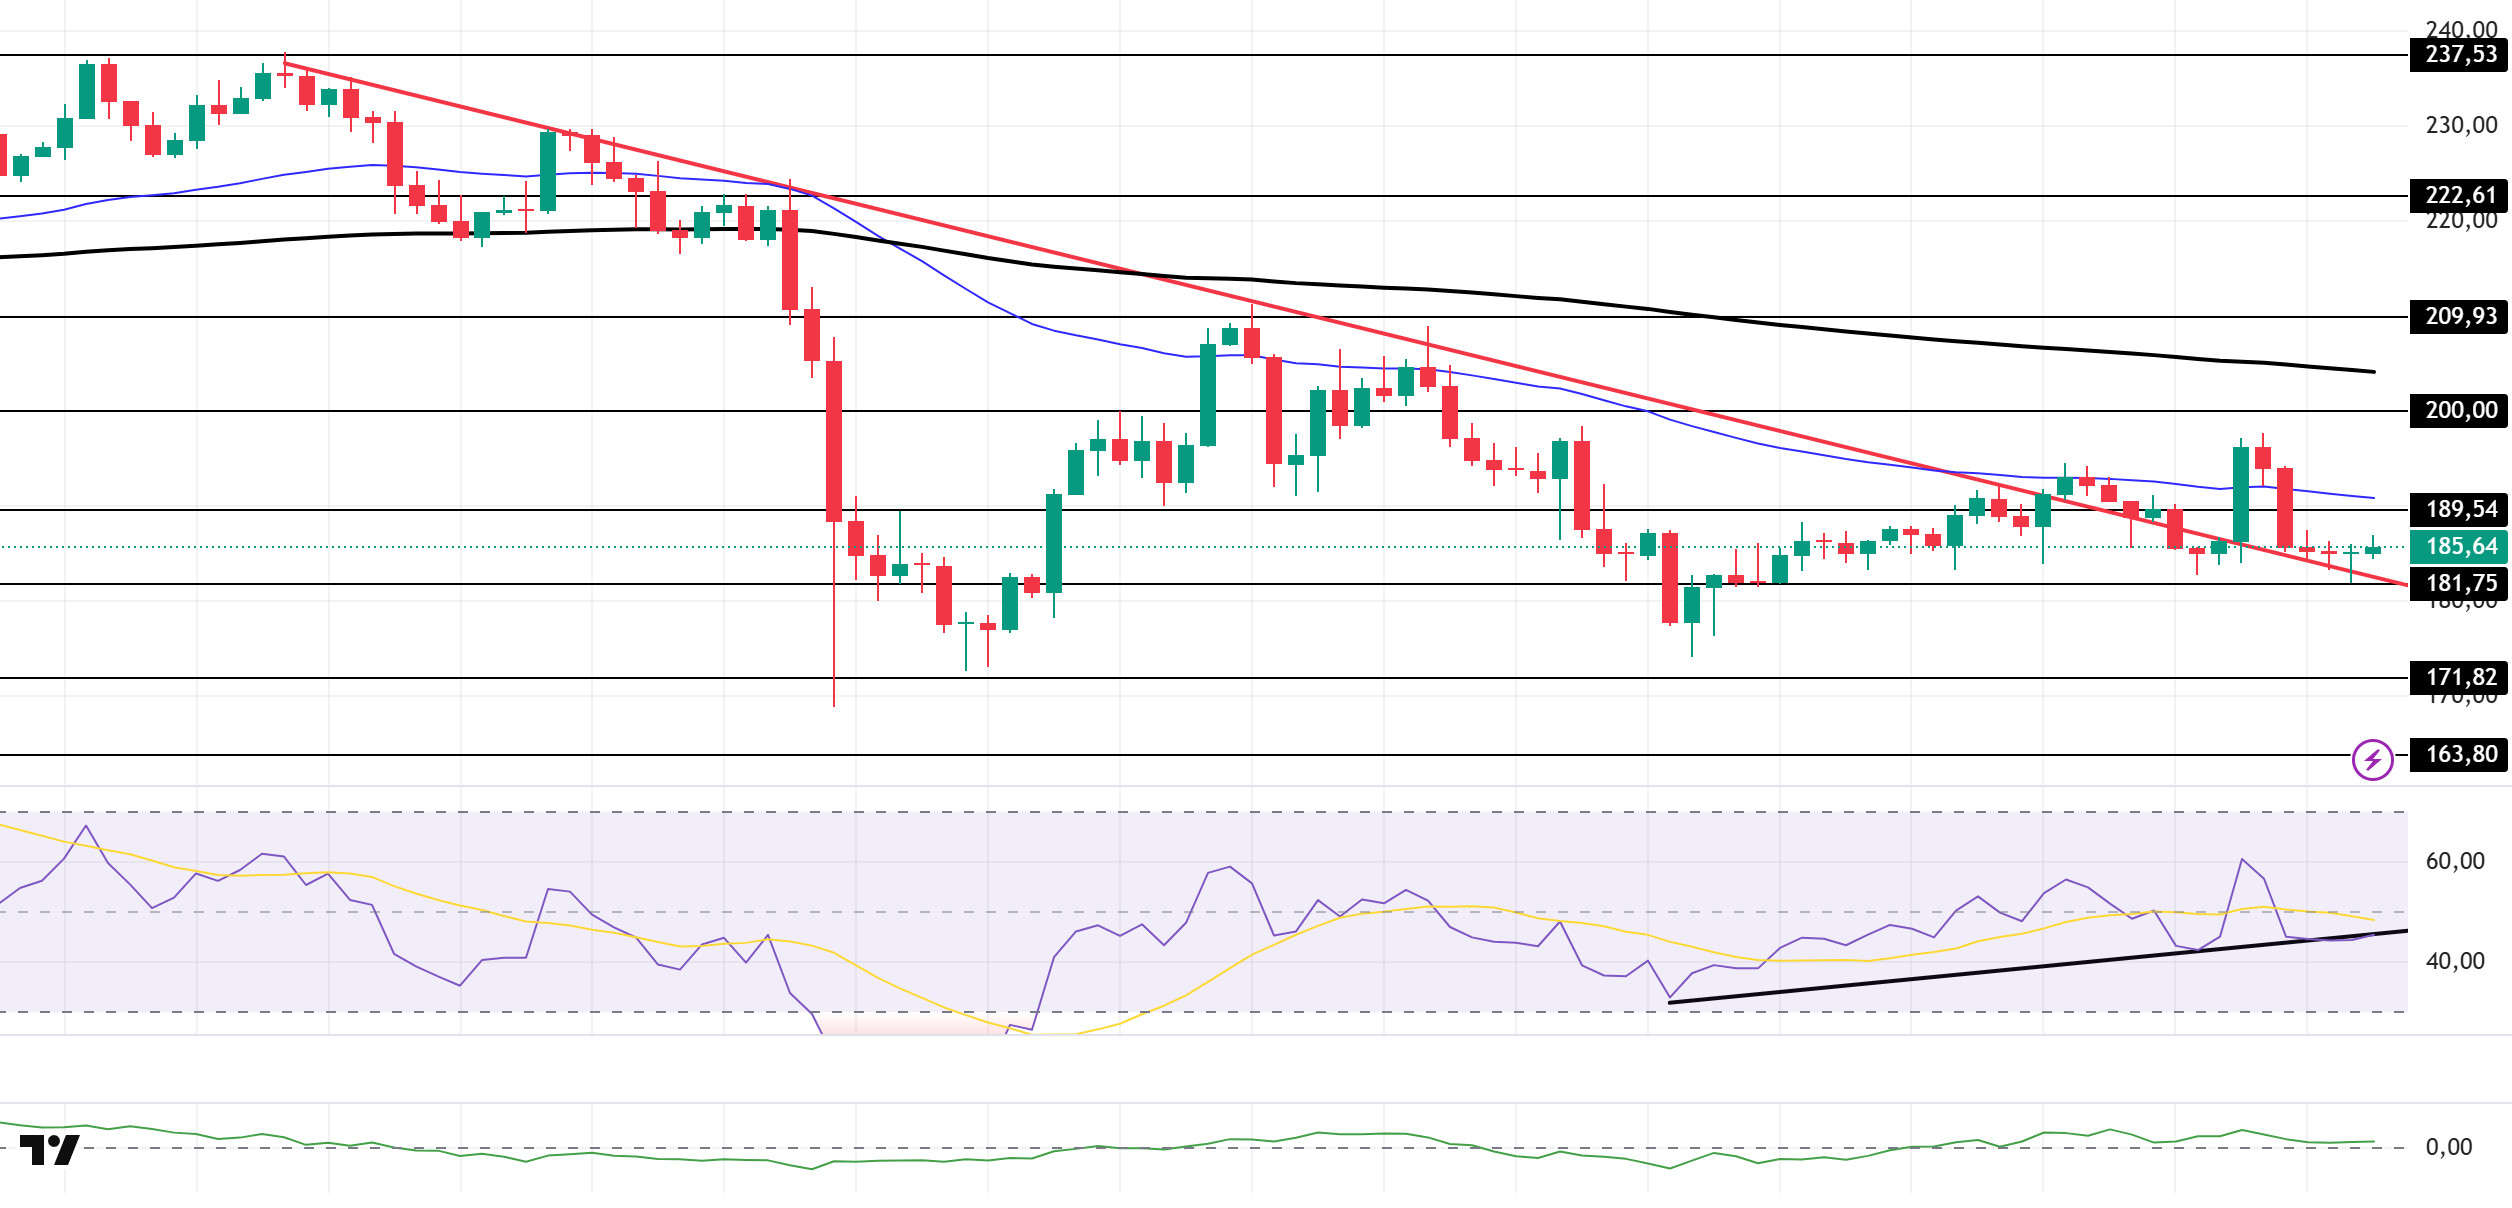
The SOL price traded sideways during the day. The asset tested the 50 EMA (Blue Line) moving average as support but broke through it, continuing its decline and experiencing a pullback. As of now, the price, which tested the support of the downward trend that began on October 6, may test the 200 EMA (Black Line) moving average as resistance if it rises from here. The $171.82 level should be monitored for candle closes below the downward trend.
On the 4-hour chart, it continued to remain below the 50 EMA (Exponential Moving Average – Blue Line) and 200 EMA (Black Line). This indicates that it may be in a downtrend in the medium term. At the same time, the price being below both moving averages shows us that the asset is in a downtrend in the short term. The Chaikin Money Flow (CMF-20) remained in positive territory. However, a decrease in money inflows could push the CMF into negative territory. The Relative Strength Index (RSI-14) is currently testing the support level of the downward trend that began on October 13. A break below this level could deepen the decline. In the event of an upturn due to macroeconomic data or positive news related to the Solana ecosystem, the $200.00 level stands out as a strong resistance point. If this level is broken upwards, the uptrend is expected to continue. In the event of pullbacks due to developments in the opposite direction or profit-taking, the $163.80 level may be tested. A decline to these support levels could increase buying momentum, presenting a potential opportunity for an upward move.
Supports: 181.75 – 171.82 – 163.80
Resistances: 189.54 – 200.00 – 209.93
DOGE/USDT
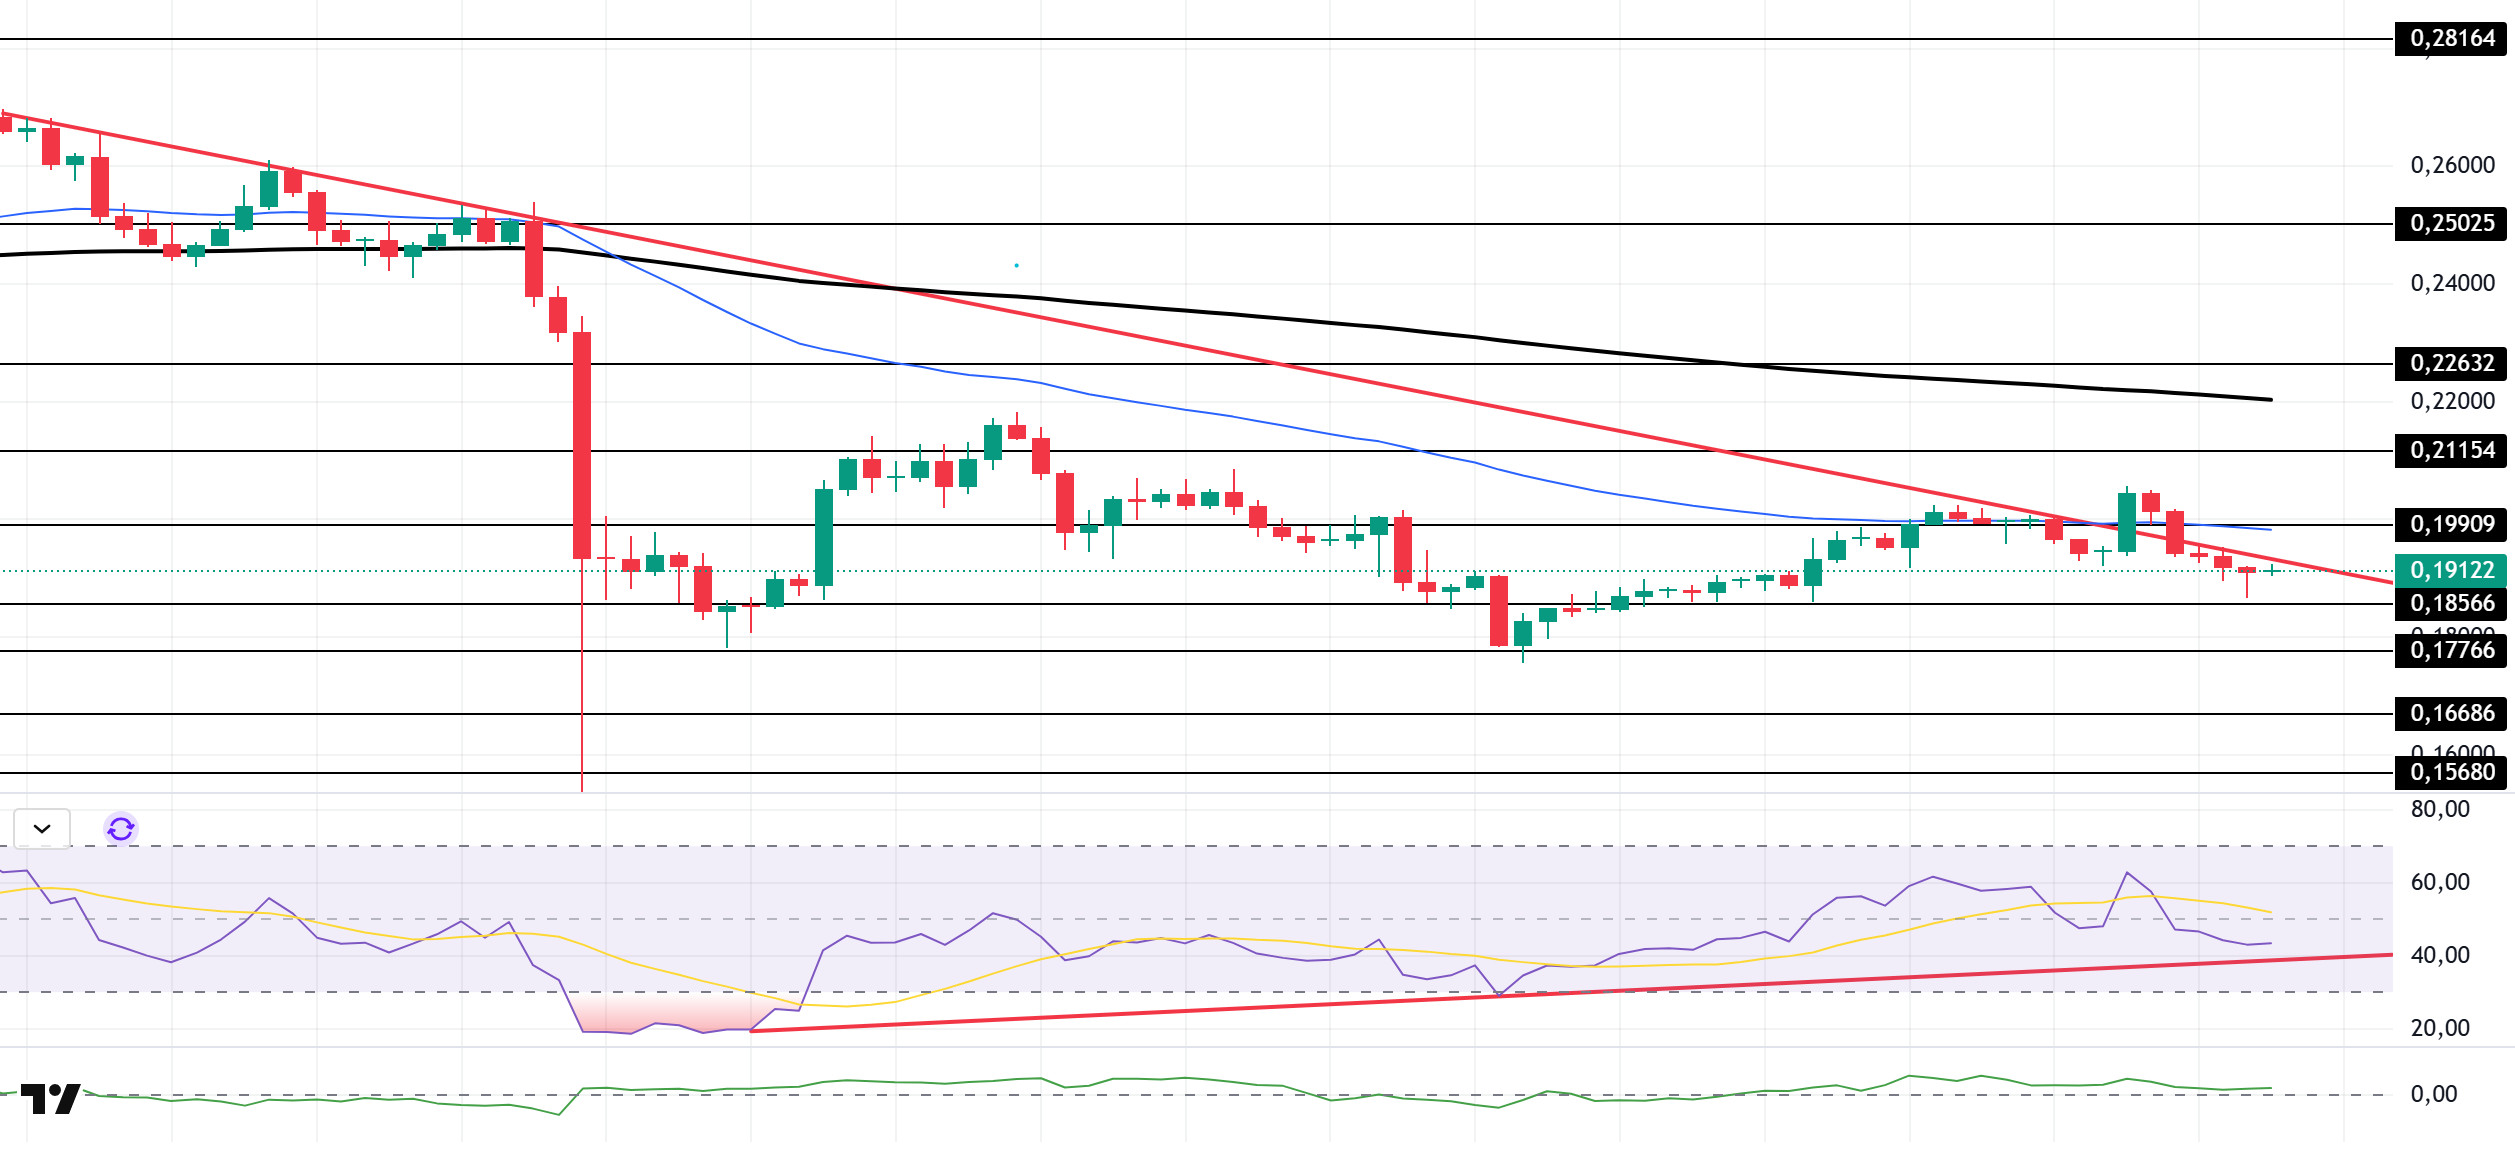
The DOGE price traded sideways during the day. The asset continues to trade in the lower region of the downtrend that began on October 6. The price, which broke below the 50 EMA (Black Line) moving average with a strong bearish candle, continued to trade in the lower region of the downtrend. If the pullback continues, the strong support level of $0.17766 should be monitored. If the uptrend begins, the 200 EMA (Black Line) moving average should be monitored.
On the 4-hour chart, the 50 EMA (Exponential Moving Average – Blue Line) remained below the 200 EMA (Black Line). This indicates that a medium-term downtrend may begin. The price being below both moving averages shows that the price is trending downward in the short term. The Chaikin Money Flow (CMF-20) continues to hold its position at a positive level. Additionally, a decrease in money inflows could push the CMF into negative territory. The Relative Strength Index (RSI-14) continues to remain above the upward trend that began on October 12. However, it is located at the midpoint of the negative zone. This indicates that selling pressure continues. In the event of an uptrend driven by political developments, macroeconomic data, or positive news flow in the DOGE ecosystem, the $0.22632 level stands out as a strong resistance zone. Conversely, in the event of negative news flow, the $0.16686 level could be triggered. A decline to these levels could increase momentum and potentially initiate a new upward wave.
Supports 0.18566 – 0.17766 – 0.16686
Resistances 0.19909 – 0.21154 – 0.22632
AVAX/USDT
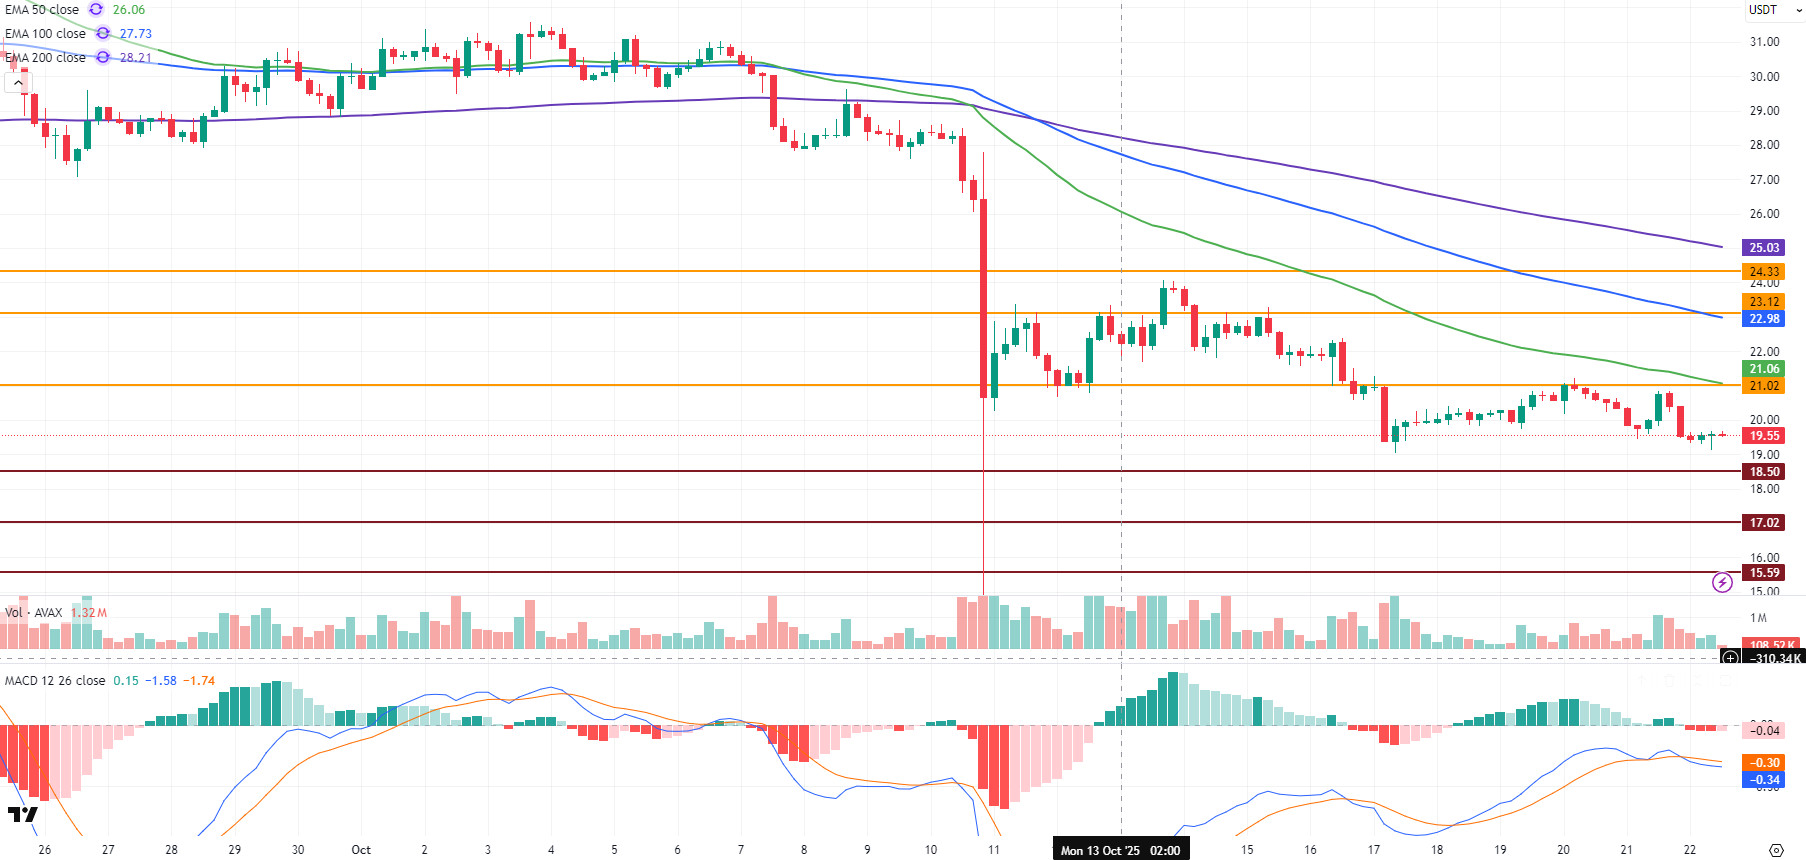
AVAX started the day at $19.54 and continues to trade in a flat band at the opening level. The ongoing uncertainty in the market is causing AVAX price movements to be weak and low-volume. Low trading volumes across the crypto market are limiting investor appetite for risk and preventing momentum from building in AVAX specifically. This is leading to increased selling pressure and making it difficult for the price to recover. On the ecosystem side, the Avalanche network has passed a significant milestone, reaching over 150 million unique addresses. This success stands out as a result of developers, the community, and projects on the network advancing the ecosystem day by day. However, despite these positive developments, the market’s generally low volume and negative trend have not yet created a noticeable positive impact on the AVAX price.
On the 4-hour chart, the Moving Average Convergence/Divergence (MACD) line continues to sit below the signal line. This outlook indicates that momentum remains weak and selling pressure persists. Furthermore, AVAX continues to trade below all critical Exponential Moving Average (EMA) levels. This technical structure confirms that the price remains in negative territory in terms of the overall trend, despite short-term recovery attempts.
From a technical perspective, the $21.02 level is the first strong resistance for AVAX. As long as this level is not breached, gains may remain limited. If there are closes above $21, the price could test the $23.12 and $24.33 resistance levels in sequence. In downward movements, the $18.50 level stands out as the first support. If there are closes below this level, selling pressure may increase, and AVAX may retreat to the $17.02 and $15.59 support levels. In the overall outlook, both the MACD and EMA indicators continue to produce negative signals. The weak momentum prevents any sustained upward movement. As long as the $21 resistance level remains unbroken, downward pressure is likely to persist. However, an increase in trading volume and stronger short-term buying interest could lead to closes above $21, signaling the start of a gradual recovery for AVAX.
(EMA50: Green Line, EMA100: Blue Line, EMA200: Purple Line)
Supports: 18.50 – 17.02 – 15.59
Resistances: 21.02 – 23.12 – 24.33
LINK/USDT
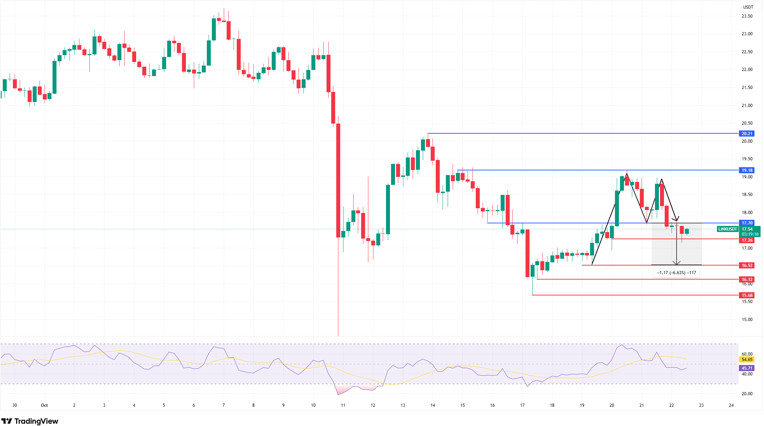
In our morning analysis, we stated that as long as the price remained above $17.70, the upward movement could gain momentum and that the $19.37 level was the first target. However, although the price moved towards this resistance zone during the day, it continued to face selling pressure in short time frames, limiting its upward movement.
In the current outlook, we see that after LINK reversed from the $19.37 zone, it is now showing an attempt to recover towards the resistance zone at the $17.70 level. However, as long as there is no 4-hour close above this level, the double top formation mentioned in our morning analysis will remain valid, and downward price movements will continue to be supported. In this case, the possibility of the price retreating to the support zones of $17.26, $16, and $15, respectively, technically creates a strong scenario. In such a case, a decline of around 6-8% seems quite likely.
Conversely, in upward movements, it is important for the price to close above the $17.70 resistance level with high volume and for the current formation structure to break down. In such a case, our first target would be $19, followed by the $20 level. However, it is important to remember that there is not yet a strong momentum to support this scenario in the current structure.
The Relative Strength Index (RSI) indicator is currently at 44 levels and is moving in the negative zone. The RSI’s weak performance in line with price movements indicates that momentum is still in the hands of sellers and that a cautious stance should be maintained in the short term.
Support levels: 17.26 – 16.52 – 16.12
Resistances: 17.70 – 19.18 – 21.21
Legal Notice
The investment information, comments, and recommendations contained herein do not constitute investment advice. Investment advisory services are provided individually by authorized institutions taking into account the risk and return preferences of individuals. The comments and recommendations contained herein are of a general nature. These recommendations may not be suitable for your financial situation and risk and return preferences. Therefore, making an investment decision based solely on the information contained herein may not produce results in line with your expectations.


