
Technical Analysis
BTC/USDT
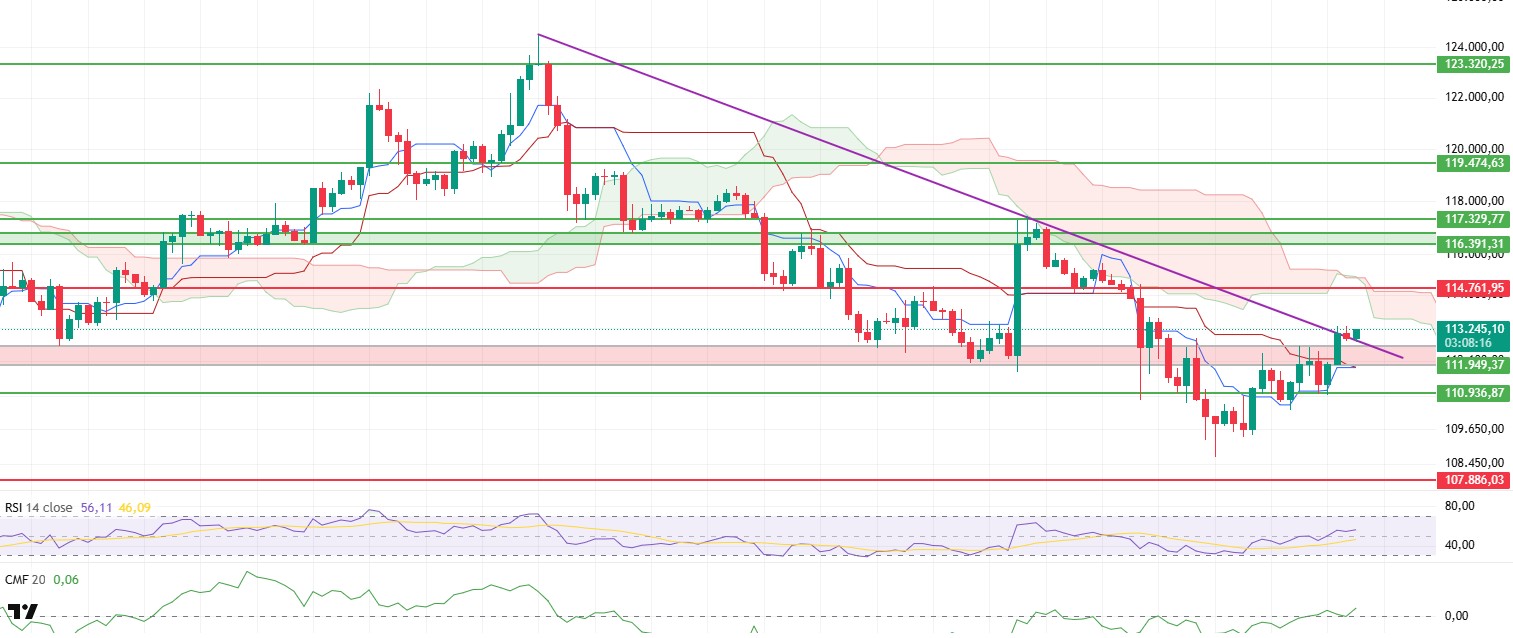
After breaking the downward trend line indicated by the purple line on the chart during the day, the BTC price performed a retest towards this level and continued its upward movement as buyers re-entered the market following this retest. This breakout indicates that short-term pressure in the market has eased and that the upward movement is now on a stronger footing. The buying intensity observed during the retest confirms that the price is accepting this area as support, technically supporting the upward scenario.
When examining technical indicators, it is noteworthy that the Chaikin Money Flow (CMF) indicator retreated to the zero line and then rebounded from this level with support. This movement signals that fresh liquidity entering the market is strengthening and that buying appetite, especially in the spot market, continues to increase. The rising liquidity flow stands out as one of the most critical factors supporting price movement, and if the current momentum is maintained, a stronger upward trend becomes possible.
The Relative Strength Index (RSI) remaining above the 50 level is another important factor supporting the upward momentum of the price. The RSI holding in this region indicates that buyers are still dominant in the market and that the uptrend is progressing on a healthy footing. In particular, the stable outlook above the 50 level suggests that the price could maintain its upward momentum in the medium term, even if it experiences sudden pullbacks.
The buy signal formed by the tenkan level crossing above the kijun level in the Ichimoku indicator, combined with the trend breakout, presents a strong technical signal. Although this crossover indicates that buyers have taken control in the short term, the price is still below the kumo cloud, preventing the signal from being fully confirmed. This situation suggests that the rise could accelerate more rapidly if the price breaks above the cloud level, but caution is needed at the current position.
When evaluating the overall outlook, if the price maintains the purple trend line in the evening hours, targeting the $114.761 level appears to be a strong possibility. However, a breach below this line or the $111.949 level could reignite selling pressure. In such a scenario, the price may be pulled back into the correction zone in the short term, and momentum may weaken.
Support levels: 111,949 – 110,936 – 107,886
Resistance levels: 114,761 – 116,391 – 117,329
ETH/USDT
During the day, ETH retested the critically important and frequently monitored $4,634 kijun resistance level. The selling pressure at this level caused the price to retreat and settle within the kumo cloud, indicating that buyers lacked sufficient strength in the short term. However, with increased buyer interest in recent hours, the price continues its upward attempts and signals a short-term recovery in the market. The increase in volume, in particular, confirms that buyers remain in the market and that the possibility of an uptrend is still alive.
The Chaikin Money Flow (CMF) indicator maintaining its upward trend in positive territory reveals that liquidity inflows continue and buyer appetite remains strong. This movement shows that strong buying demand, especially in the spot market, is supporting the price and that the upward movement is progressing on a healthy footing. The strong liquidity flow suggests that sudden pullbacks may be limited in the short term.
The fact that the price moves between both the tenkan and kijun levels in the Ichimoku indicator and is priced close to the kumo cloud boundaries indicates that a clear trend direction has not been established. This outlook signals that uncertainty persists in the market and that a strong breakout is needed to determine the direction. It is estimated that if the price rises above the kumo cloud, the upward movement could gain stronger momentum, but as long as it remains within the cloud, a volatile trend may continue.
The Relative Strength Index (RSI) moving sideways above the 50 level is another factor supporting the market’s indecisive structure. This outlook, which indicates that momentum has begun to weaken somewhat, reveals that despite buyers remaining dominant, additional support signals are needed for the upward movement to accelerate. In particular, the RSI showing a clearer upward trend above the 50 level is critical for the acceleration of the upward movement.
When evaluating the overall outlook, if the price breaks through the kijun resistance at $4,634, aggressive buying could lead to sharp and rapid price movements. However, if the price breaches the $4,551 level downward, the possibility of increased selling pressure and the price retreating back to the lower band of the kumo cloud at $4,476 should not be overlooked.
Support levels: 4,551 – 4,369 – 4,277
Resistance levels: 4,857 – 5,000 – 5,346

XRP/USDT
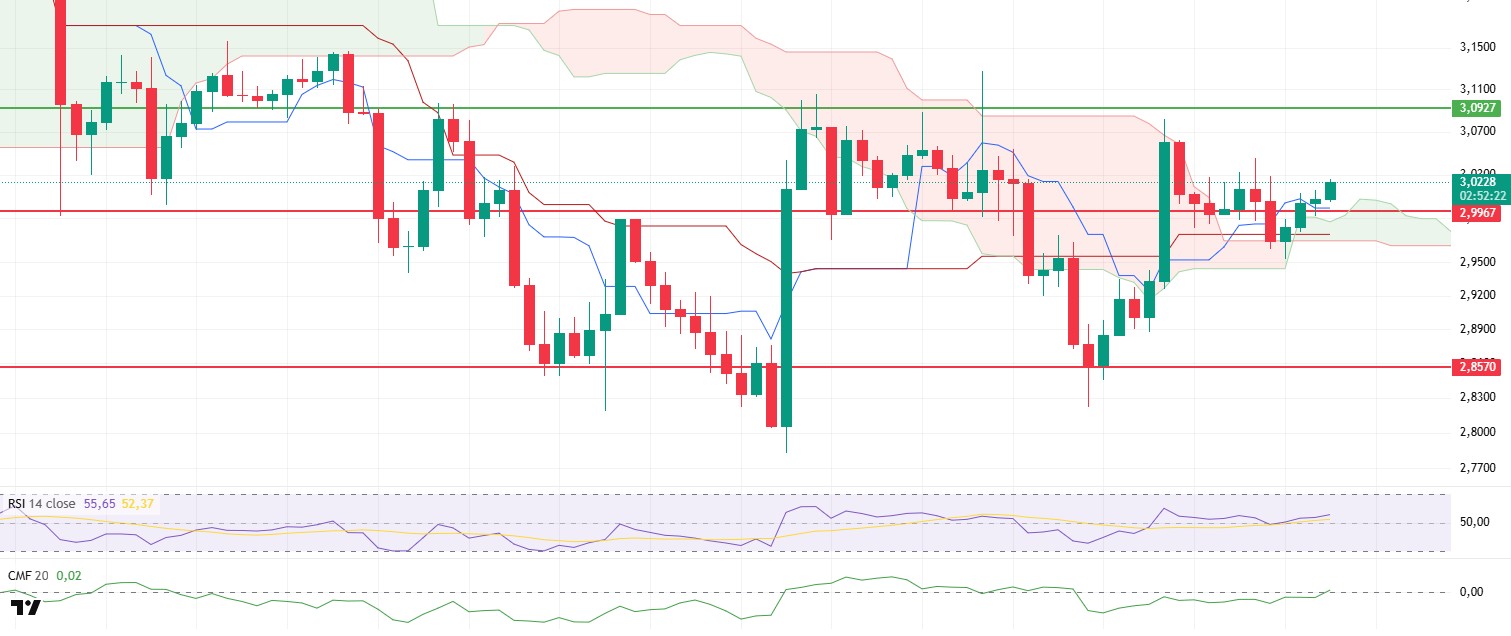
XRP maintained its main support zone at $2.99 during the day and showed a slight increase with the reaction it received from this level, testing the $3.02 level. The upward movement from this region during the day shows that the support level remains strong and that buyers are determined to maintain the price. In particular, the fact that this support level has become a critical defense point for short-term buyers stands out as one of the most important factors supporting upward attempts in the price.
The Chaikin Money Flow (CMF) indicator moving into positive territory reveals that liquidity entering the market has increased and buyer appetite has regained strength. The CMF maintaining its upward trend confirms that the price movement is supported by volume, while also solidifying the upward scenario on a more stable footing. The continued strength of liquidity flow is a critical factor that enhances the likelihood of the price holding above $2.99.
The Relative Strength Index (RSI) indicator remaining above both the 50 level and the short-term moving average signals that upward momentum is being maintained. The RSI’s slightly upward trend indicates that buyers continue to dominate the market and that the rise is progressing on a healthy footing. However, the RSI not falling below the 50 level is an important signal that the short-term trend remains intact.
In the Ichimoku indicator, the price remaining above both the tenkan and kijun levels and moving outside the kumo cloud confirms that the short-term and overall technical structure remains positive. The preservation of the positive divergence between tenkan and kijun indicates that the rise is technically supported. However, it should be noted that volatility may increase and short-term directional searches may come to the fore if the price approaches the kumo cloud.
When evaluating the overall outlook, if XRP remains above the key support zone of $2.99, a move towards the resistance line at $3.09 can be expected to continue. If this level is broken, upward momentum could accelerate, and the $3.30 level could become the target. However, a downward breach of the $2.99 level could cause momentum to weaken and selling pressure to intensify. In such a scenario, the price could return to the kumo cloud and experience a deepening pullback towards the $2.85 level.
Supports: $2.9967 – $2.8570 – $2.6513
Resistances: 3.0927 – 3.3058 – 3.6554
SOL/USDT
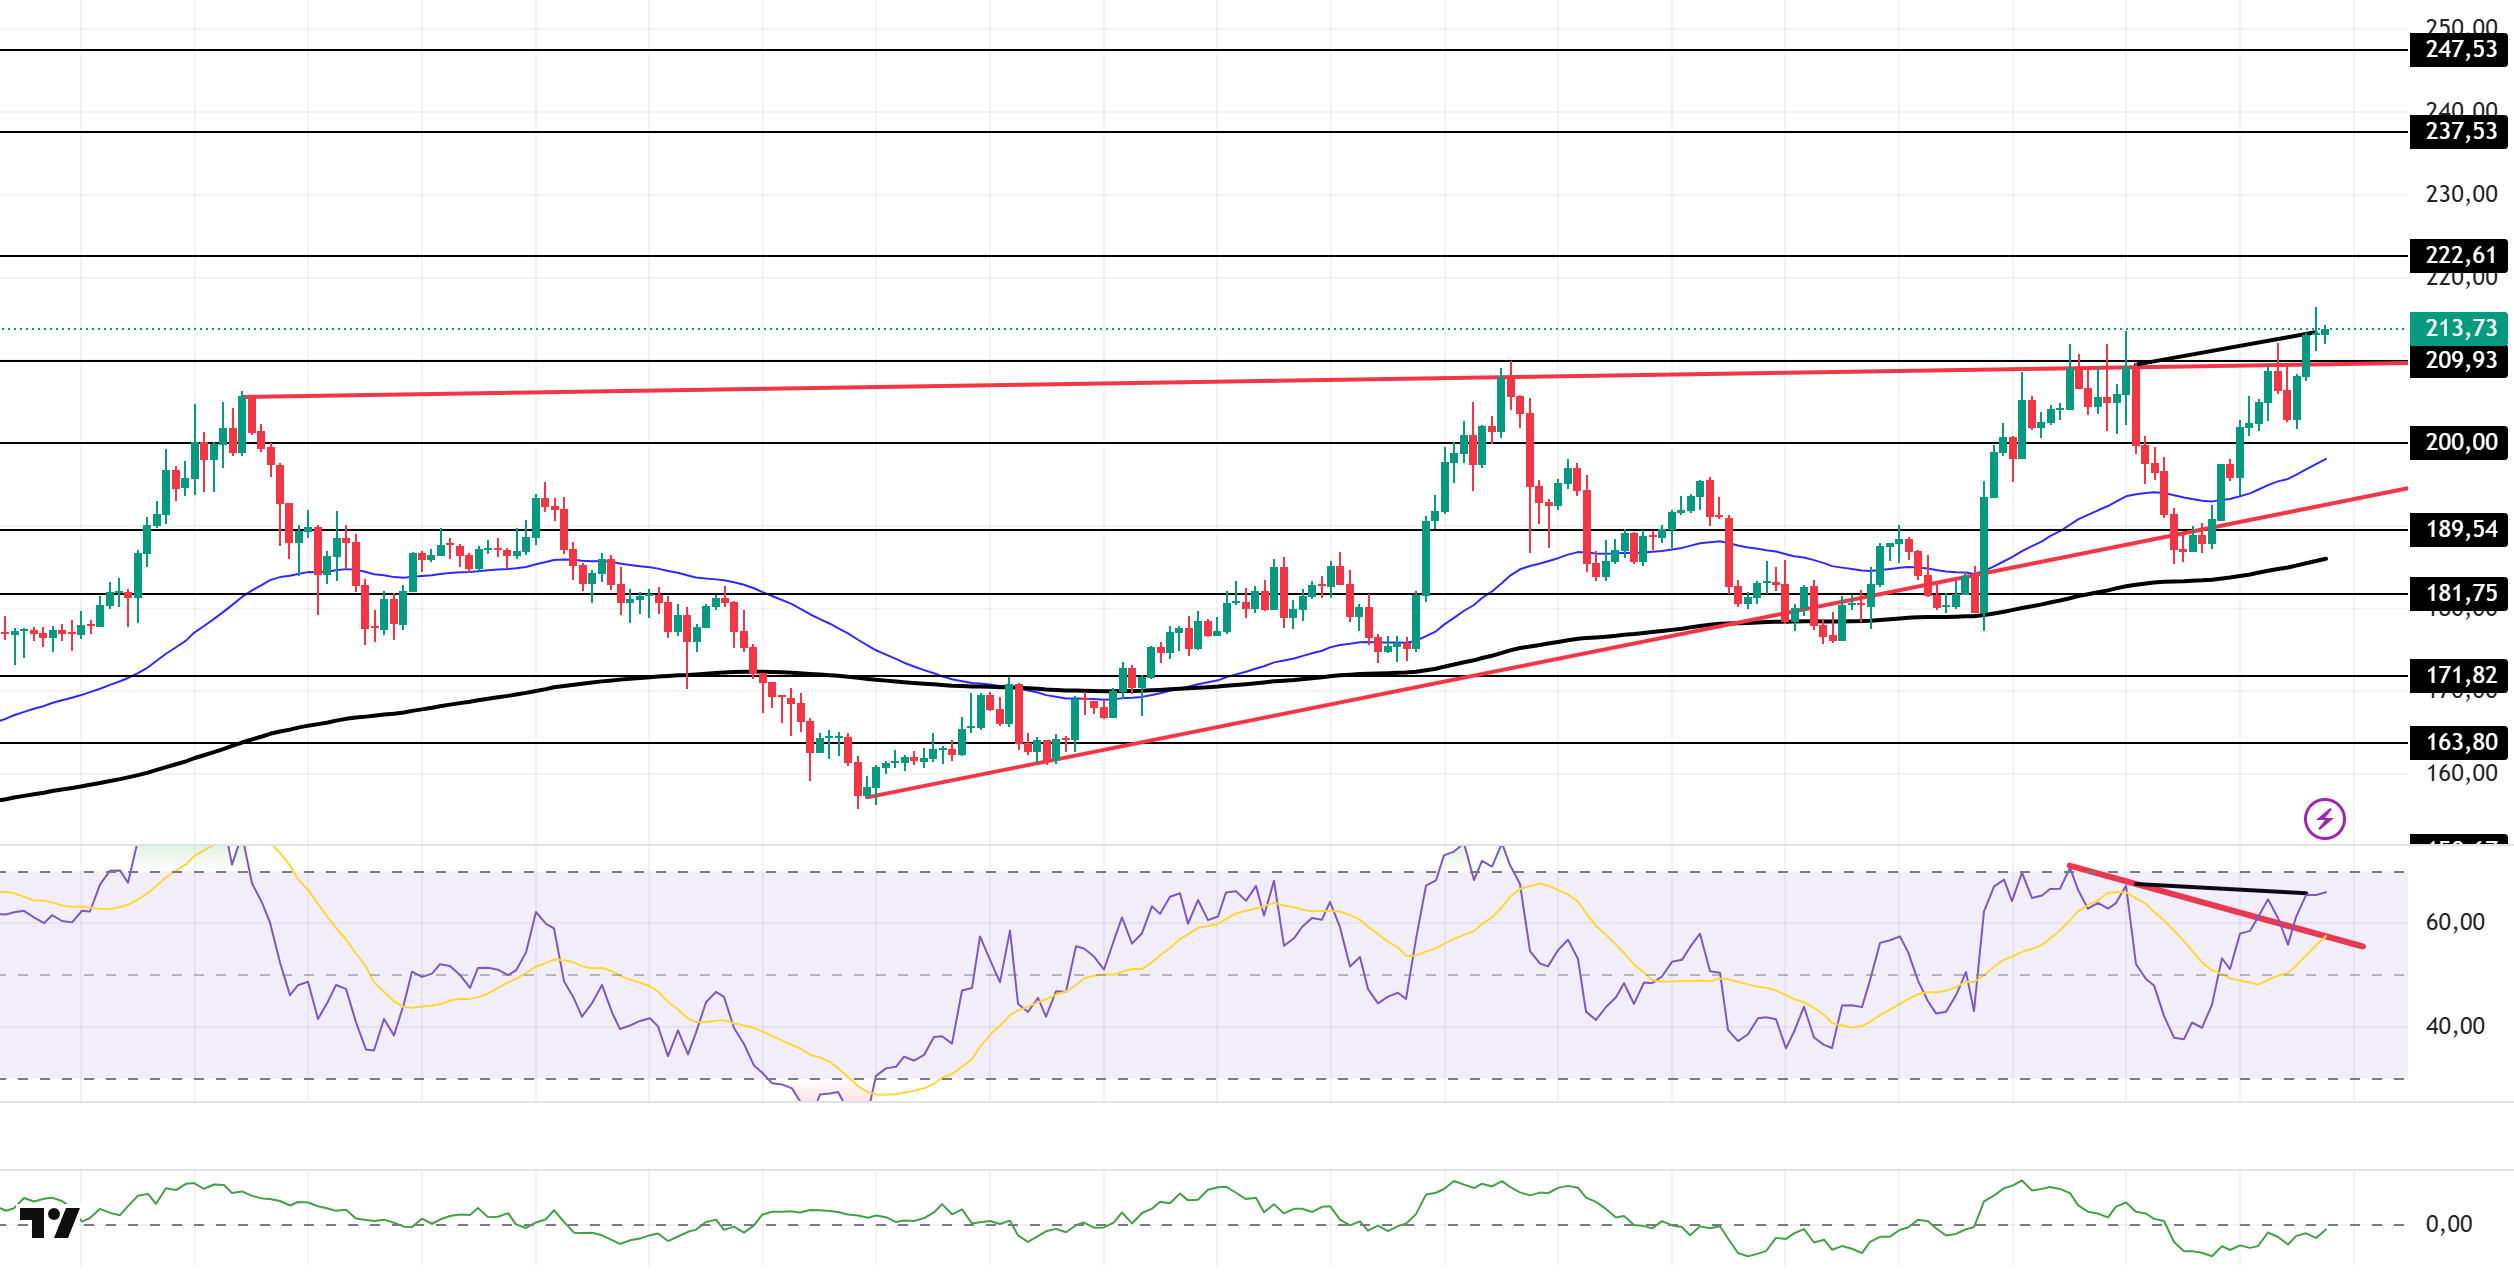
Solana has begun voting on the Alpenglow upgrade (SIMD-0326), which aims to replace Proof-of-History and TowerBFT with a faster consensus system that finalizes blocks in just 100-150 milliseconds.
The SOL price traded sideways during the day. The asset broke above the ceiling level of the rising wedge formation that began on August 2 and maintained its momentum. If the uptrend continues, the $222.61 level can be monitored. If a pullback begins, the $209.93 level could be retested, and the formation’s ceiling level could be retested as support.
On the 4-hour chart, the 50 EMA (Exponential Moving Average – Blue Line) remained above the 200 EMA (Black Line). This indicates that the medium-term upward trend may continue. At the same time, the price being above both moving averages shows us that the market is trending upward in the short term. The Chaikin Money Flow (CMF-20) remained in negative territory. However, an increase in money inflows could push the CMF into positive territory. The Relative Strength Index (RSI-14) continues to remain above the downtrend that began on August 24. This indicates that buying pressure persists. However, a bearish divergence could cause a pullback. If there is an uptrend due to macroeconomic data or positive news related to the Solana ecosystem, the $222.61 level stands out as a strong resistance point. If this level is broken upwards, the uptrend is expected to continue. Conversely, if there are developments in the opposite direction or pullbacks occur due to profit-taking ( ), the $200.00 level may be tested. A retreat to these support levels could increase buying momentum, presenting a potential opportunity for an uptrend.
Supports: 209.93 – 200.00 – 189.54
Resistances: 222.61 – 237.53 – 247.53
DOGE/USDT
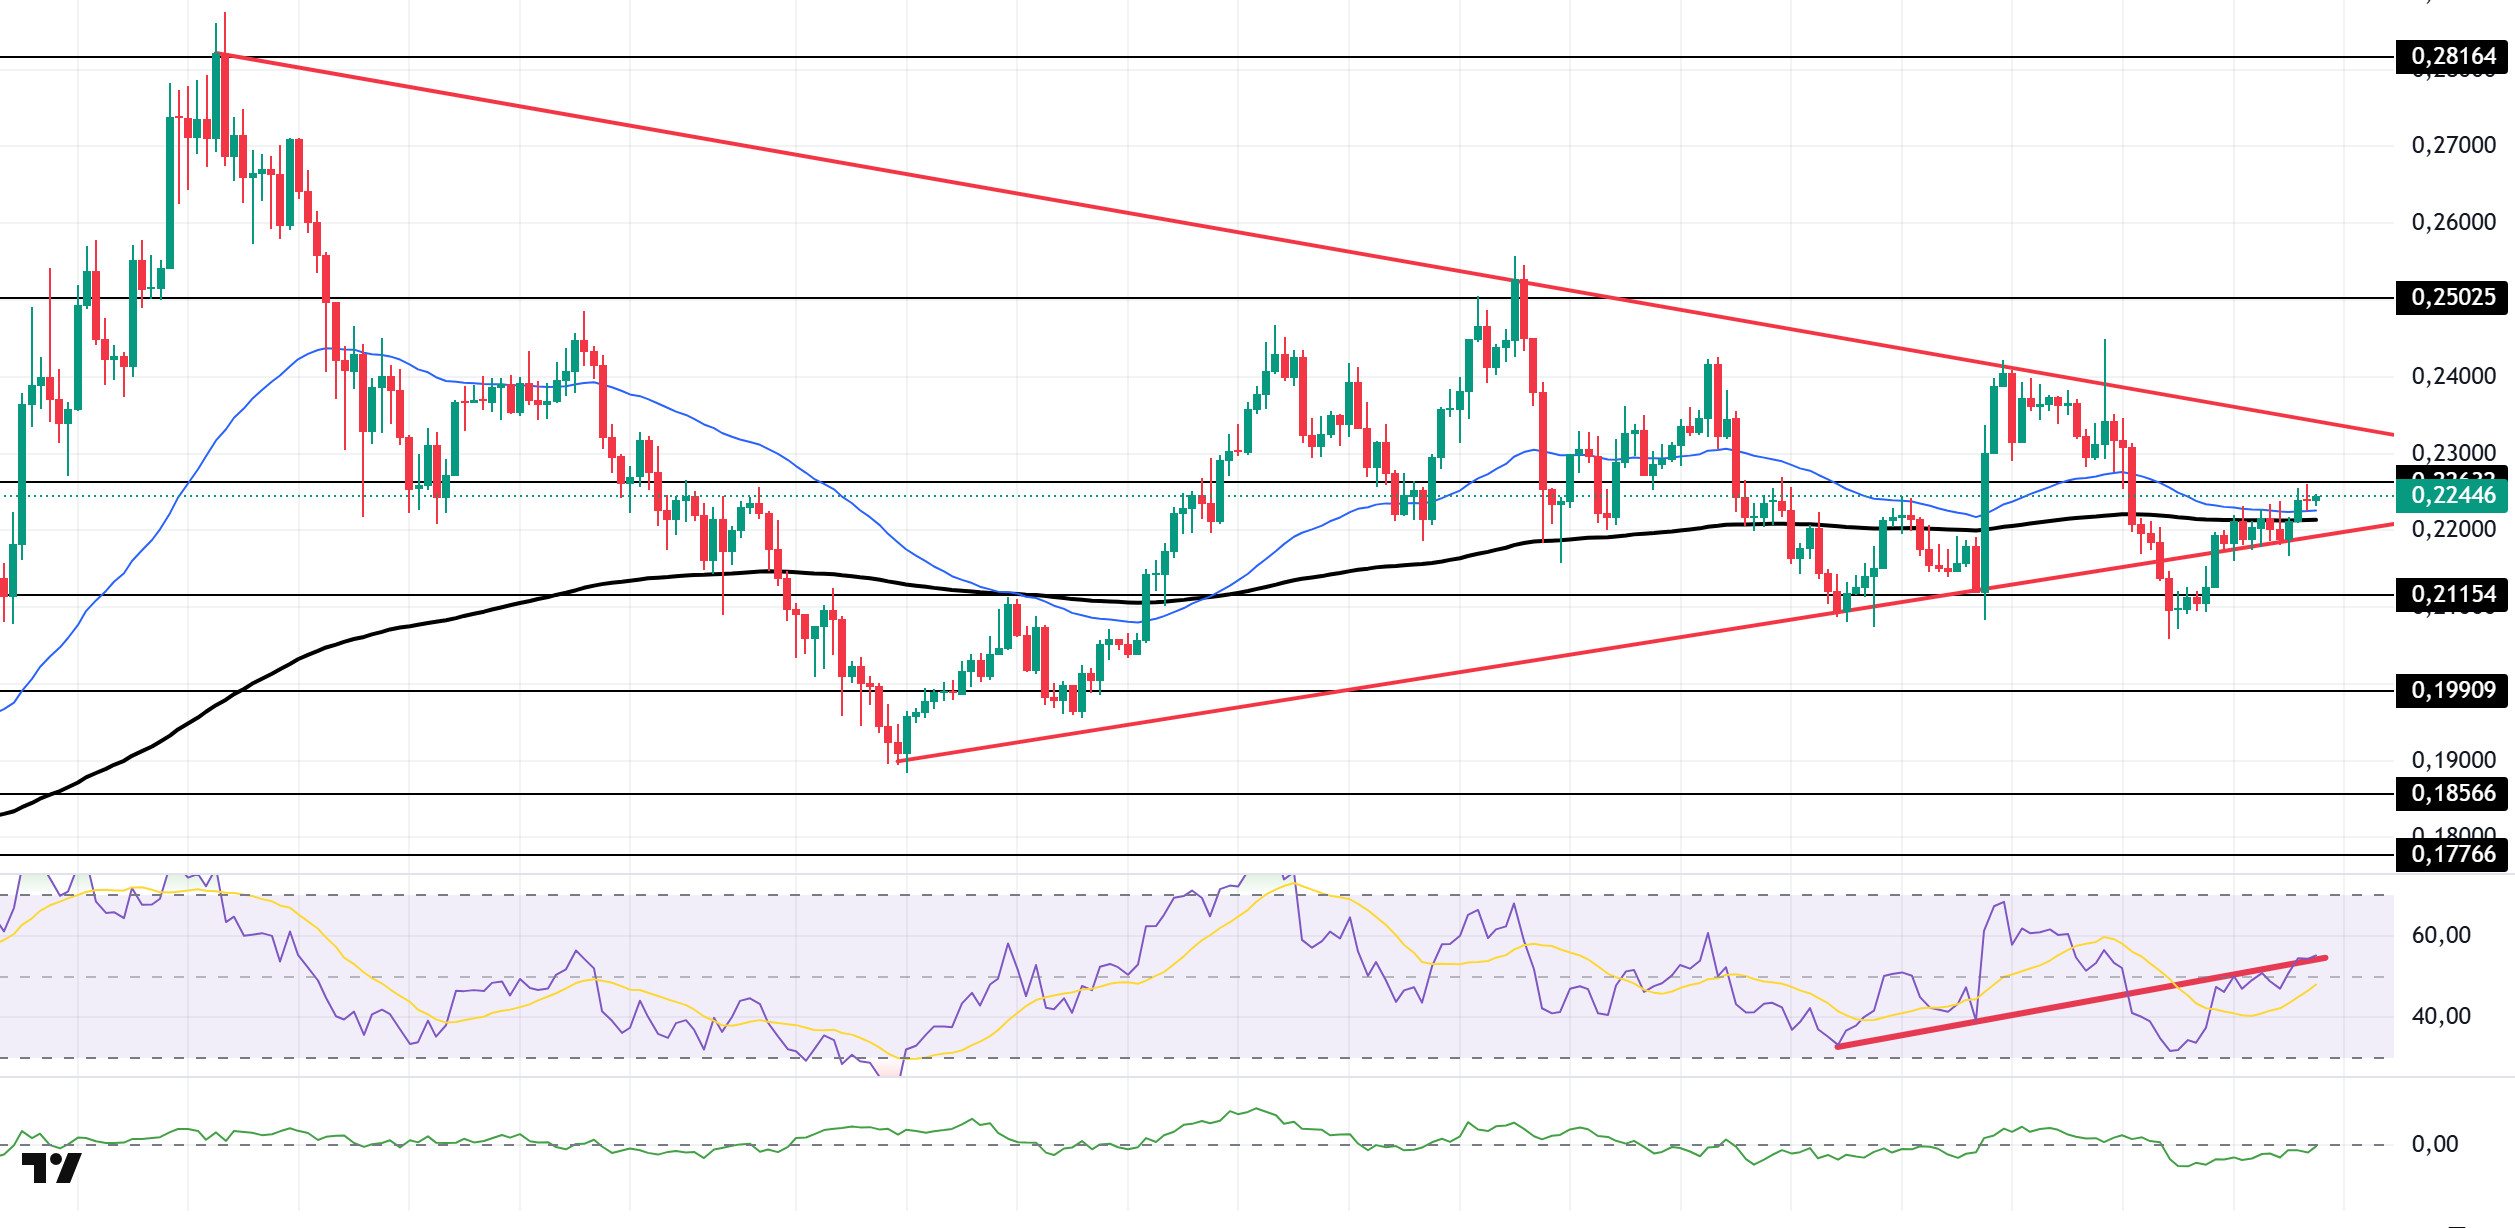
The DOGE price continued to trade sideways during the day. The asset remains within the symmetrical triangle formation that began on August 2. As of now, the price has broken above the 50 EMA (Exponential Moving Average – Blue Line) and 200 EMA (Black Line) moving averages. If the uptrend continues, the $0.22632 level should be monitored. In case of a pullback, the $0.21154 level should be monitored.
On the 4-hour chart, the 50 EMA (Blue Line) continues to remain above the 200 EMA (Black Line). This indicates that the asset is in an upward trend in the medium term. The price being above both moving averages also signals that the asset is trending upward in the short term. The Chaikin Money Flow (CMF-20) has risen to a neutral level. Additionally, an increase in money inflows could push the CMF into positive territory. The Relative Strength Index (RSI-14) continues to remain in positive territory. At the same time, it is currently testing the resistance level of the upward trend that began on August 19. If it breaks through, upward pressure may increase. In the event of an upward movement driven by political developments, macroeconomic data, or positive news flow in the DOGE ecosystem, the $0.25025 level stands out as a strong resistance zone. Conversely, in the event of negative news flow, the $0.21154 level could be triggered. A decline to these levels could increase momentum and potentially initiate a new upward wave.
Supports: $0.21154 – $0.19909 – $0.18566
Resistances: 0.22632 – 0.25025 – 0.28164
TRX/USDT
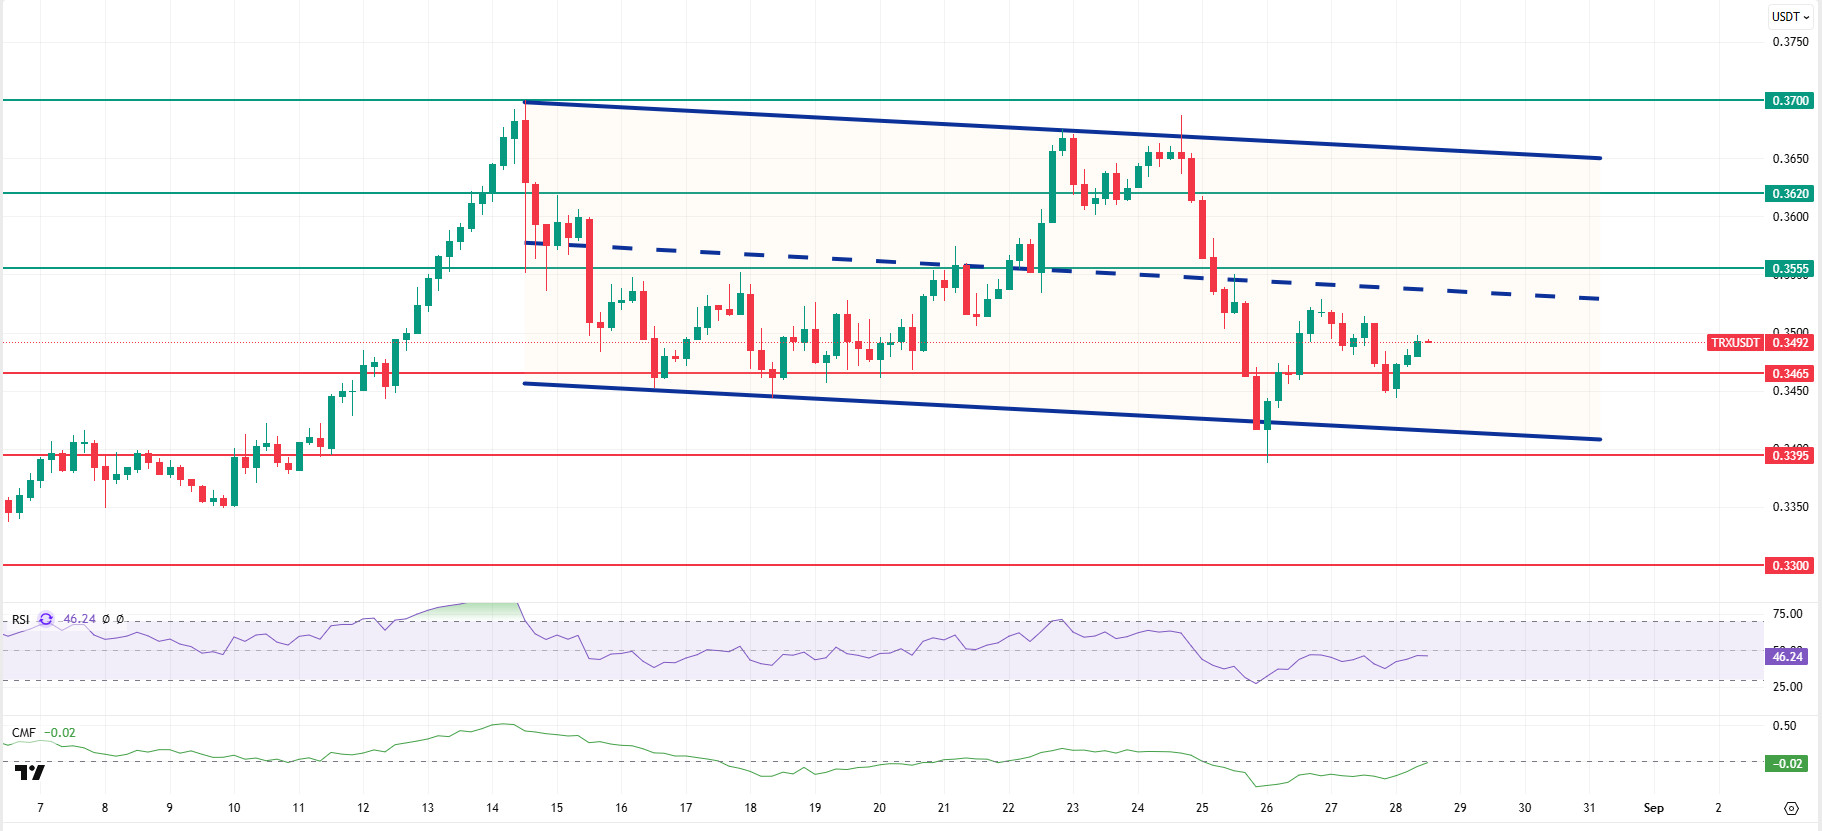
As mentioned in this morning’s analysis, despite the recent rise, TRX remains below the 0.3555 support level and is currently trading at 0.3492 due to incoming buy orders. Currently located just below the middle band of the bearish channel, TRX is hovering near the 0.3465 support level on the 4-hour chart. The Relative Strength Index (RSI) value is priced at 46 in the sell zone. In addition, the Chaikin Money Flow (CMF) indicator is approaching zero with a value of -0.02. The CMF’s move from negative territory to zero can be seen as an indication of increased cash inflows.
In light of all these indicators, TRX may continue its movement within the bearish channel in the second half of the day, rising slightly to test the 0.3555 resistance. With a candle close above this resistance, it may continue to rise and move towards the middle and upper bands of the channel, seeking to test the 0.3620 resistance. If it fails to close above the 0.3555 resistance level, capital outflows may continue due to the CMF remaining in negative territory, causing it to move towards the lower band of the channel. As a result, it may test the 0.3465 and 0.3395 support levels in sequence.
On the 4-hour chart, 0.3300 is an important support level, and as long as it remains above this level, the upward trend is expected to continue. If this support level is broken, selling pressure is expected to increase.
Supports: 0.3465 – 0.3395 – 0.3300
Resistances: 0.3555 – 0.3620 – 0.3700
SUI/USDT
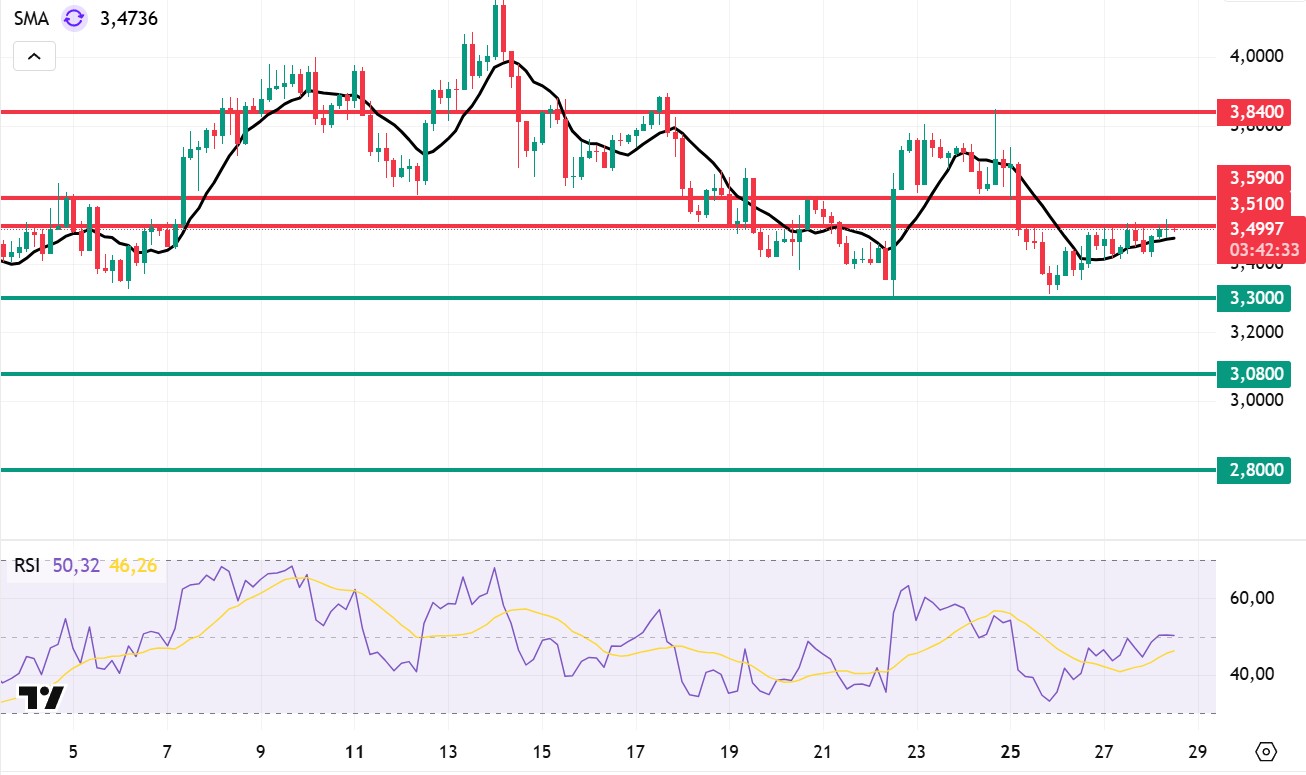
Looking at Sui’s technical outlook, we see that the price has declined on a weekly basis to around $3.49, influenced by fundamental developments. The Relative Strength Index (RSI) is currently in the range of 50.32 – 46.26. This range indicates that the market is trading close to the sell zone; however, if the RSI weakens and falls to the 30.00 – 35.00 range, it could signal a potential buying point. If the price moves upward, the resistance levels of $3.51, $3.59, and $3.84 can be monitored. However, if the price falls to new lows, it could indicate that selling pressure is intensifying. In this case, the $3.30 and $3.08 levels stand out as strong support zones. In particular, in the event of a sharp sell-off, a pullback to $2.80 appears technically possible.
According to Simple Moving Averages (SMA) data, Sui’s average price is currently at $3.47. The price remaining below this level indicates that the current downtrend could technically continue. The downward trend of the SMA also supports this situation.
Support levels: 2.80 – 3.08 – 3.30
Resistances: 3.51 – 3.59 – 3.84
Legal Notice
The investment information, comments, and recommendations contained herein do not constitute investment advice. Investment advisory services are provided individually by authorized institutions taking into account the risk and return preferences of individuals. The comments and recommendations contained herein are of a general nature. These recommendations may not be suitable for your financial situation and risk and return preferences. Therefore, making an investment decision based solely on the information contained herein may not produce results in line with your expectations.

