
Technical Analysis
BTC/USDT
White House Director of Cryptocurrency and Artificial Intelligence David Sacks announced that the US is approaching a historic turning point in crypto legislation, noting that “concrete progress” has been made on a bipartisan bill in the Senate. On the Asian front, Japan-based Mac House continued its long-term reserve strategy, increasing its total Bitcoin holdings to 124.8 BTC with an additional purchase of 6.37 BTC. Meanwhile, BlackRock accelerated its institutional portfolio rebalancing by transferring $478.5 million worth of BTC and ETH in the last 24 hours.
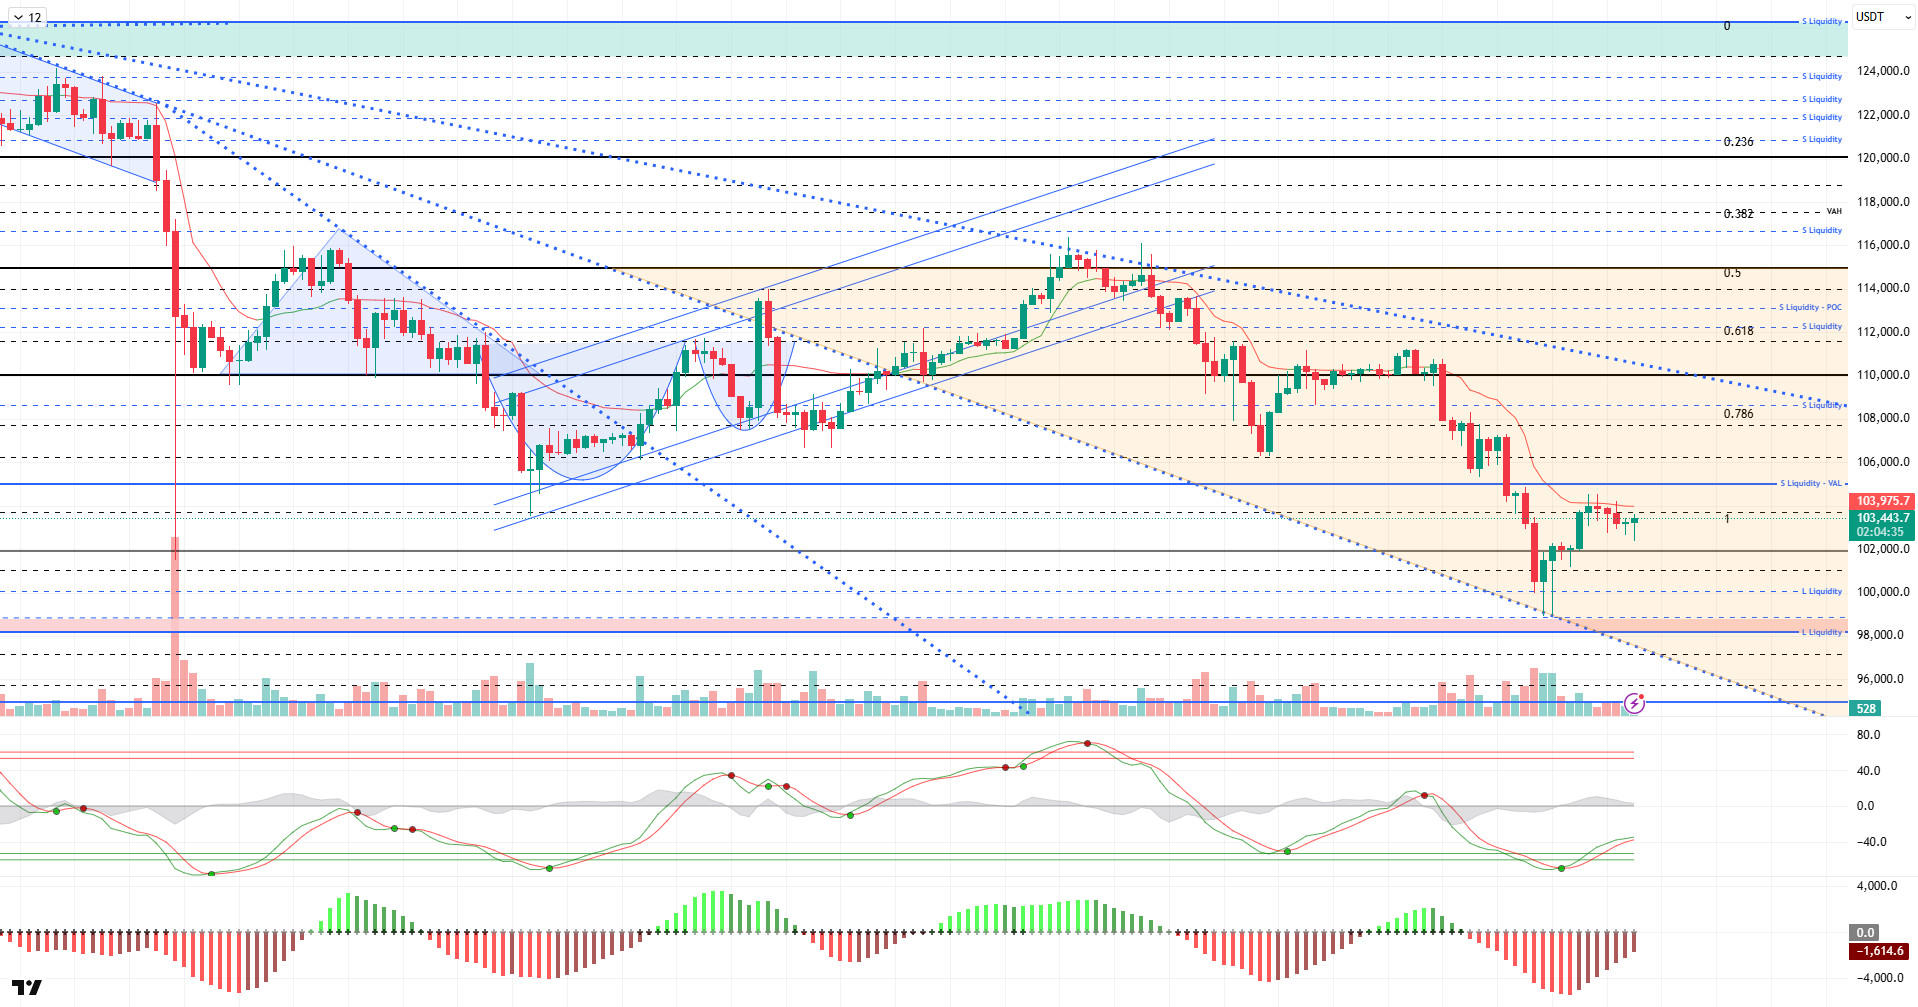
From a technical perspective, BTC continues its upward reaction after touching the lower line of the falling trend band, but it is noteworthy that the rise remains a “dead cat bounce.” In the previous analysis, the price reached the 104,500 level but could not stay there and continues to trade just above the 103,000 level at 103,400.
Technical indicators show that the Wave Trend (WT) Oscillator is weakening just above the oversold zone, parallel to the buy signal it gave, while the Squeeze Momentum (SM) indicator continues to attempt to gain strength after reaching maximum weakness in the negative zone. The Kaufman Moving Average (KAMA) is currently at $104,030, positioned above the price.
According to liquidation data, investors who seized the opportunity during the recent decline have recorded a concentration at the 98,000 level, with another concentration at the 100,000 level. In contrast, the first selling level at 102,500 resulted in liquidation, while the 105,600 level is another area where accumulation is increasing.
In summary, while the effects of the US-China tariff crisis being suspended for a year and resulting in a compromise continue, optimistic developments continue to emerge from both sides. However, the Fed’s hawkish tone on interest rate cuts continues to put pressure on the market, while the uncertainty caused by the US government shutdown persists. On the technical side, although BTC recorded short-term increases from time to time, it touched the lower trend line parallel to the descending trend channel it formed. In liquidity data, while the dominance of the selling tier continues, buyers are beginning to reappear. In the coming period, 103,300 will be monitored as a resistance point, and if this level is gained, the 105,000 reference area and then the 105,600 liquidity zone can be monitored.In the event of a potential new selling pressure, 101,800 is the first support point, and if broken, we will follow the 100,000 reference area.
Supports: 101,800 – 100,000 – 99,000
Resistances: 103,300 – 105,000 – 106,600
ETH/USDT
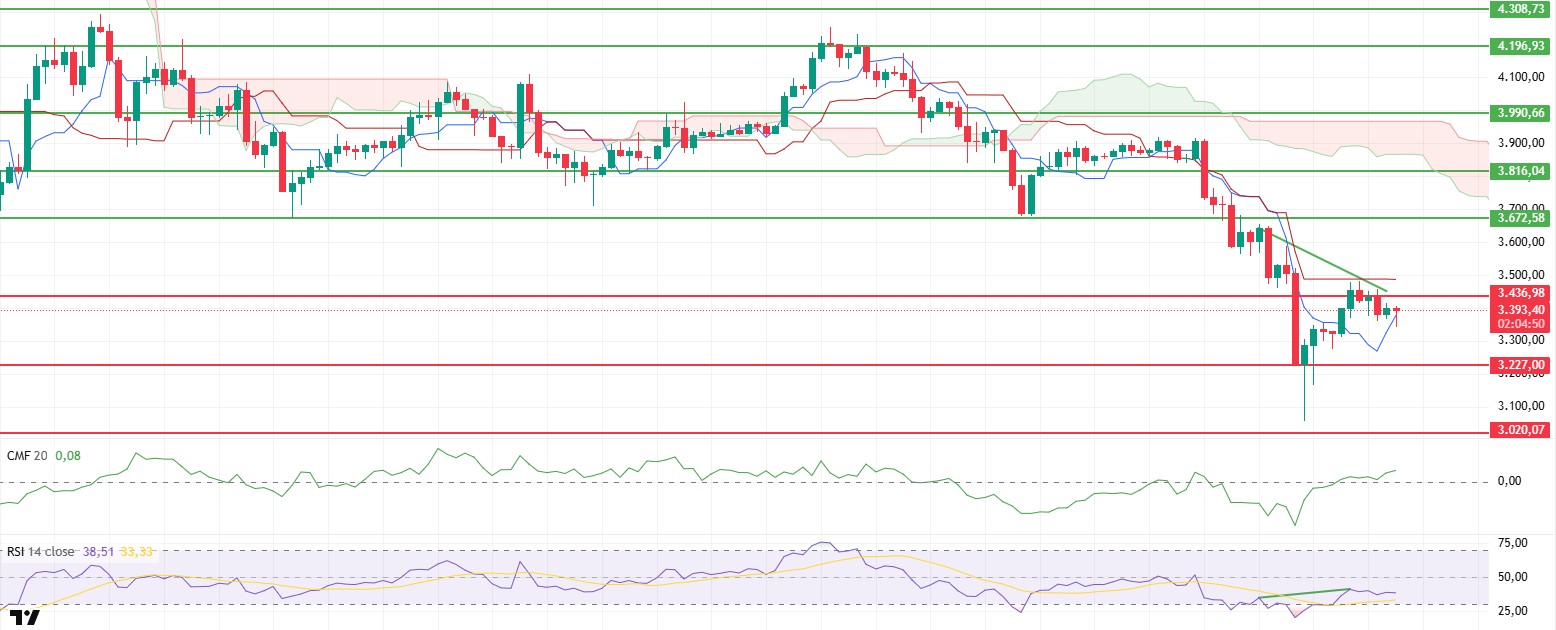
The ETH price fluctuated throughout the day, falling to $3,340, but buyers stepped in at this level, triggering a strong rebound. Towards the end of the day, the price climbed back above the $3,400 level, signaling a short-term recovery. This movement shows that despite selling pressure, the market is still supported by buyers and that declines are limited for now.
The Chaikin Money Flow (CMF) indicator moved back into positive territory during the day, gaining upward momentum. This chart shows that increased liquidity inflows into the market have continued in recent hours and that fund flows are shifting towards the buyer side. The CMF’s positive trend confirms that the price has not experienced a strong capital outflow during recent declines and that the potential for a short-term recovery remains intact.
The Relative Strength Index (RSI) indicator maintains its position from the morning hours, continuing its horizontal movement near the 50 level. This structure indicates that there is currently no clear directional choice in the market, but momentum remains balanced without losing strength. The RSI’s horizontal appearance signals that the price has entered a consolidation phase and that a potential directional breakout is approaching.
According to the Ichimoku indicator, the price is still below the kumo cloud and moving behind the Kijun level. This technical structure indicates that the main trend remains in negative territory, but signs of recovery are beginning to strengthen in the short term with the Tenkan and Kijun levels being regained. The price’s inability to move above the cloud indicates that selling pressure is still present in the overall outlook.
In general, the $3,436 level stands out as a critical resistance in the short term. The positive structure in the CMF and the price maintaining its upward momentum could support a new upward movement towards the $3,480 and $3,520 levels if this level is broken. However, if the price remains below the $3,436 level, selling pressure could increase again, and the price could retreat towards the important support level at $3,227.
Supports: 3,227 – 3,020 – 2,872
Resistances: 3,436 – 3,672 – 3,816
XRP/USDT
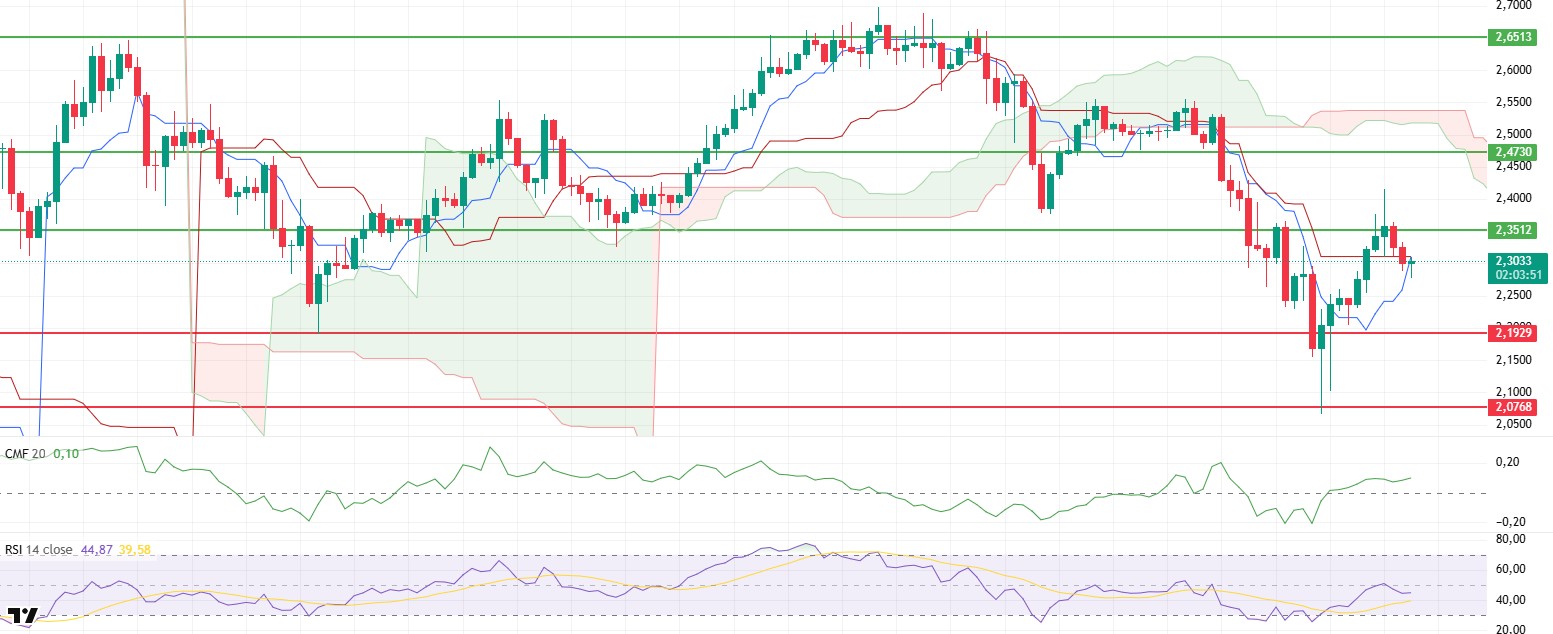
The XRP price fell to $2.27 during the day due to selling pressure, but rebounded from this level, turning upward again and recovering to $2.30. The price rebounding from this support level indicates that buyers are still active in the short term and that the market has not completely weakened.
The CMF indicator remains in positive territory. This structure, where liquidity inflows continue, signals that the buying side still holds sway in the market. Despite selling attempts, the positive outlook in capital flows continues to support the price.
The RSI indicator continues to show balanced momentum, hovering near the 50 level. The indicator maintaining its direction suggests that the short-term upward trend may continue and selling pressure could remain limited.
The price trading above the Tenkan and Kijun lines and the Tenkan level converging towards the Kijun level supports the short-term positive outlook, while remaining below the Kumo cloud indicates that the main trend has not yet turned upward. This technical structure signals that upward attempts may encounter resistance.
Breaking above the $2.35 level again could strengthen the upward trend. However, as long as the price remains below this level, short-term fluctuations and limited pullbacks may continue. Overall, indicators confirm that the short-term upward trend is intact, but the main trend has not yet changed significantly.
Supports: 2.1929 – 2.0768 – 1.9092
Resistances: 2.3512 – 2.4730 – 2.6513
SOL/USDT
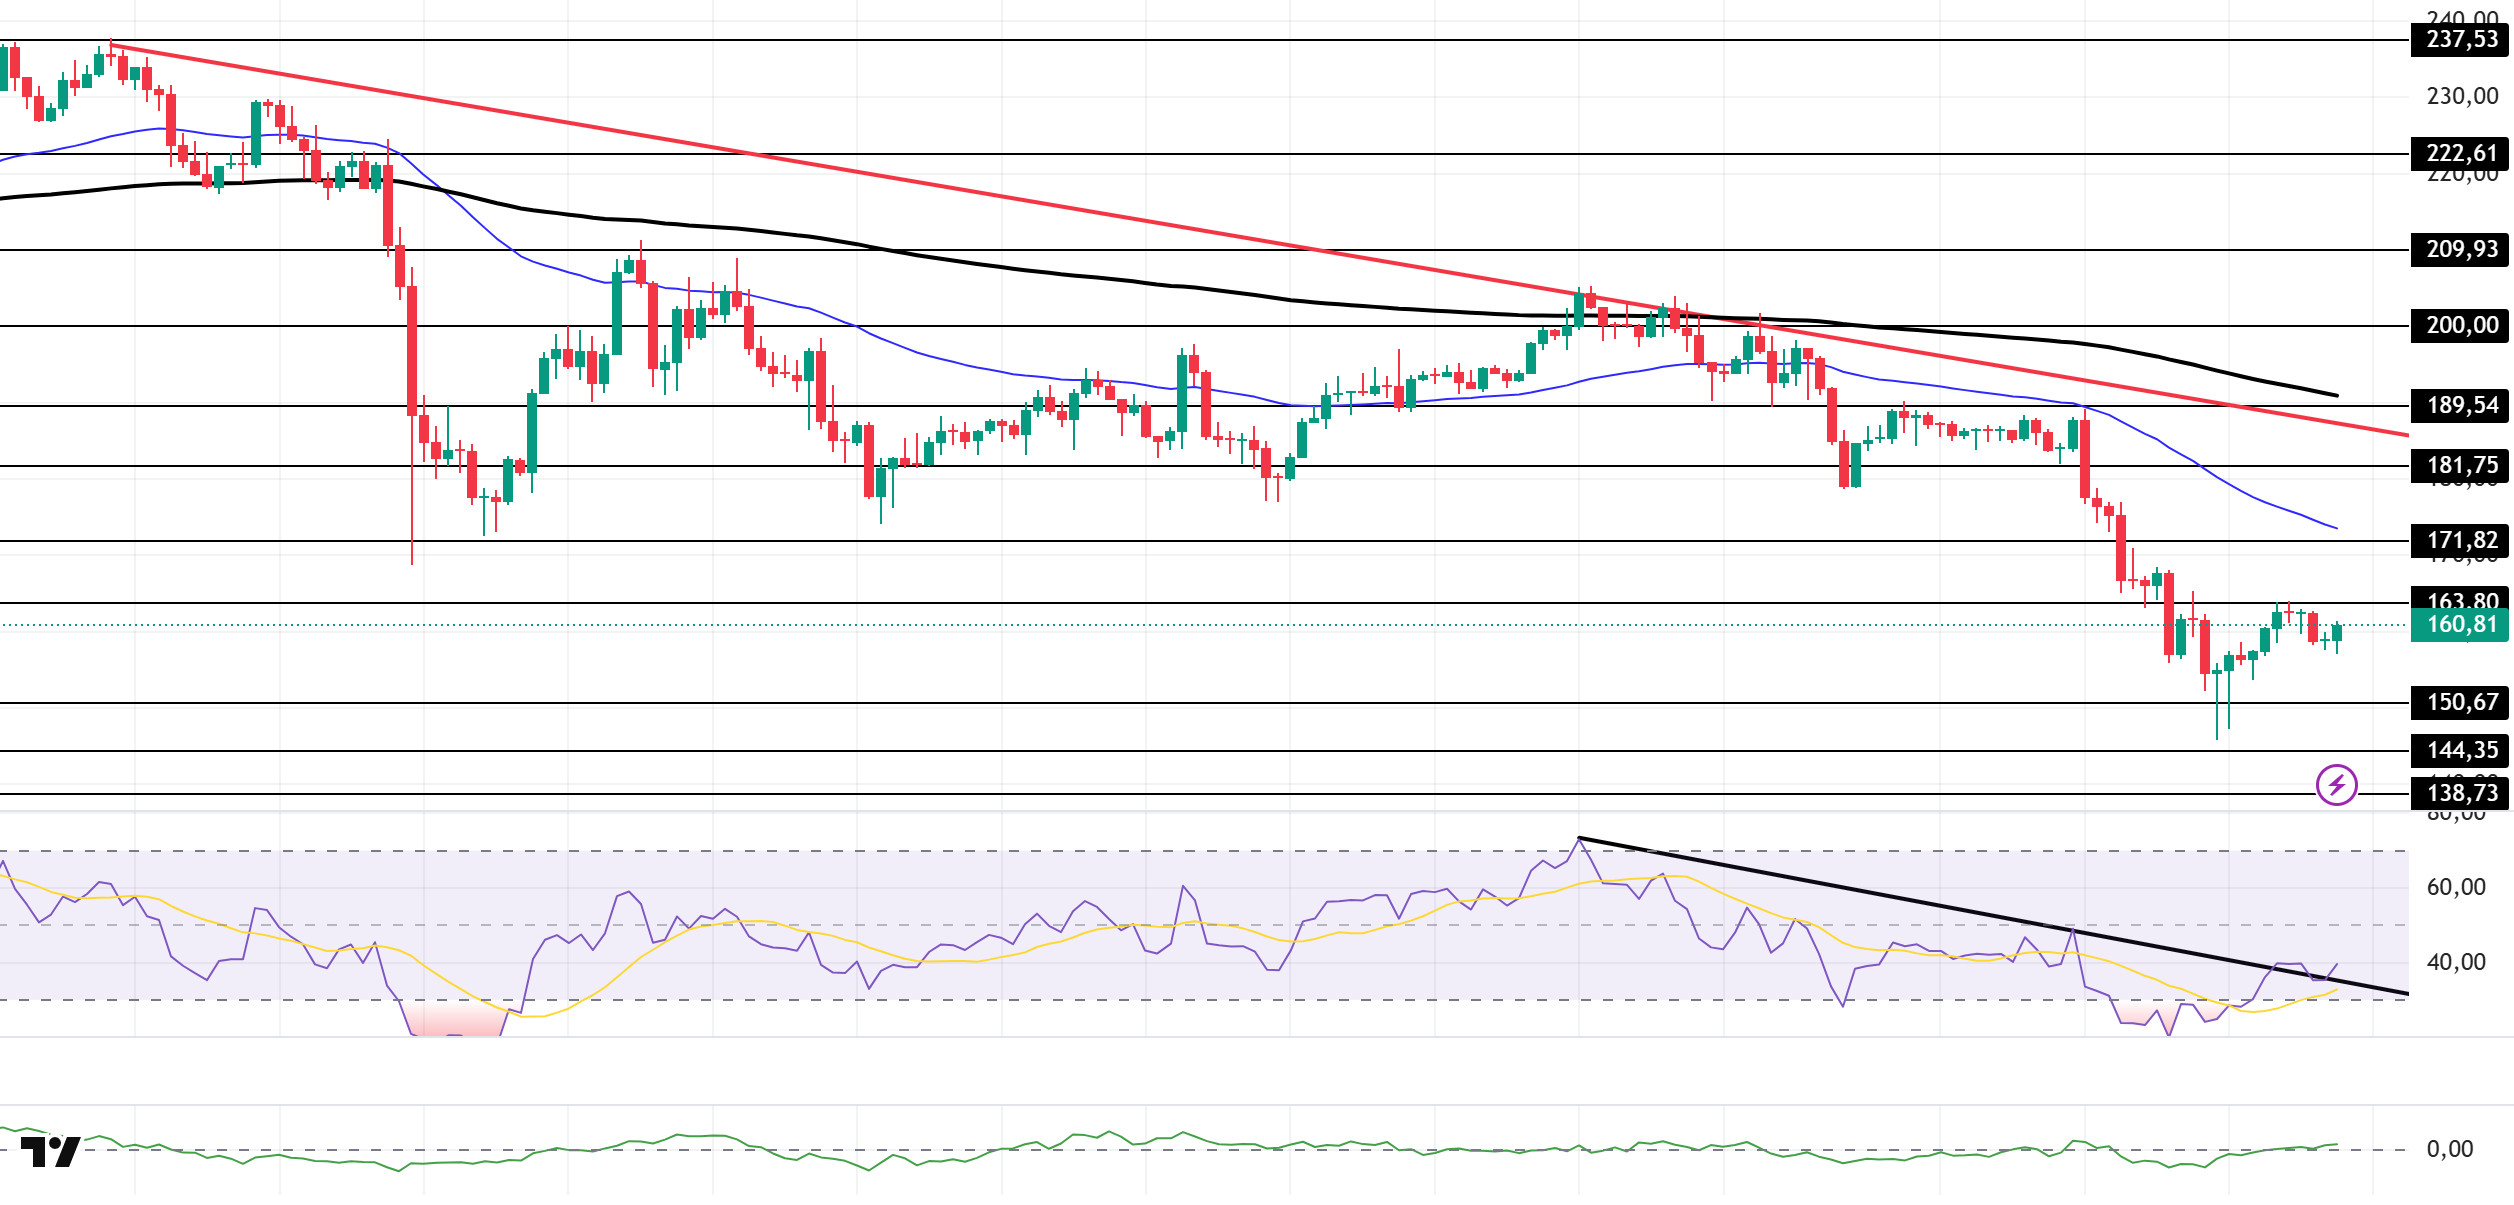
The SOL price traded sideways during the day. The asset tested the strong resistance level of $163.80 and experienced a pullback. However, it remained in the lower region of the downward trend that began on October 6. The price being far from the 50 EMA (Blue Line) and 200 EMA (Black Line) moving averages could strengthen the asset’s sideways or upward movement. Currently experiencing a pullback, the price could test the $144.35 level if the pullback continues. If the upward trend continues, it could test the 50 EMA (Blue Line) moving average.
The price remained below the 50 EMA (Exponential Moving Average – Blue Line) and 200 EMA (Black Line) on the 4-hour chart. This indicates a potential downtrend in the medium term. Additionally, the price being below both moving averages suggests a downward trend in the short term. The Chaikin Money Flow (CMF-20) is rising to positive levels. However, a decrease in cash inflows could push the CMF into negative territory. The Relative Strength Index (RSI-14) has risen to the middle of the negative zone. It is also testing the resistance level of the downward trend that began on October 27. A break above this level could lead to an uptrend. If there is an uptrend due to macroeconomic data or positive news related to the Solana ecosystem, the $171.82 level stands out as a strong resistance point. If this level is broken upwards, the uptrend is expected to continue. If there are pullbacks due to developments in the opposite direction or profit-taking, the $144.35 level may be tested. A decline to these support levels could increase buying momentum, presenting a potential opportunity for an upward move.
Supports: 150.67 – 144.35 – 138.73
Resistances: 163.80 – 171.82 – 181.75
DOGE/USDT
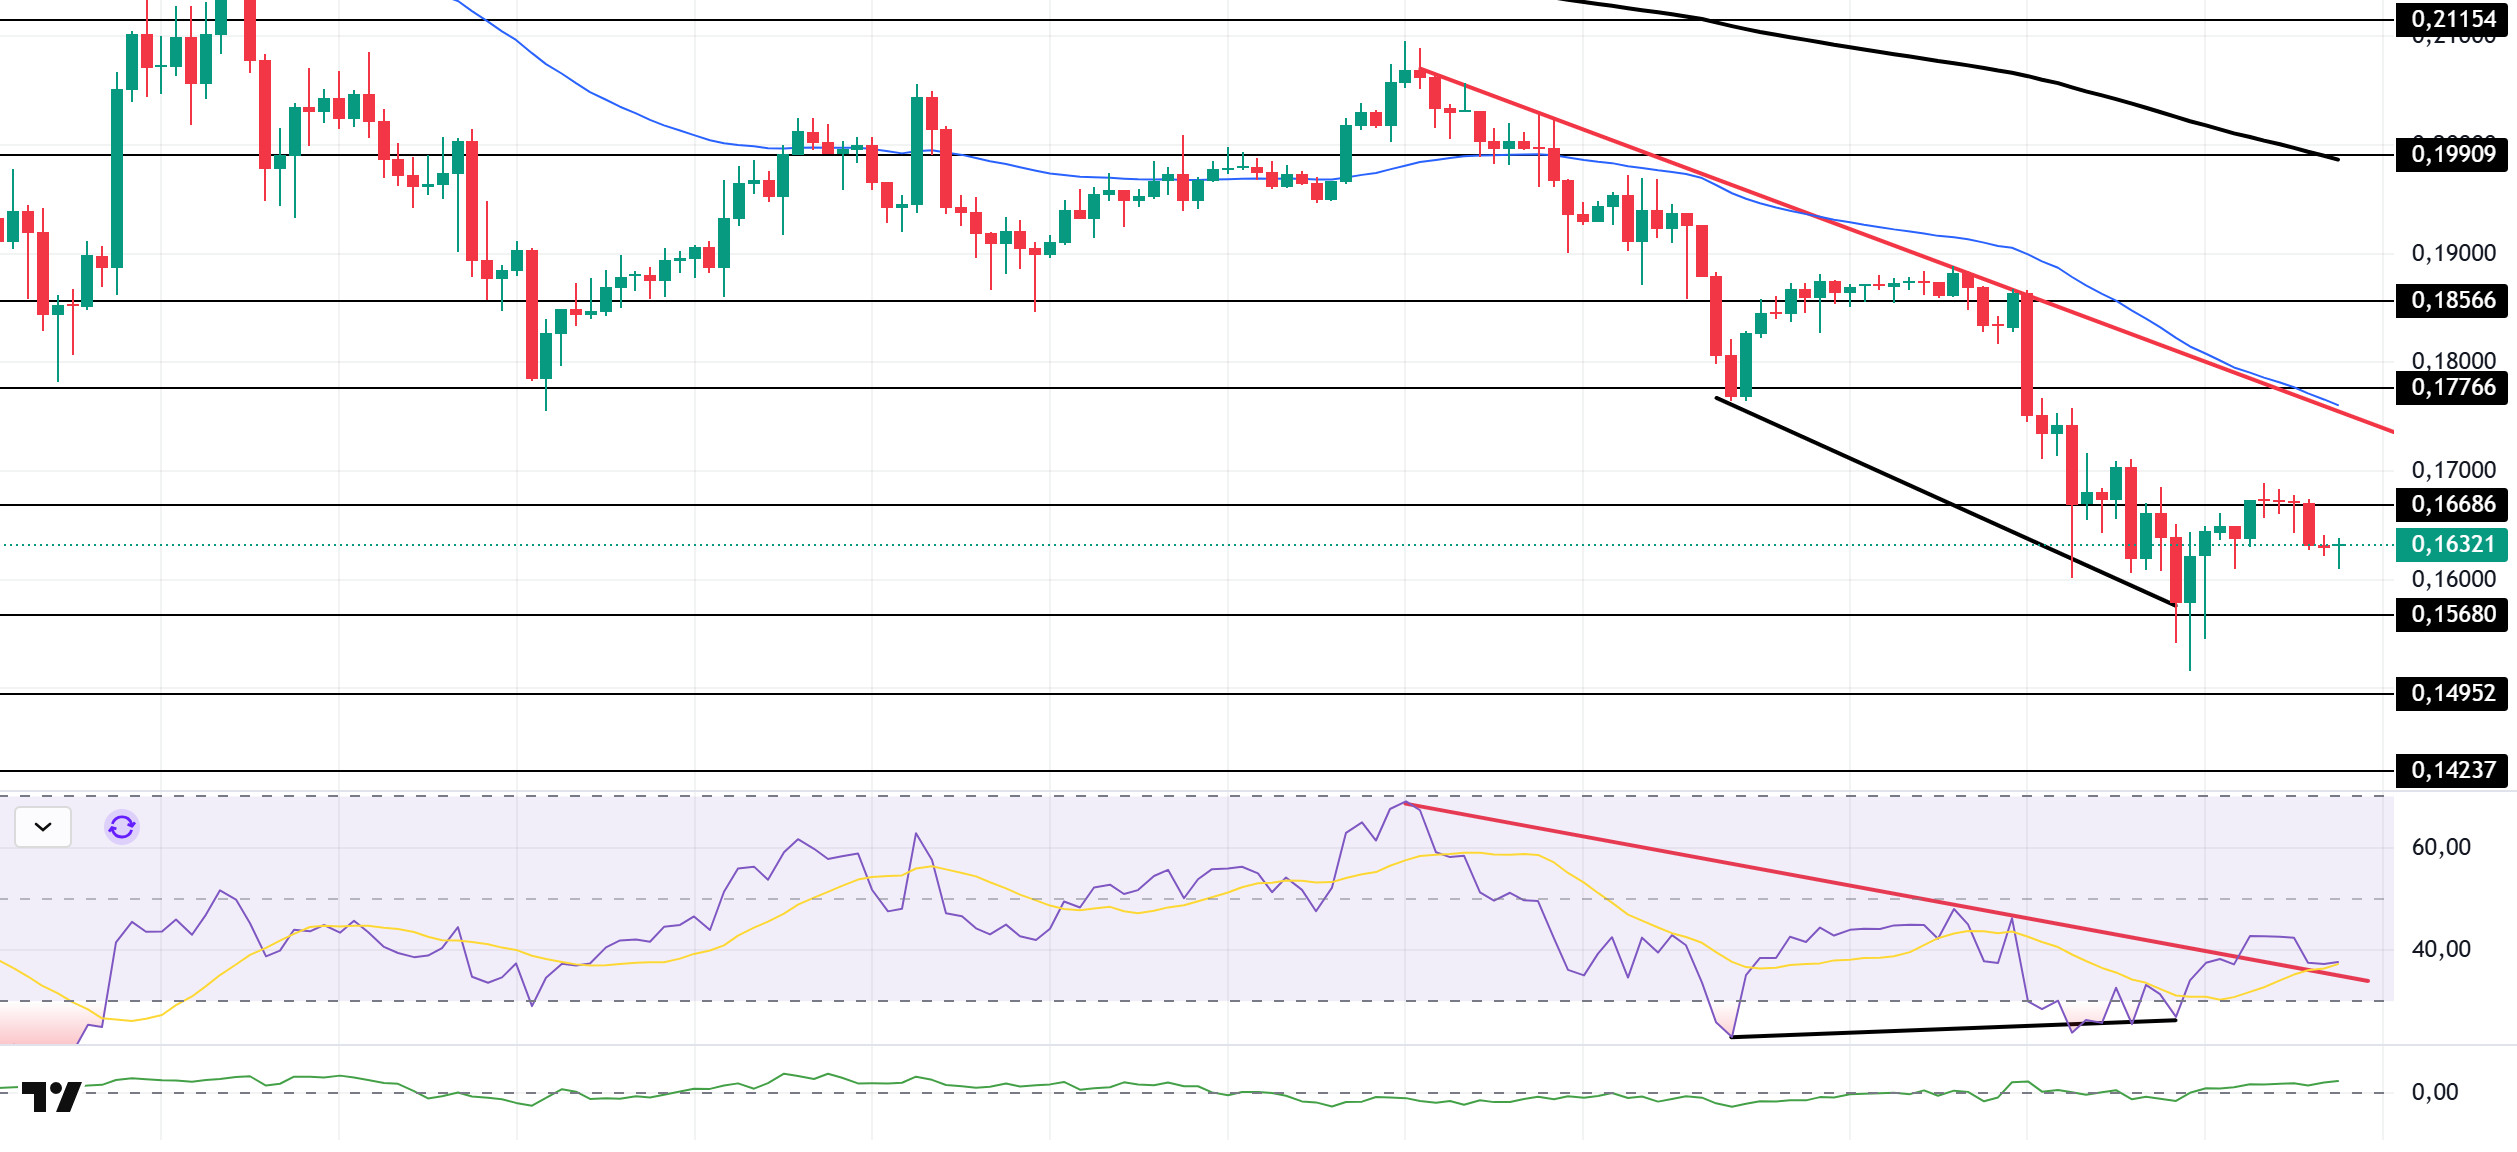
The DOGE price traded sideways during the day. The asset remained below the downward trend that began on October 27. It tested the $0.16686 level as resistance and deepened its pullback. The price, which continues to trade sideways, may test the $0.15680 level if the pullback continues. If an uptrend begins, it may test the 50 EMA (Blue Line) moving average as resistance.
On the 4-hour chart, the 50 EMA (Exponential Moving Average – Blue Line) remained below the 200 EMA (Black Line). This indicates that a downtrend may begin in the medium term. The price being below both moving averages indicates a downward trend in the short term. The Chaikin Money Flow (CMF-20) has started to move into the positive zone, close to the neutral zone. Additionally, an increase in money inflows could push the CMF to the upper levels of the positive zone. The Relative Strength Index (RSI-14) has risen to the middle level of the negative zone. At the same time, it broke above the downward trend that began on October 27 and is currently testing this trend as support. On the other hand, there is a positive divergence. This could increase buying pressure. In the event of an uptrend driven by political developments, macroeconomic data, or positive news flow in the DOGE ecosystem, the $0.17766 level stands out as a strong resistance zone. Conversely, in the event of negative news flow, the $0.15680 level could be triggered. A decline to these levels could increase momentum and initiate a new wave of growth.
Supports: $0.15680 – $0.14952 – $0.14237
Resistances: 0.16686 – 0.17766 – 0.18566
ADA/USDT
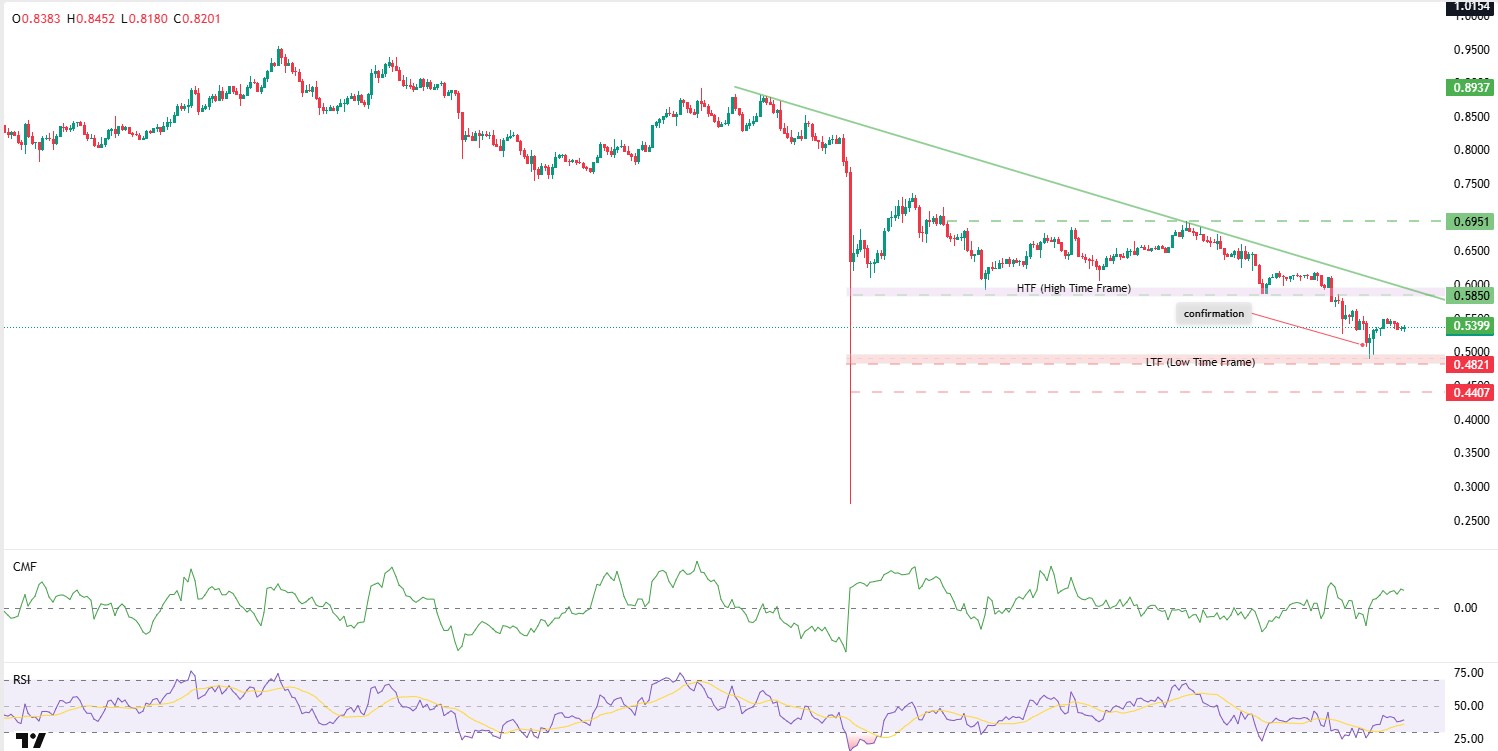
ADA continued its sideways movement in the second half of the day, trading around the $0.5369 level.
As of today, the Bitcoin price remained above $103,000, completing its pullback movement. Statements by FED members during the day and the narrowing of volatility may lead to increased selling pressure. In this scenario, the price intersects with the confirmation zone, which is the entry zone of the lower time frame (LTF), at the $0.4821 level. This technically increases the importance of the region. In a more severe correction scenario, the $0.4407 level can be monitored as the main support level. However, confirmation of this movement should be monitored in terms of volume and market structure.
The Relative Strength Index (RSI-14) has rebounded from the 40 levels and, together with the Chaikin Money Flow (CMF-20), has started to approach a buy signal. The increase in money inflows may keep the CMF in positive territory and indicate that the selling pressure is coming to an end. With possible intraday rises, the price may again emerge as an important level to monitor, with the 0.5850 level acting as resistance at the high time frame (HTF) entry zone. In this case, it may signal that the upward trend could continue in the medium term.
In the event of an upward movement driven by macroeconomic data or positive news related to the Cardano ecosystem, the $0.6951 level emerges as a strong resistance point. If this level is broken upward, the upward trend is expected to continue.
Supports: $0.3896 – $0.4407 – $0.4821
Resistances: 0.5850 – 0.6951 – 0.7500
Legal Notice
The investment information, comments, and recommendations contained herein do not constitute investment advice. Investment advisory services are provided individually by authorized institutions taking into account the risk and return preferences of individuals. The comments and recommendations contained herein are of a general nature. These recommendations may not be suitable for your financial situation and risk and return preferences. Therefore, making an investment decision based solely on the information contained herein may not produce results in line with your expectations.


