
Technical Analysis
BTC/USDT
US President Donald Trump emphasized that cooperation with China is “better than conflict” and stated that they will remain committed to the reconciliation process. Treasury Secretary Scott Bessent also stated that the US has “no intention of severing ties” with China. Fed members Mian and Mester indicated that interest rate cuts are approaching but that the steps will be gradual. During this process, Strategy strengthened its reserves by purchasing 397 more Bitcoins with an investment of $45.6 million, signaling continued institutional demand.
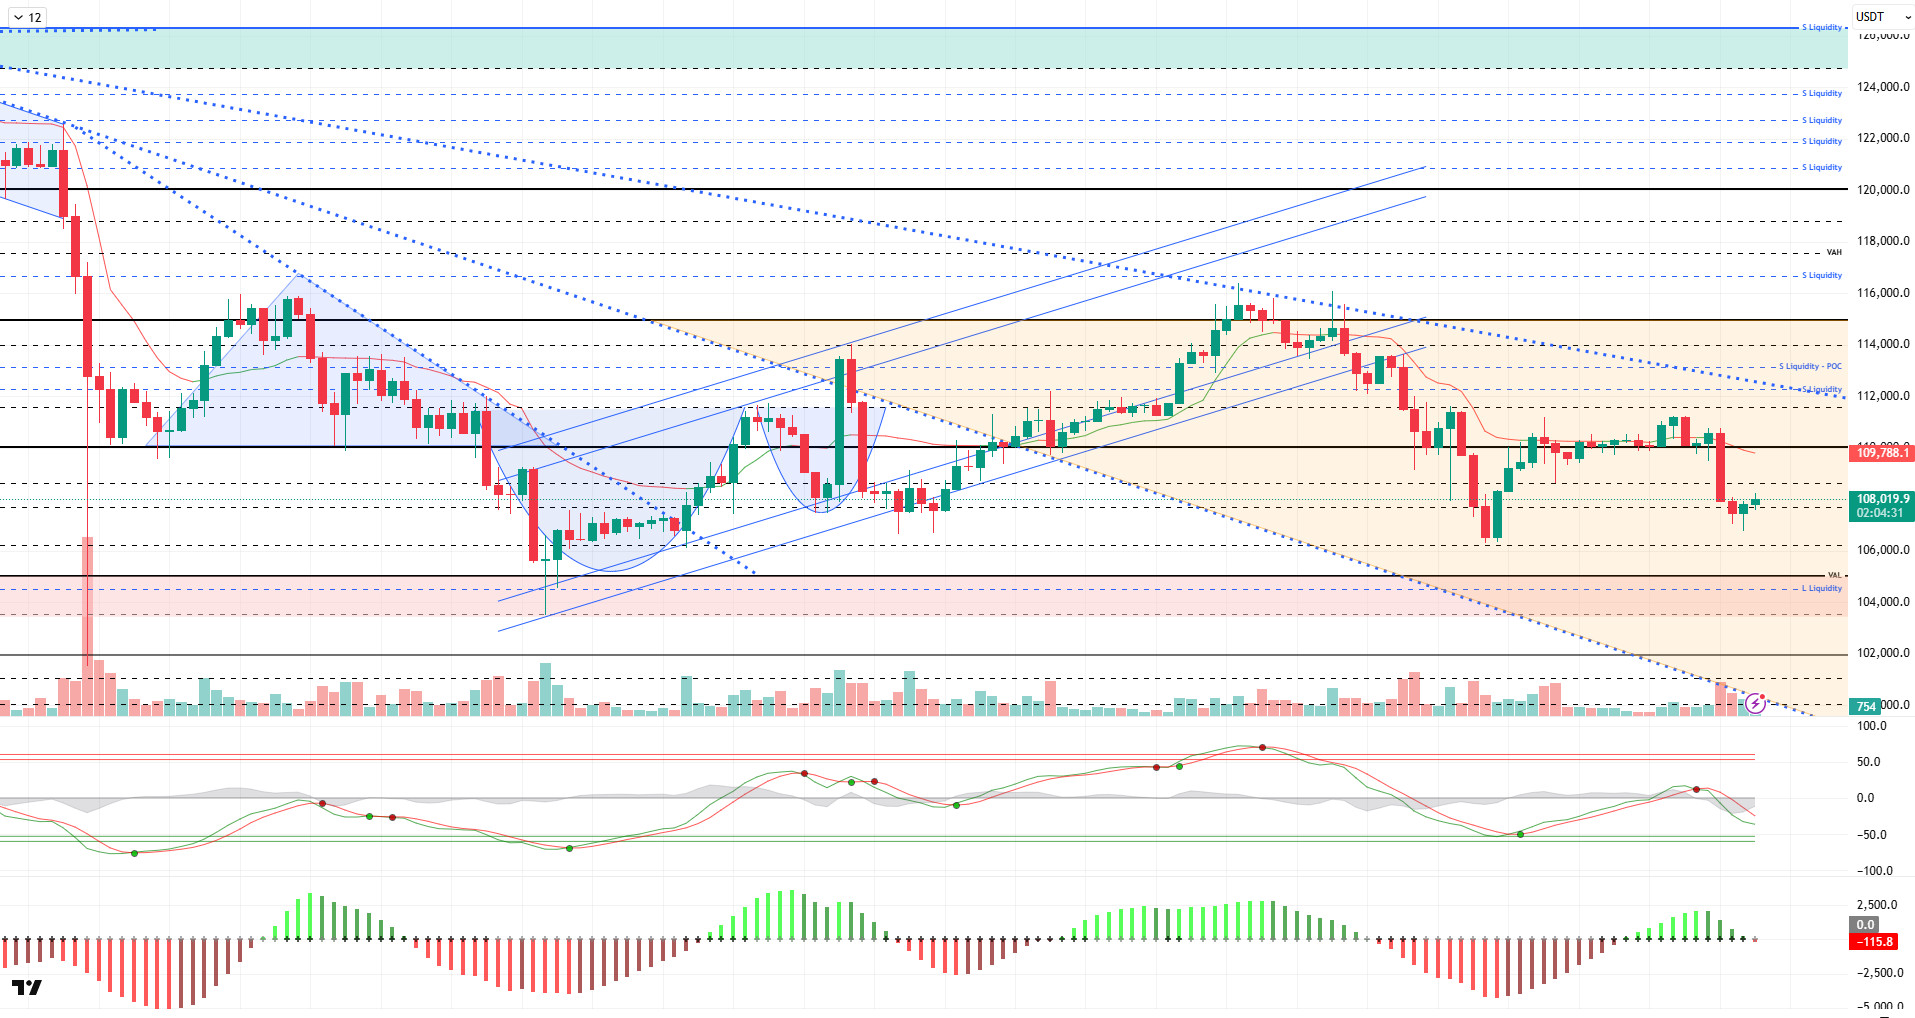
From a technical perspective, although BTC fell below the 107,000 level during the day, it managed to recover from there. Maintaining a falling trend by forming lower peaks within the orange band, the price was trading at the 107,800 level at the time of writing.
Technical indicators continue to maintain the sell signal given by the Wave Trend (WT) channel middle band, but it is observed to be weakening. Although the histogram in the Squeeze Momentum (SM) indicator lost momentum for a short time, it may regain momentum again. The Kaufman moving average (KAMA) is currently at $109,750, positioned above the price.
According to liquidation data, the buy level recorded intensity at the 108,500 level over the weekend, resulting in the liquidation of these positions with the recent decline. In contrast, the sell level has reached significant intensity at 112,000 – 113,000. Looking at the last 24 hours, a total of $470 million was liquidated in the market.
In summary, while the effects of the US-China tariff crisis being suspended for a year and resulting in a compromise continue, optimistic developments continue to emerge from both sides. However, the Fed’s hawkish tone on interest rate cuts continues to put pressure on the market. On the technical side, although BTC occasionally records short-term increases, it is seen that the increases parallel to the descending trend channel it has formed are not permanent. Liquidity data shows that the selling pressure continues to prevail. In the coming period, 105,000 will be monitored as a critical support level, and a loss of this level could deepen the selling pressure, resulting in a loss of six-digit levels. In the event of a potential rebound, we will monitor liquidity areas if the 110,000 reference level is breached.
Supports: 107,400 – 106,600 – 105,000
Resistances: 108,600 – 110,000 – 111,400
ETH/USDT
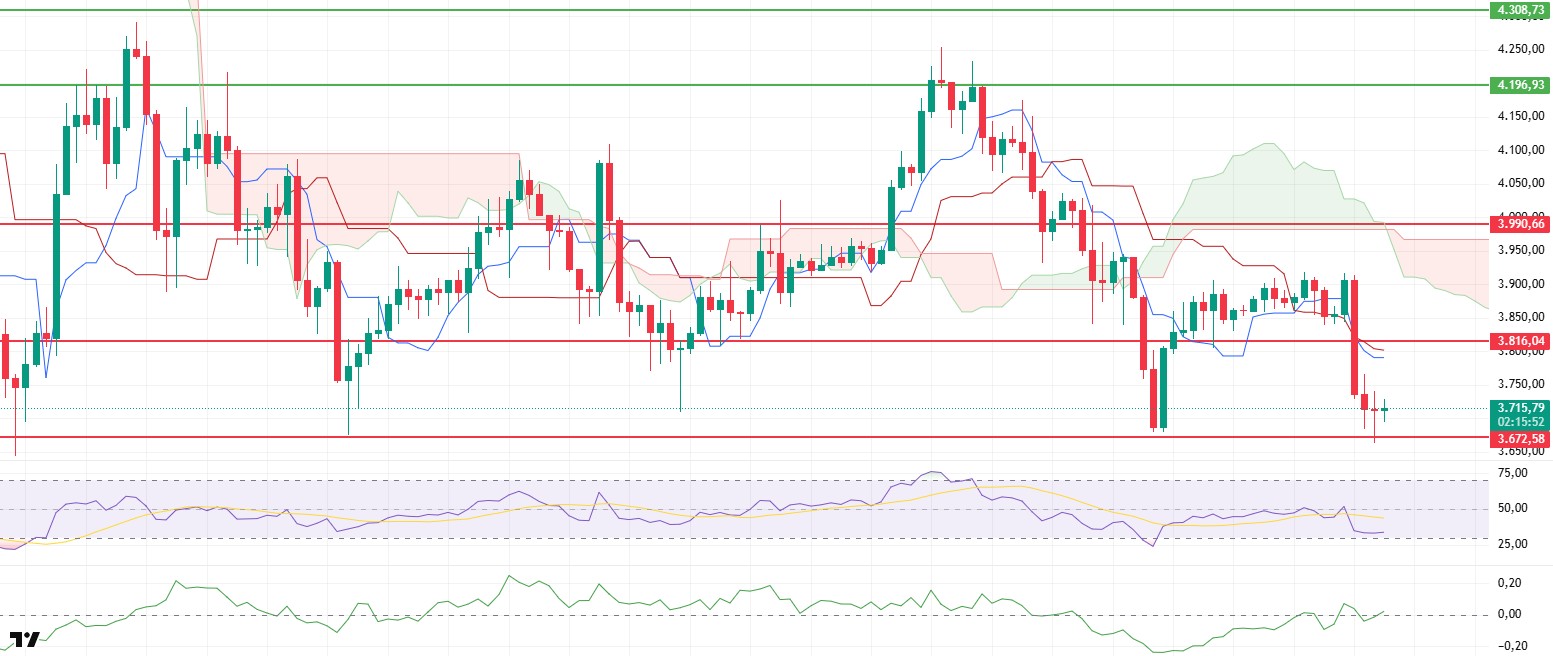
The ETH price fell to the $3,672 support level during the day, consistent with the weak outlook in technical indicators. With the reactionary buying from this level, the price showed a short-term recovery, rising to the $3,720 level. This short-term reactionary movement reveals that buyers are still active at certain support levels, but the overall selling pressure continues.
The Chaikin Money Flow (CMF) indicator has moved back into positive territory, showing a slight recovery. This movement signals that liquidity inflows into the market have begun, albeit limited, and that buyer interest may increase in the short term. However, the sustainability of this CMF rise will depend on whether the price can find volume support.
The Relative Strength Index (RSI) indicator continues its weak trend, reflecting the ongoing loss of momentum. The RSI’s persistence in these low regions indicates that the market remains in a weak momentum phase and that the recovery process is progressing in a fragile manner.
The price is still moving below the Ichimoku cloud. The price remaining below both the Tenkan and Kijun levels confirms that the overall trend remains downward. The price’s inability to rise above the cloud indicates that upward movements may be technically limited.
In the short term, the $3,672 level remains important as support. Closings below this level could increase selling pressure and pull the price back to the $3,580 region. On the other hand, a potential break above the $3,816 level could strengthen the possibility of a short-term rebound. The overall technical structure remains weak. Although the recovery signals in the CMF support short-term rebound rallies, these rallies may remain limited as the main trend continues to be downward.
Supports: 3,672 – 3,436 – 3,200
Resistances: 3,816 – 3,928 – 3,990
XRP/USDT
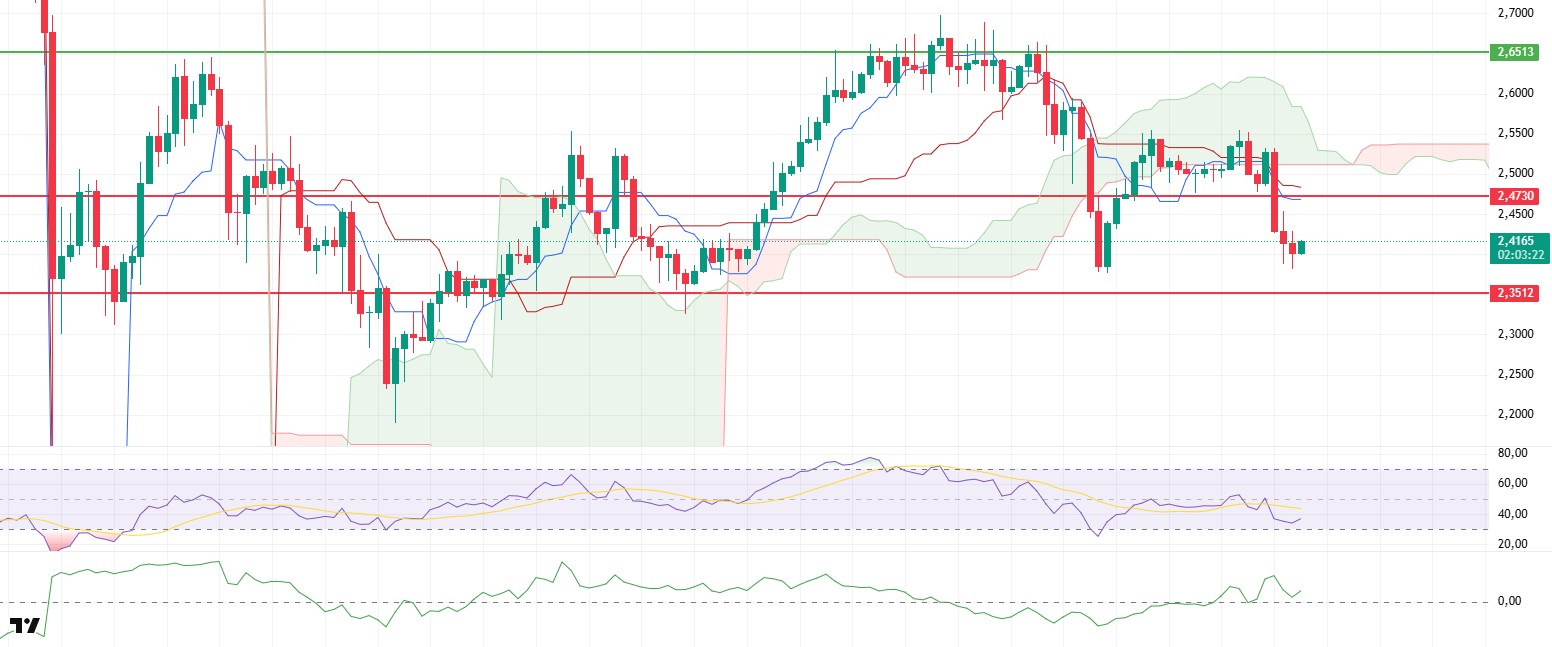
The XRP price fell to $2.38 during the day but rose to $2.416 with buyback reactions from this region. Intraday movements show that selling pressure is still effective, but short-term buyers have stepped in at certain support levels. The price remaining below $2.47 indicates that the market continues to search for direction.
The Chaikin Money Flow (CMF) indicator remains in positive territory. Despite the price decline, the CMF holding at this level indicates that there is no strong liquidity outflow from the market and that capital movements are continuing in a balanced manner. The CMF remaining in positive territory may support the possibility of a short-term recovery and pave the way for the price to rise again towards the $2.47 region.
The Relative Strength Index (RSI) indicator remains below the 50 level. This weak outlook indicates that momentum loss is accelerating and selling pressure remains strong. The RSI’s current position increases the likelihood of the market remaining weak in the short term and shows that buyers have not yet gained sufficient strength.
In the Ichimoku indicator, the price is moving below both the Kumo cloud and the Tenkan and Kijun levels. This technical outlook indicates that the downtrend is still dominant and that short-term recovery attempts may remain limited. The price rising back above the lower band of the cloud stands out as the most important technical condition for a trend reversal.
The overall technical structure remains weak. All signals except the CMF indicator point to a bearish market. If the price fails to regain the $2.47 level, selling pressure could intensify, leading to declines down to the $2.35 level. However, if the price manages to hold above the $2.47 level, a short-term rebound could push the price towards the $2.65 region.
Supports: 2.3512 – 2.2100 – 2.1300
Resistances: 2.4730 – 2.6513 – 2.7306
SOL/USDT
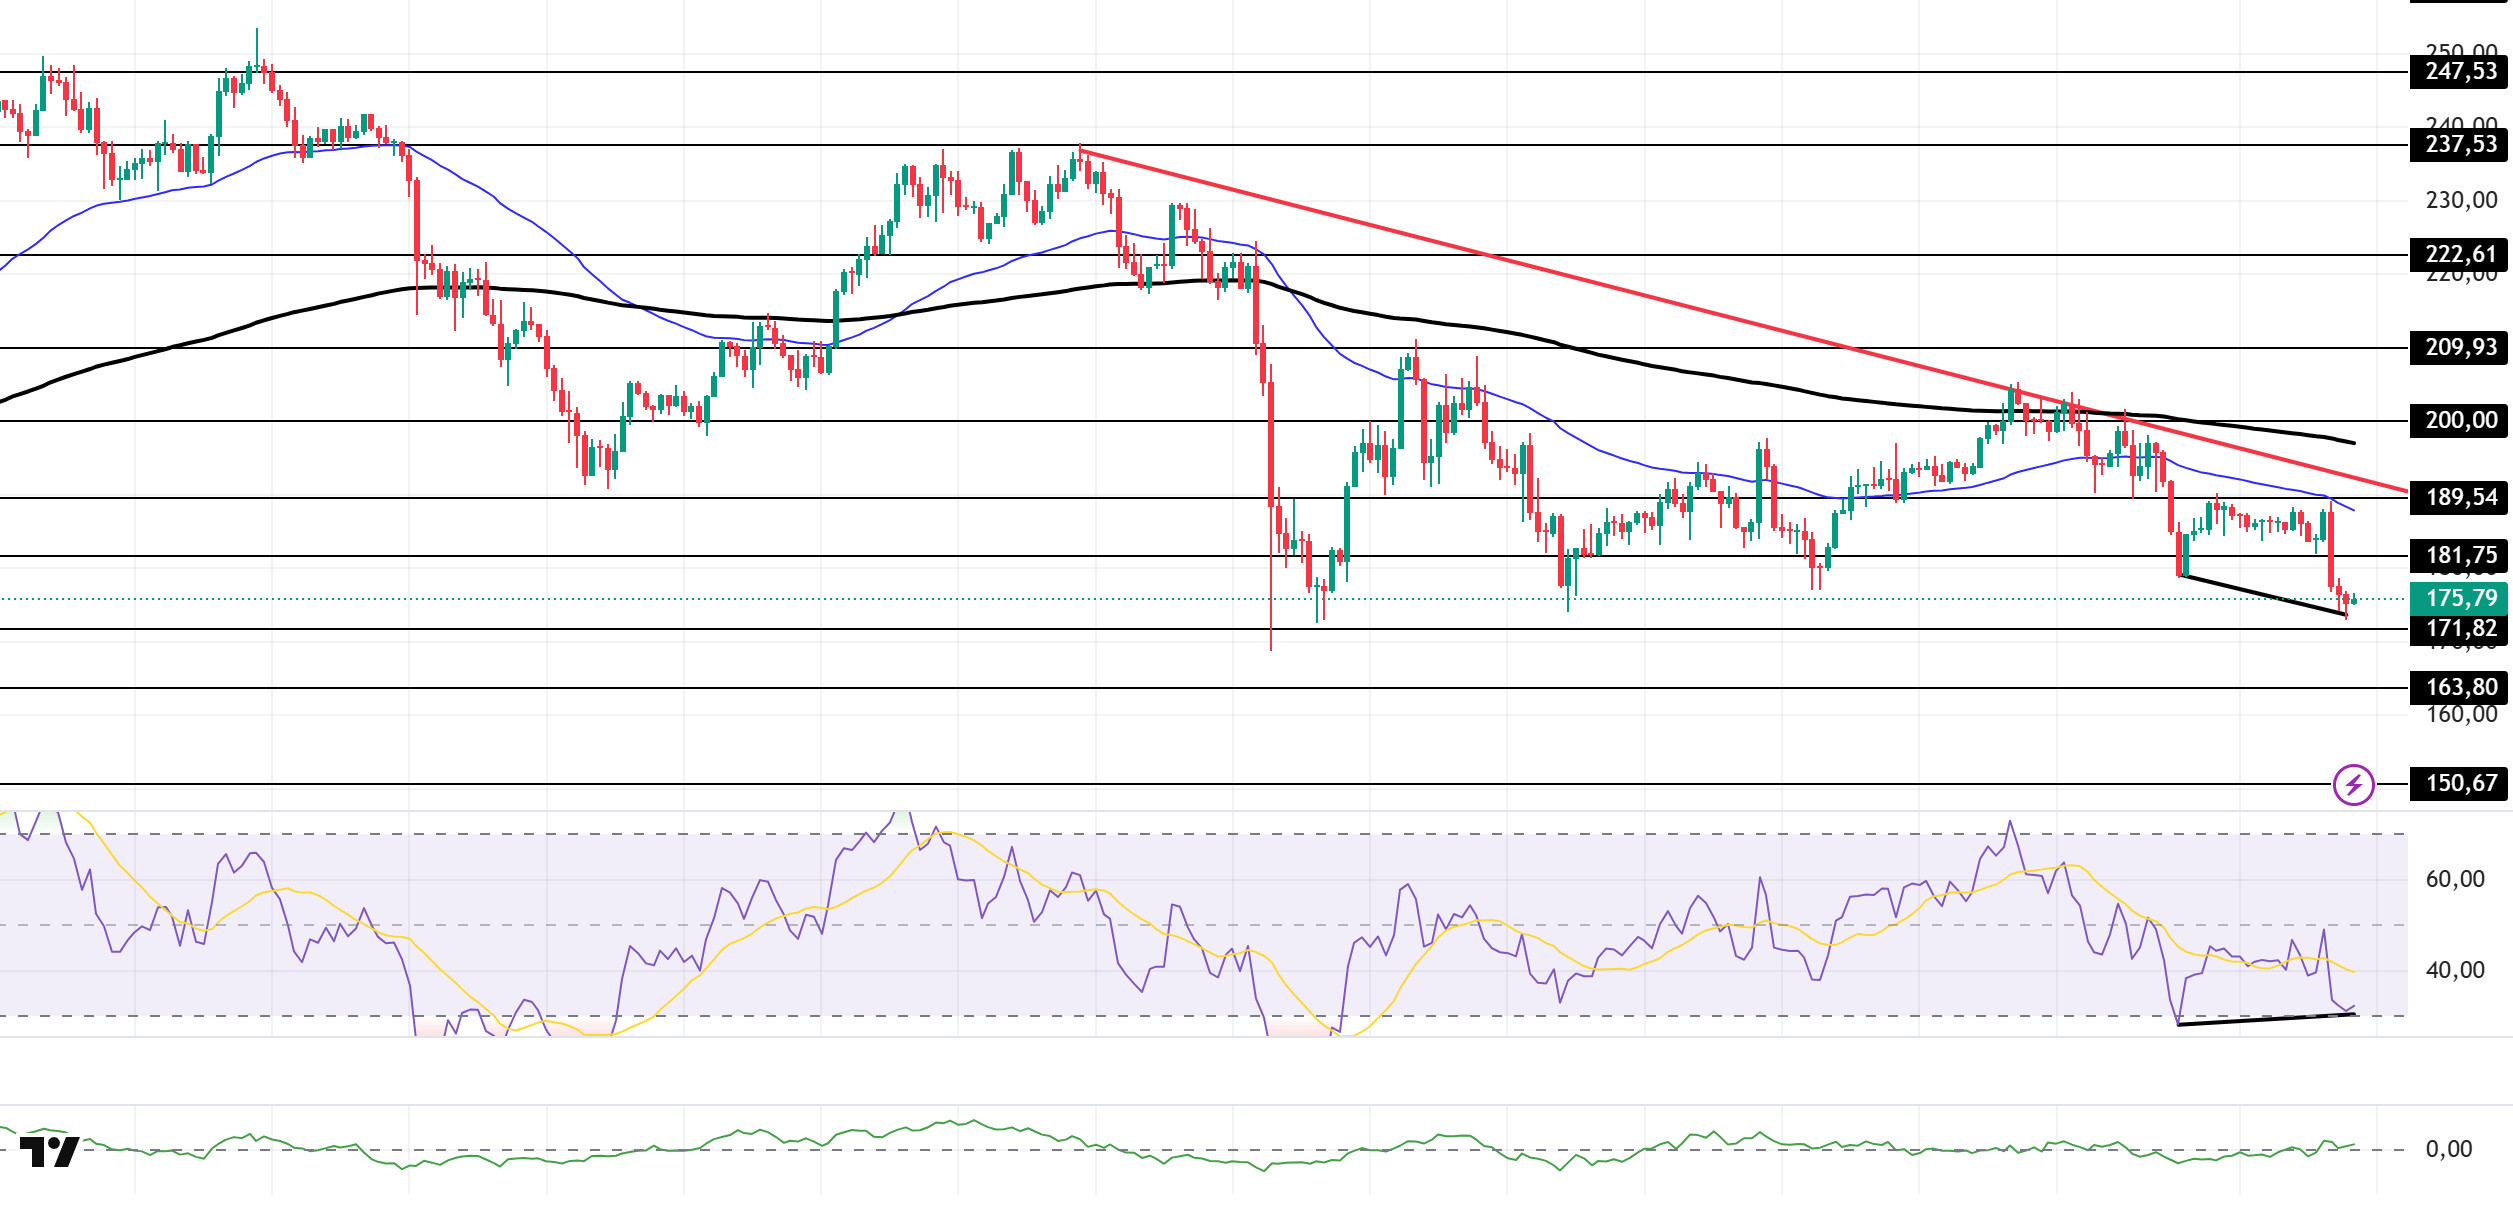
The SOL price traded sideways during the day. The asset tested the 50 EMA (Blue Line) moving average and the $189.54 level as resistance but failed to break through, continuing its pullback and remaining in the lower region of the downward trend that began on October 6. Currently trading sideways, the price could test the $163.80 level if the pullback continues. If an uptrend begins, it could retest the 50 EMA moving average.
The price remained below the 50 EMA (Exponential Moving Average – Blue Line) and 200 EMA (Black Line) on the 4-hour chart. This indicates a possible downtrend in the medium term. At the same time, the price being below both moving averages shows us that the asset is trending downward in the short term. The Chaikin Money Flow (CMF-20) is in the positive zone, close to the neutral level. However, a decrease in money inflows could push the CMF into negative territory. The Relative Strength Index (RSI-14) is in the oversold zone. At the same time, there is a positive divergence. These indicate that buying pressure may increase. If there is an uptrend due to macroeconomic data or positive news related to the Solana ecosystem, the $189.54 level stands out as a strong resistance point. If this level is broken upwards, the uptrend is expected to continue. If pullbacks occur due to developments in the opposite direction or profit-taking, the $163.80 level could be tested. A decline to these support levels could increase buying momentum, presenting a potential upside opportunity.
Supports: 171.82 – 163.80 – 150.67
Resistances: 181.75 – 189.54 – 200.00
DOGE/USDT
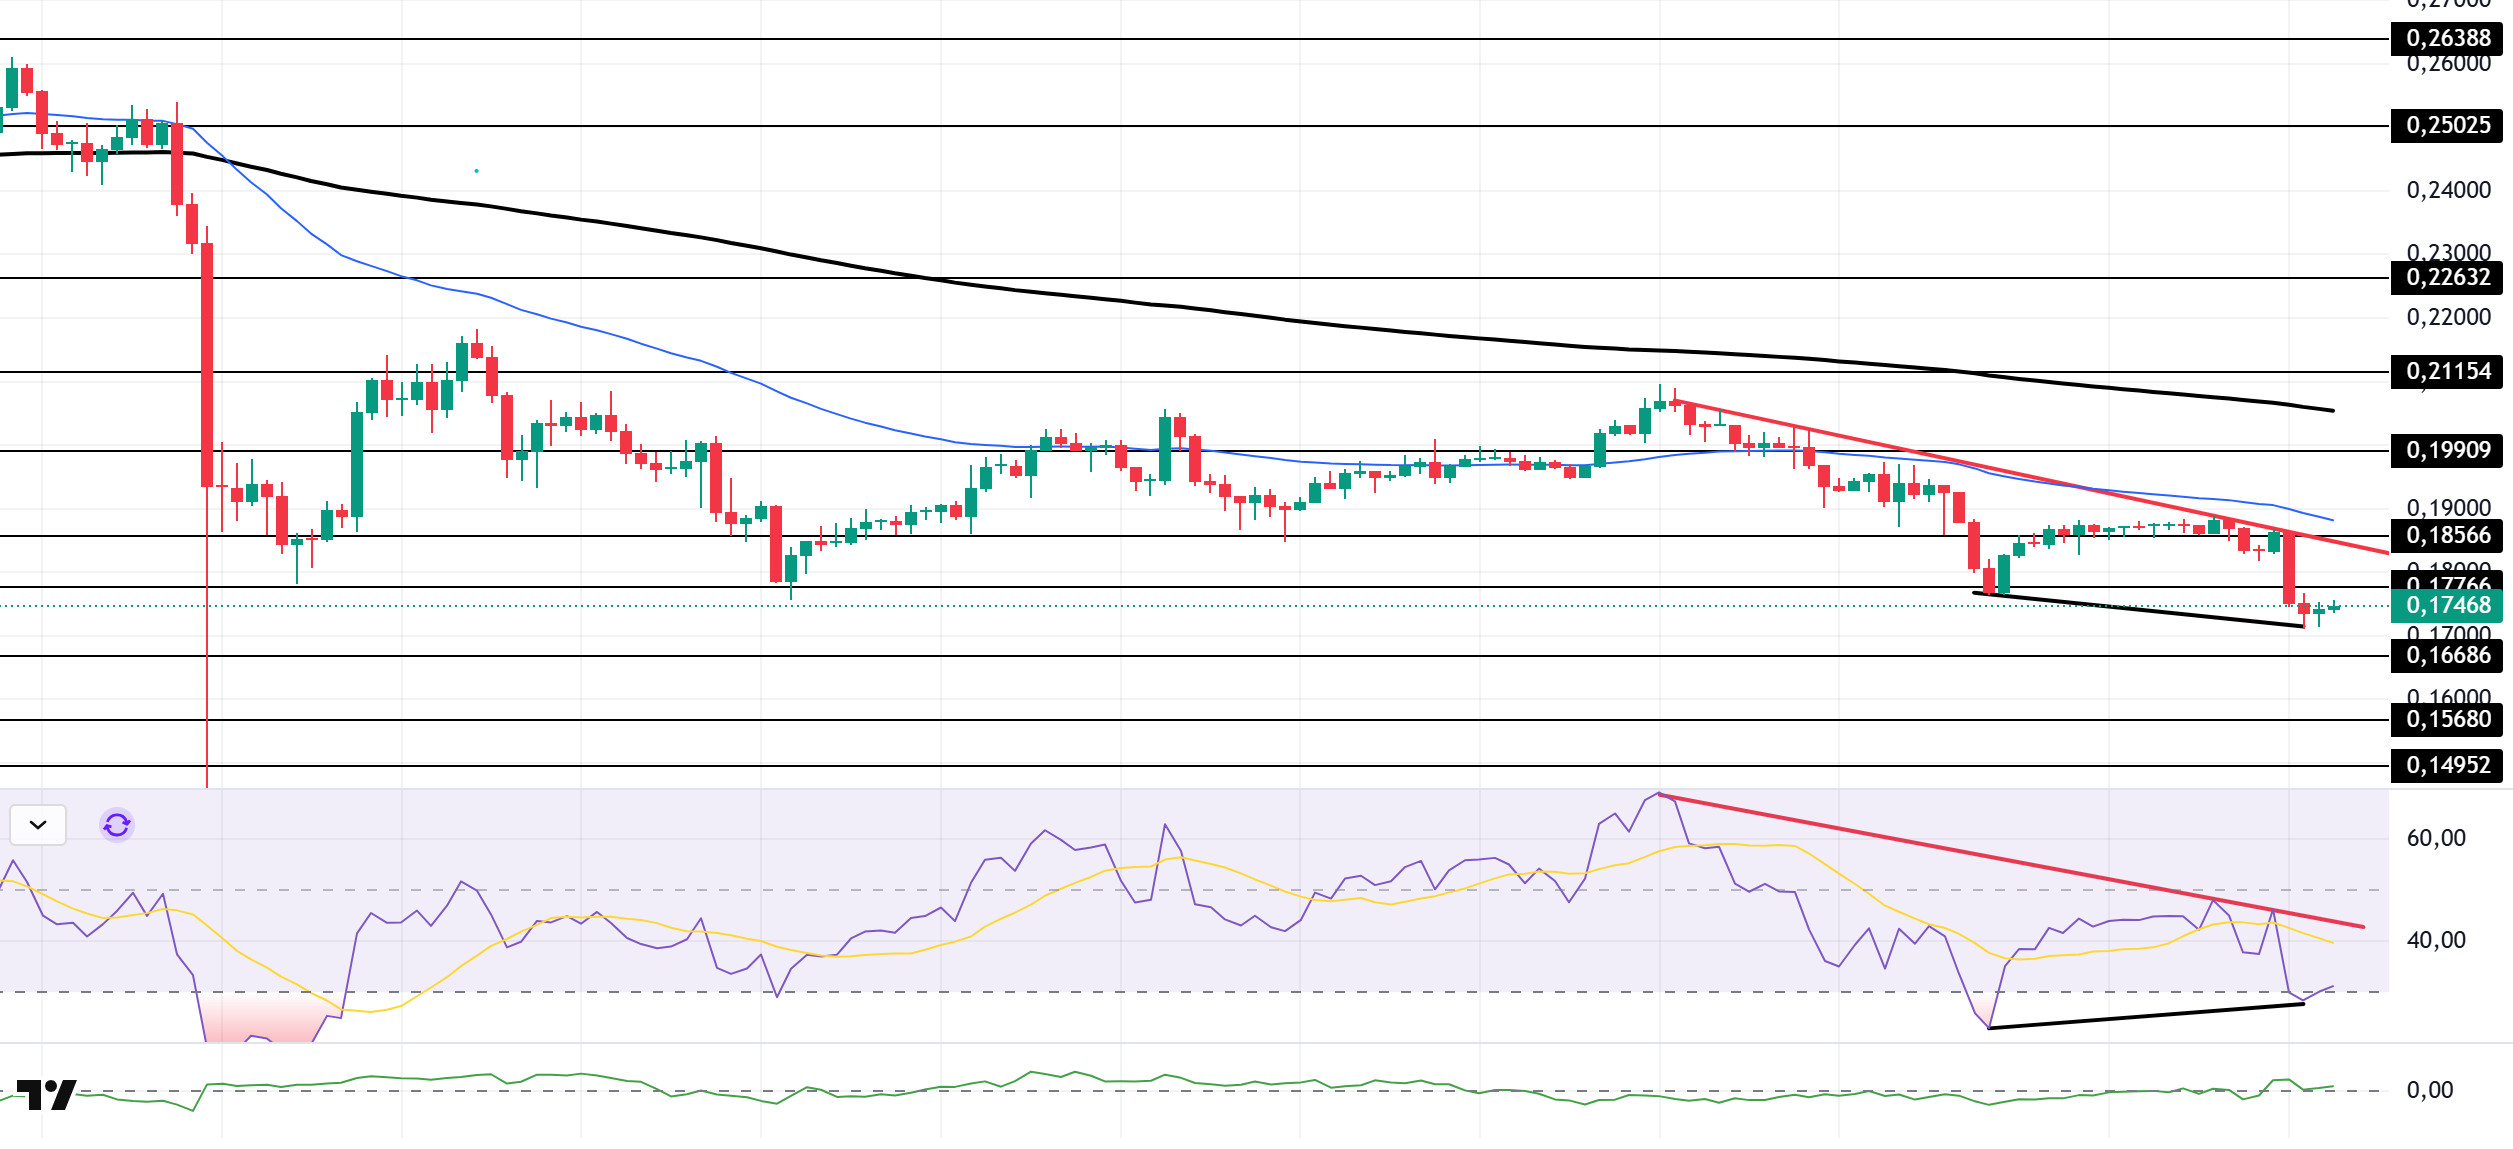
The DOGE price lost value. The asset tested the descending trend line that began on October 27 and the $0.18566 level as resistance and deepened its pullback. The price, which continues to be in the lower region of the descending trend line, may test the $0.16686 level if it continues to pull back. If an uptrend begins, it may test the downward trendline as resistance.
On the 4-hour chart, the 50 EMA (Exponential Moving Average – Blue Line) remained below the 200 EMA (Black Line). This indicates that a downtrend may begin in the medium term. The price being below both moving averages indicates a downward trend in the short term. The Chaikin Money Flow (CMF-20) remained in the neutral zone. Additionally, a decrease in cash inflows could push the CMF into negative territory. The Relative Strength Index (RSI-14) is in the oversold zone. It also remained below the downward trend line that began on October 27. On the other hand, there is a positive divergence. These factors could increase buying pressure. In the event of an uptrend driven by political developments, macroeconomic data, or positive news flow in the DOGE ecosystem, the $0.18566 level stands out as a strong resistance zone. Conversely, in the event of negative news flow, the $0.15680 level could be triggered. A decline to these levels could increase momentum and initiate a new wave of growth.
Supports: $0.16686 – $0.15680 – $0.14952
Resistances: 0.17766 – 0.18566 – 0.19909
BNB/USDT
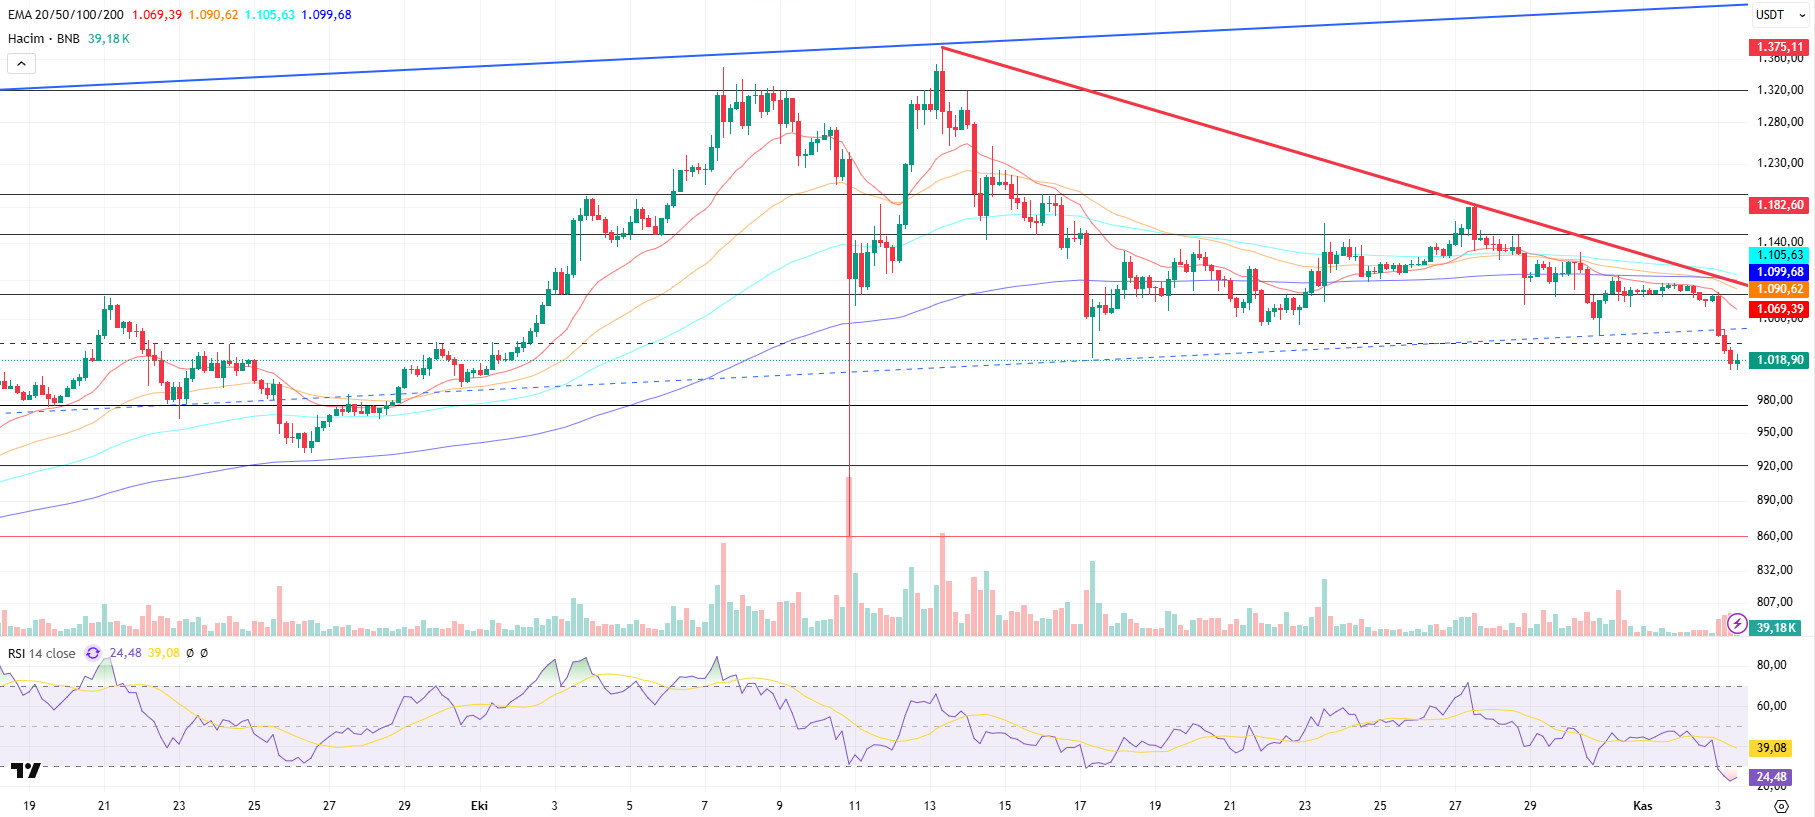
From a technical perspective, positive news flow supporting the BNB price last week led to positive momentum in the BNB/USDT pair, with the price movement continuing up to the $1,180 level.
However, at these levels, the correction movement that began after the all-time high (ATH) regained strength and retreated towards the psychological threshold of $1,000. While the momentum of the pullback appears to be slowing in this region, the asset continues to seek support.
Technical indicators for BNB/USDT, currently trading in the $980–1,080 range, show that the recent decline in trading volume has supported the pullback momentum. Additionally, the Relative Strength Index (RSI) has fallen below the 30 level with the recent selling pressure, indicating that the asset has entered the oversold zone and that the current technical outlook confirms this trend.
According to the technical chart, if selling pressure continues, the $980 support level is likely to be retested. If this level is broken downwards, the price is expected to retreat to the $930 and $880 support zones. On the other hand, if buying appetite is maintained and market momentum recovers, BNB is likely to retest the $1,080 resistance level in the first stage. If this level is broken, it is technically possible for the price to move towards the $1,150 and $1,200 levels.
Supports: 980 – 930 – 880
Resistances: 1,080 – 1,150 – 1,200
ADA/USDT
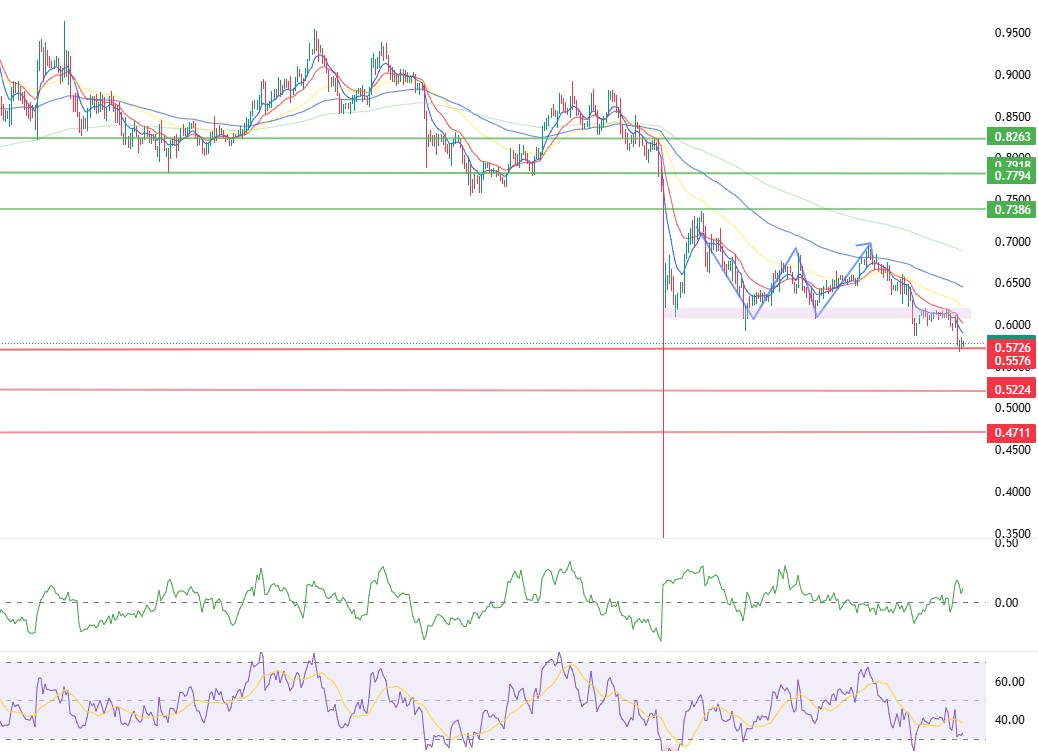
The ADA price fell below the $0.5777 level in the second half of the day, showing a decline due to increased cash outflows and short liquidation rates occurring at the $0.5755 level. After completing a double bottom formation at the start of the week, ADA began its downward movement from the $0.6067 (Pink Line) level. While continuing its price movement within the falling channel in the first retest zone after October 10, the Relative Strength Index (RSI-14) is expected to rise from the 31 level to the buy zone for the retest to be completed and the price to start moving in the trend direction again. Chaikin Money Flow (CMF-20) shows divergence and is closer to the buy zone at the 0.11 level. Decreased momentum and weak signals from the RSI indicator may keep the CMF in negative territory and continue selling pressure. In the event of an upturn due to macroeconomic data or positive news related to the Cardano ecosystem, the first resistance points we will follow can be tracked as a short-term uptrend level in the pullback area at the 0.6067 region. If there is a close above this level, the $0.7163 level could be targeted. If pullbacks occur due to developments in the opposite direction or profit-taking, the $0.5224 level could be tested. A decline to these support levels could indicate an increase in selling momentum, signaling a potential downtrend. This week, the US ADP Nonfarm Employment data is expected to be released, along with the signing of the US-China tariff agreement. If the outcome of the agreement is positive, macroeconomic data or news related to the Cardano ecosystem could change the direction of ADA pricing.
Supports: 0.5726 – 0.5020 – 0.4279
Resistances: 0.7794 – 0.7163 – 0.6067
Legal Notice
The investment information, comments, and recommendations contained herein do not constitute investment advice. Investment advisory services are provided individually by authorized institutions taking into account the risk and return preferences of individuals. The comments and recommendations contained herein are of a general nature. These recommendations may not be suitable for your financial situation and risk and return preferences. Therefore, making an investment decision based solely on the information contained herein may not produce results in line with your expectations.

