
Technical Analysis
BTC/USDT
Trump’s indication of Kevin Hassett as a potential new Fed Chair has drawn attention in the markets, with the decision expected to be announced early next year. The latest peace talks on the Russia-Ukraine war ended without results, but the parties said they would continue discussions. In Japan, the 30-year bond yield rose to a record high of 3.425%, reinforcing expectations of BOJ policy normalization. Michael Saylor announced that the company manages its approximately $60 billion Bitcoin reserves with low leverage and has created a $1.44 billion fund to support dividend payments.
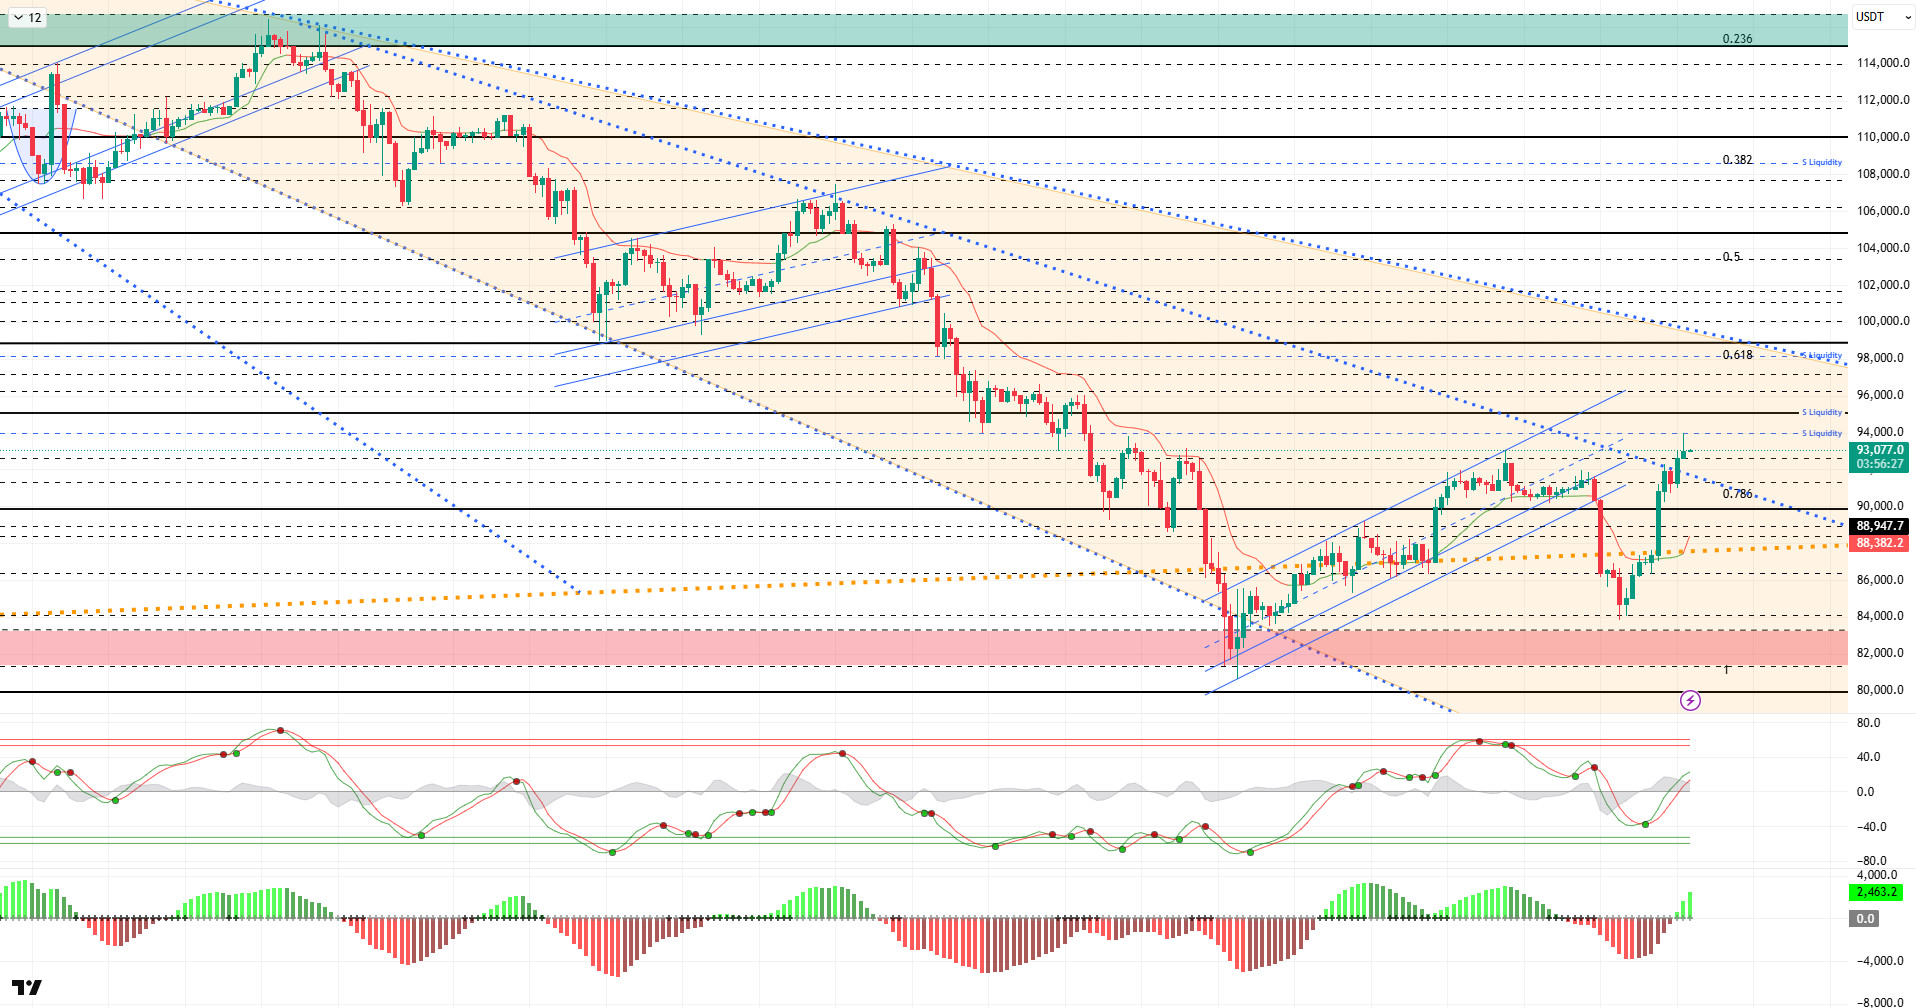
From a technical perspective, BTC broke below the minor upward channel and turned downward, recording a significant decline. In the previous analysis, the price recovered its losses with a U-shaped bounce, reaching the 93,800 level. After surpassing the major uptrend line at the 87,000 level, the price gained momentum and tested the second falling trend line. At the time of writing, it continues to trade slightly bearish at the 92,900 level.
Technical indicators show the Wave Trend (WT) oscillator producing a buy signal just above the oversold zone, while the histogram on the Squeeze Momentum (SM) indicator weakened within the negative zone and moved into positive territory. The Kaufman moving average (KAMA) is currently positioned below the price at the $88,300 level.
According to liquidation data, increased sell-side trading above the 92,000 level was liquidated with the recent rise. The buy level gained some intensity in this area with the break above 90,000, while 83,000 continues to be a heavy buy zone.
In summary, while it is reported that Trump has selected his nominee for Fed chair and will make an announcement, Kevin Hassett, who is open to interest rate cuts, is viewed as a certainty in the markets. On the other hand, Russia-Ukraine peace talks have so far been inconclusive. Technically, after losing the minor uptrend channel, the price recorded a “U”-shaped rise, surpassing the 90,000 reference level and turning its direction towards the 95,000 level. Liquidity data shows that target zones are regaining importance and that the market continues to seek balance. After this stage, 90,000 has once again become a critical point for the price to maintain its momentum. Closings and pricing above this level have become an indicator for regaining momentum. In this context, 95,000 stands out as the next target area, while 90,000 reemerges as the reference area in the event of potential selling pressure.
Supports: 92,600 – 91,400 – 90,000
Resistances: 94,000 – 95,000 – 96,200
ETH/USDT
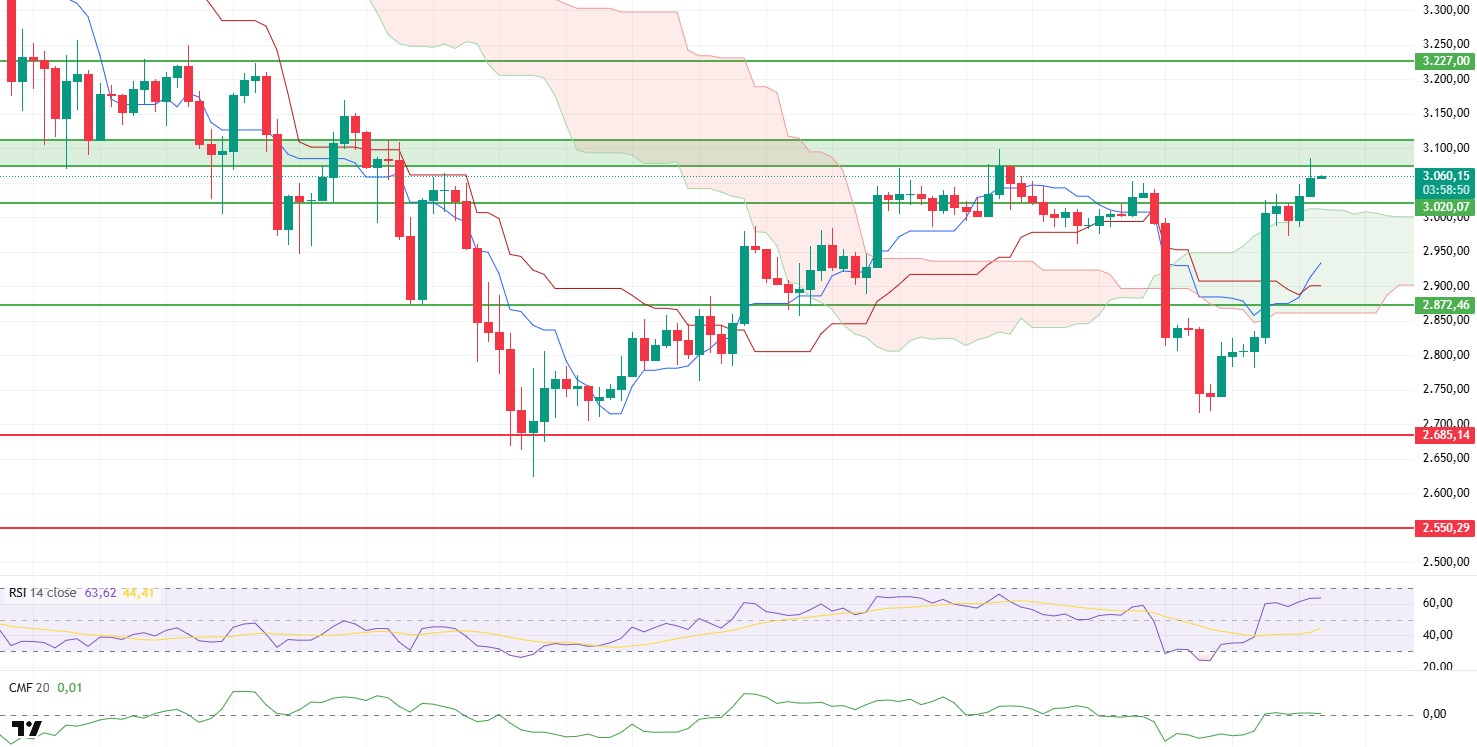
The ETH price showed a strong rise yesterday evening with the positive news flow. US President Donald Trump’s statements that tariffs could be withdrawn increased risk appetite, and the ETH price reacted quickly, rising above the $3,020 level and reaching $3,060. This movement, which saw selling pressure weaken, shows that buyers are trying to regain control.
The liquidity outlook also supports this rise. The Chaikin Money Flow (CMF) indicator moving into positive territory confirms that capital inflows into the market are accelerating. This recovery seen in the higher time frame provides a significant advantage in terms of the sustainability of the rise.
The picture is even stronger on the momentum side. The Relative Strength Index (RSI) indicator has risen above the 67 level, significantly increasing momentum. This structure indicates that the motivation to test resistance levels is high and that trend strength is shifting in favor of buyers.
From a technical perspective, it is clear that the trend has turned decisively positive. The price breaking above the Ichimoku cloud’s upper band and the Tenkan line crossing above the Kijun line are emerging as confirmation signals for a new uptrend. This picture has also shifted the asset’s medium-term technical outlook to positive.
Looking at the overall structure, it can be said that optimism is regaining strength on the ETH side. As long as it settles above the $3,020 level, the upward momentum will be maintained. If the resistance zone shown by the green rectangle on the chart is broken, the rise is expected to continue much more sharply and rapidly. Conversely, closes below the $3,020 level could trigger renewed weakness and cause the price to pull back in the short term. In summary, Ethereum has returned to a positive trend, but for the uptrend to continue, it is critical that both the price and liquidity indicators maintain their upward momentum.
Below the Form
Supports: 3,020 – 2,872 – 2,685
Resistances: 3,112 – 3,227 – 3,436
XRP/USDT
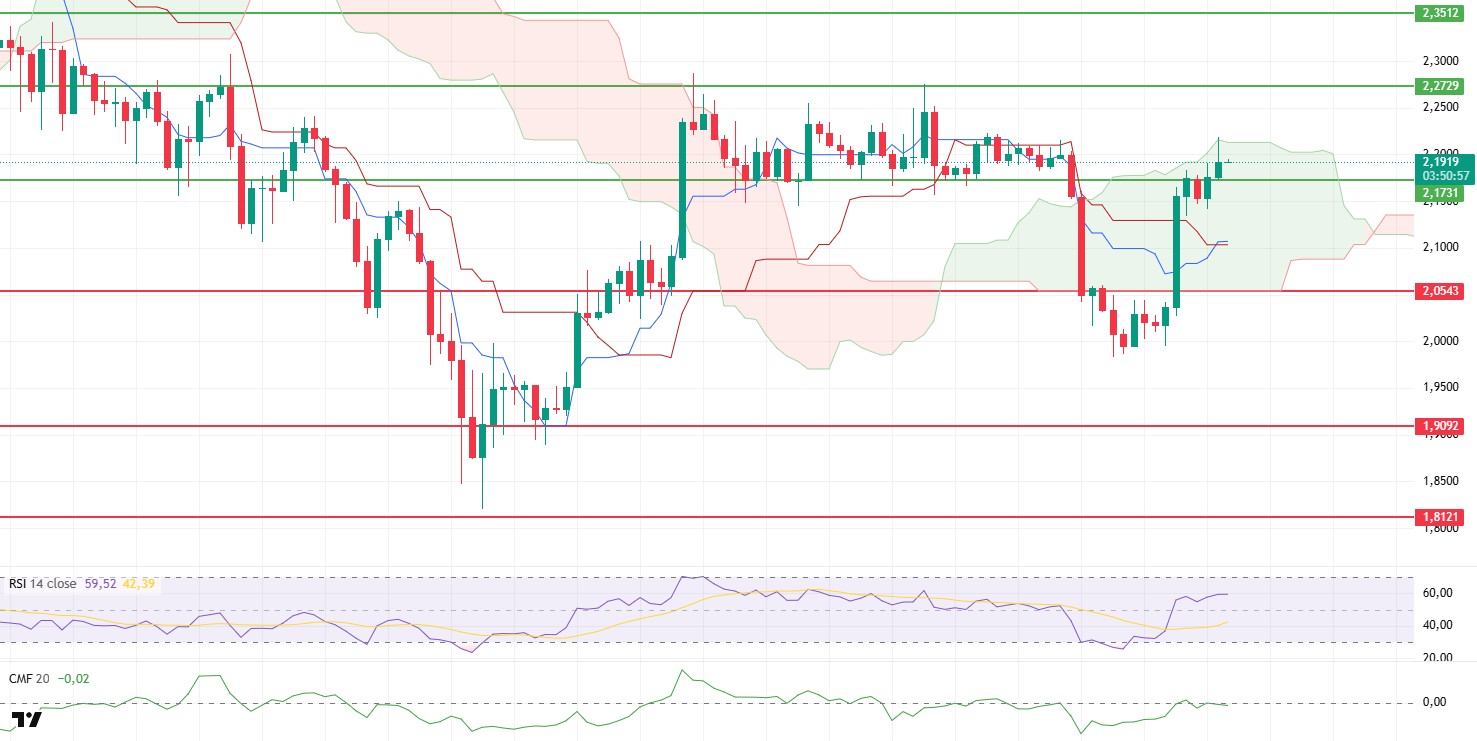
The XRP price gained momentum after breaking through the $2.05 resistance level amid strong buyer interest during the day, rising above the $2.17 level and achieving a significant short-term recovery. This rise signals the first break in the negative structure that has been dominant in recent days.
The liquidity outlook, however, is mixed. Although the Chaikin Money Flow (CMF) indicator accompanied the rise, it only managed to climb to the zero line and continues to move sideways here. This structure indicates that the rise was fueled more by futures positions than spot purchases and signals that the movement has not yet settled on a solid foundation.
Momentum, on the other hand, has gained significant strength. The Relative Strength Index (RSI) indicator continues its upward trend, revealing that buyers have become more dominant in the market. The increasingly aggressive structure of the RSI enhances the potential for the uptrend to continue.
The technical outlook on the Ichimoku indicator is more positive. The price breaking above the Tenkan and Kijun levels indicates that a trend reversal is supported in the short term. Additionally, the price reaching the upper band of the Kumo cloud and attempting to approach this level again indicates that a strong resistance battle continues in the market.
Overall, the outlook points to a stronger recovery compared to recent days. If XRP manages to close above the upper band of the cloud at $2.2144, it could pave the way for a sharp rise towards the $2.27 resistance. Conversely, losing the $2.17 support could reignite selling pressure, especially given weak liquidity conditions, and bring the short-term downside scenario back into focus.
Supports: 1.9092 – 1.8121 – 1.6224
Resistances: 2.0543 – 2.1731 – 2.2729
SOL/USDT
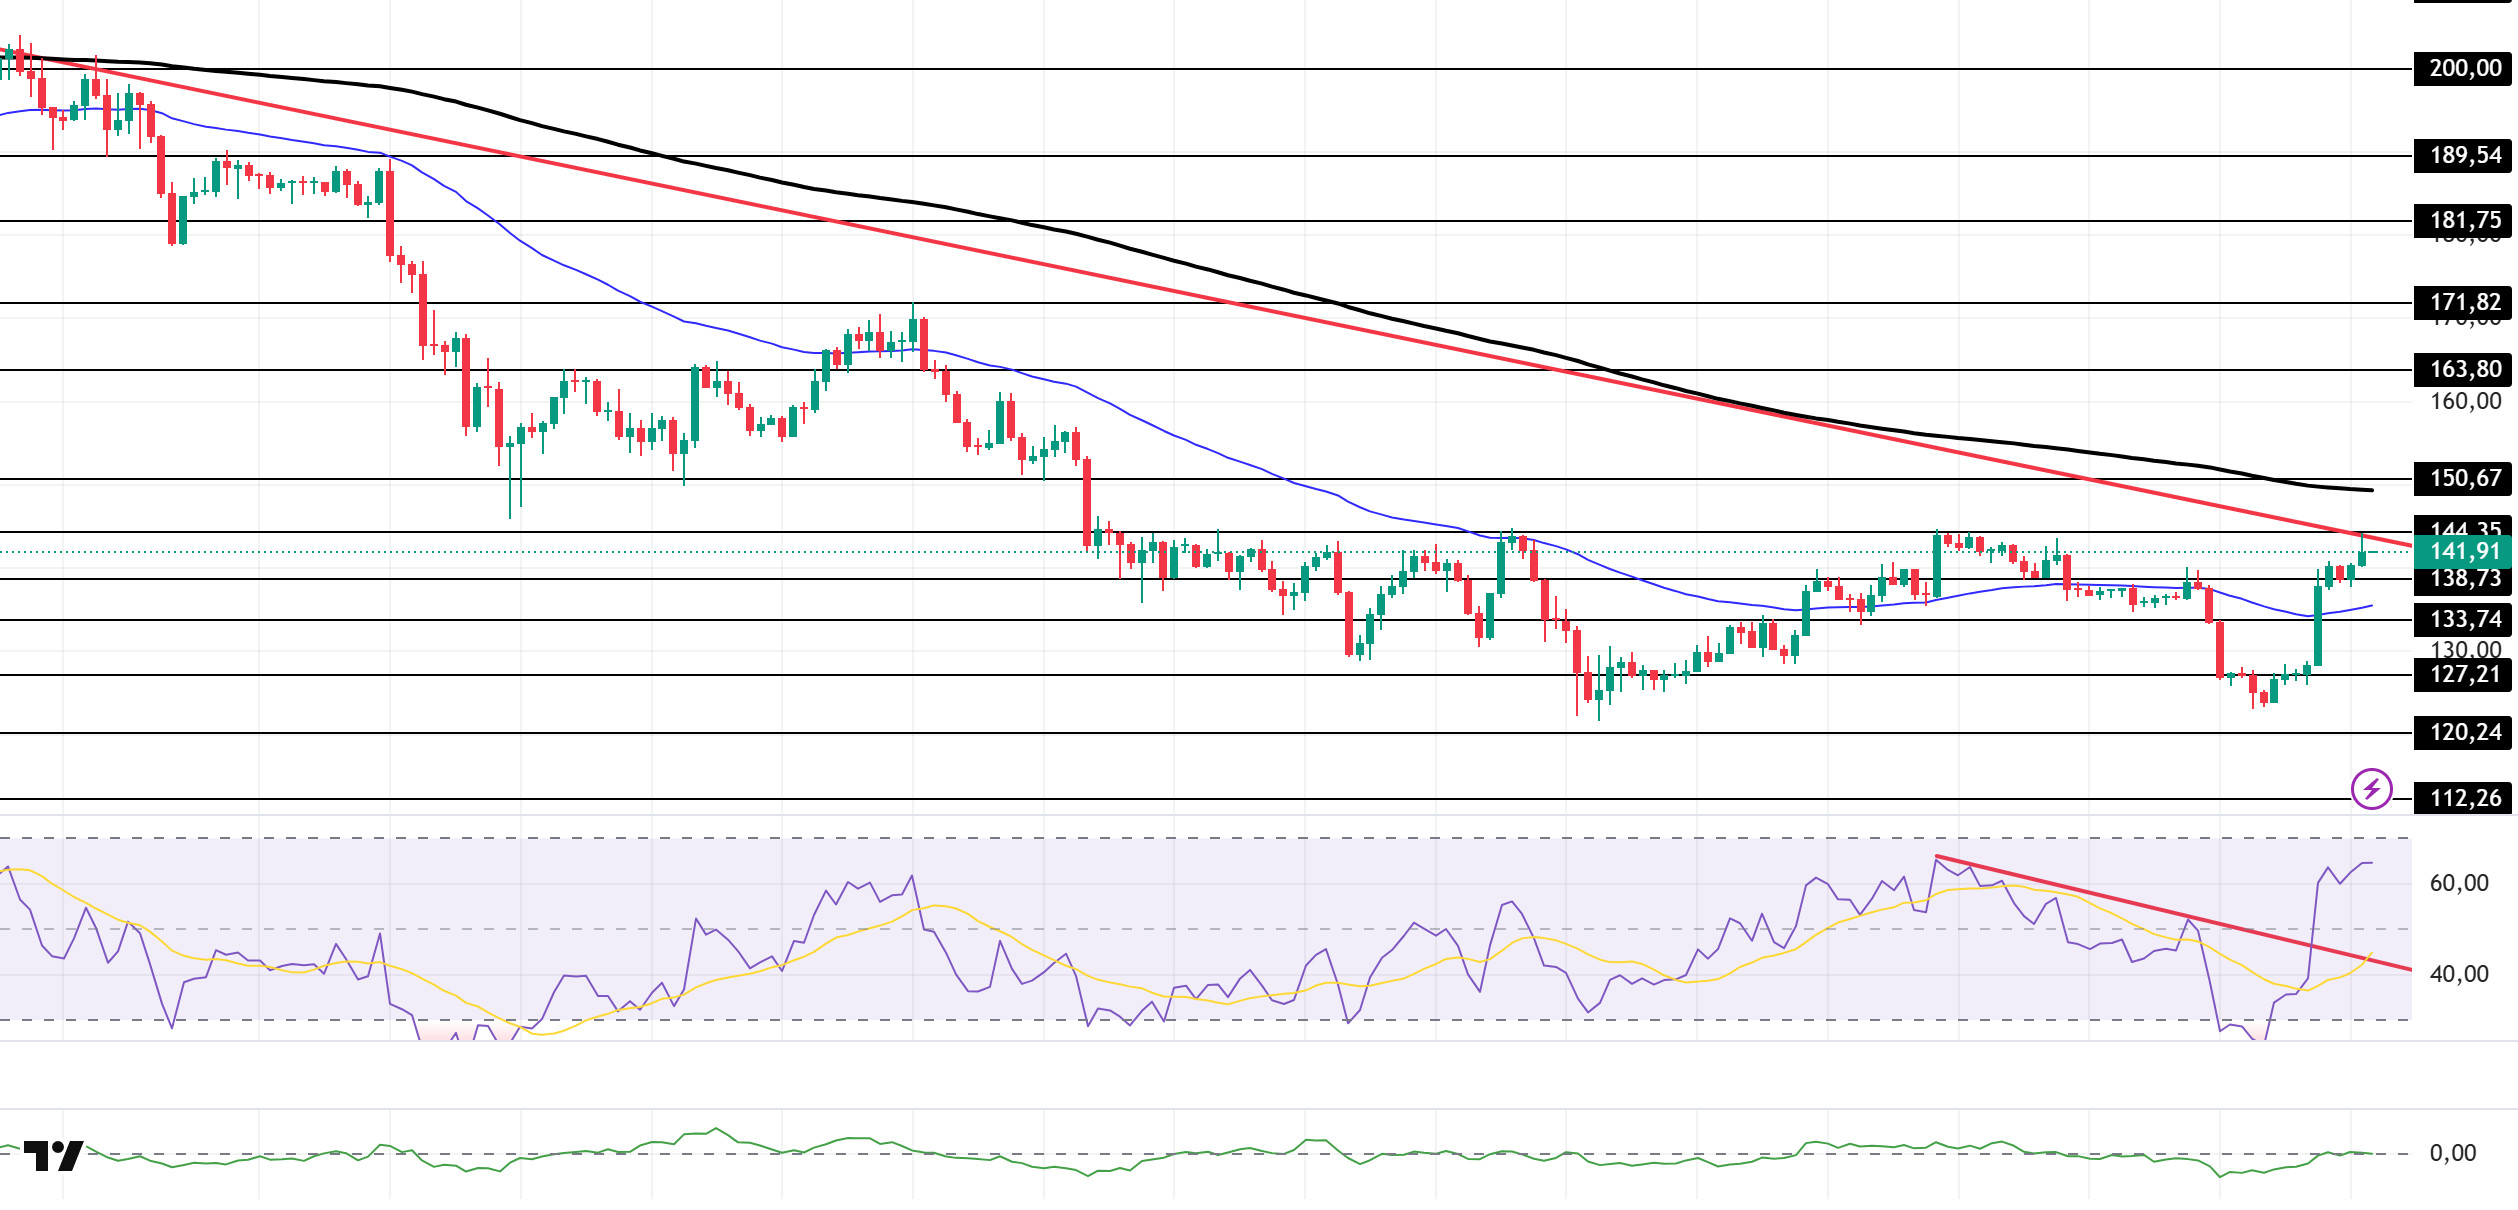
SOL continued its upward price movement. The asset remained in the lower region of the downward trend that began on October 6. Testing the strong resistance level of $127.21, the price gained momentum from there and broke above the 50 EMA (Blue Line) moving average. Currently testing the downward trend as resistance, the asset could test the 200 EMA (Black Line) moving average if it closes above this level. In case of a pullback, the 50 EMA (Blue Line) moving average should be monitored.
On the 4-hour chart, it continued to trade below the 50 EMA (Exponential Moving Average – Blue Line) and 200 EMA (Black Line). This indicates a possible downtrend in the medium term. At the same time, the price being between the two moving averages shows us that the asset is in a decision phase in the short term. The Chaikin Money Flow (CMF-20) is at a neutral level. However, an increase in money inflows could push the CMF into positive territory. The Relative Strength Index (RSI-14) rose towards the overbought zone, indicating a sharp increase in buying appetite. At the same time, it has moved to the upper region of the downward trend that began on November 26. This could increase buying pressure. If there is an increase due to macroeconomic data or positive news related to the Solana ecosystem, the $163.80 level stands out as a strong resistance point. If this level is broken upwards, the increase is expected to continue. In case of pullbacks due to developments in the opposite direction or profit-taking, the $127.21 level may be tested. If the price falls back to these support levels, an increase in buying momentum could present a potential upside opportunity.
Supports: 138.73 – 133.74 – 127.21
Resistances: 144.35 – 150.67 – 163.80
DOGE/USDT
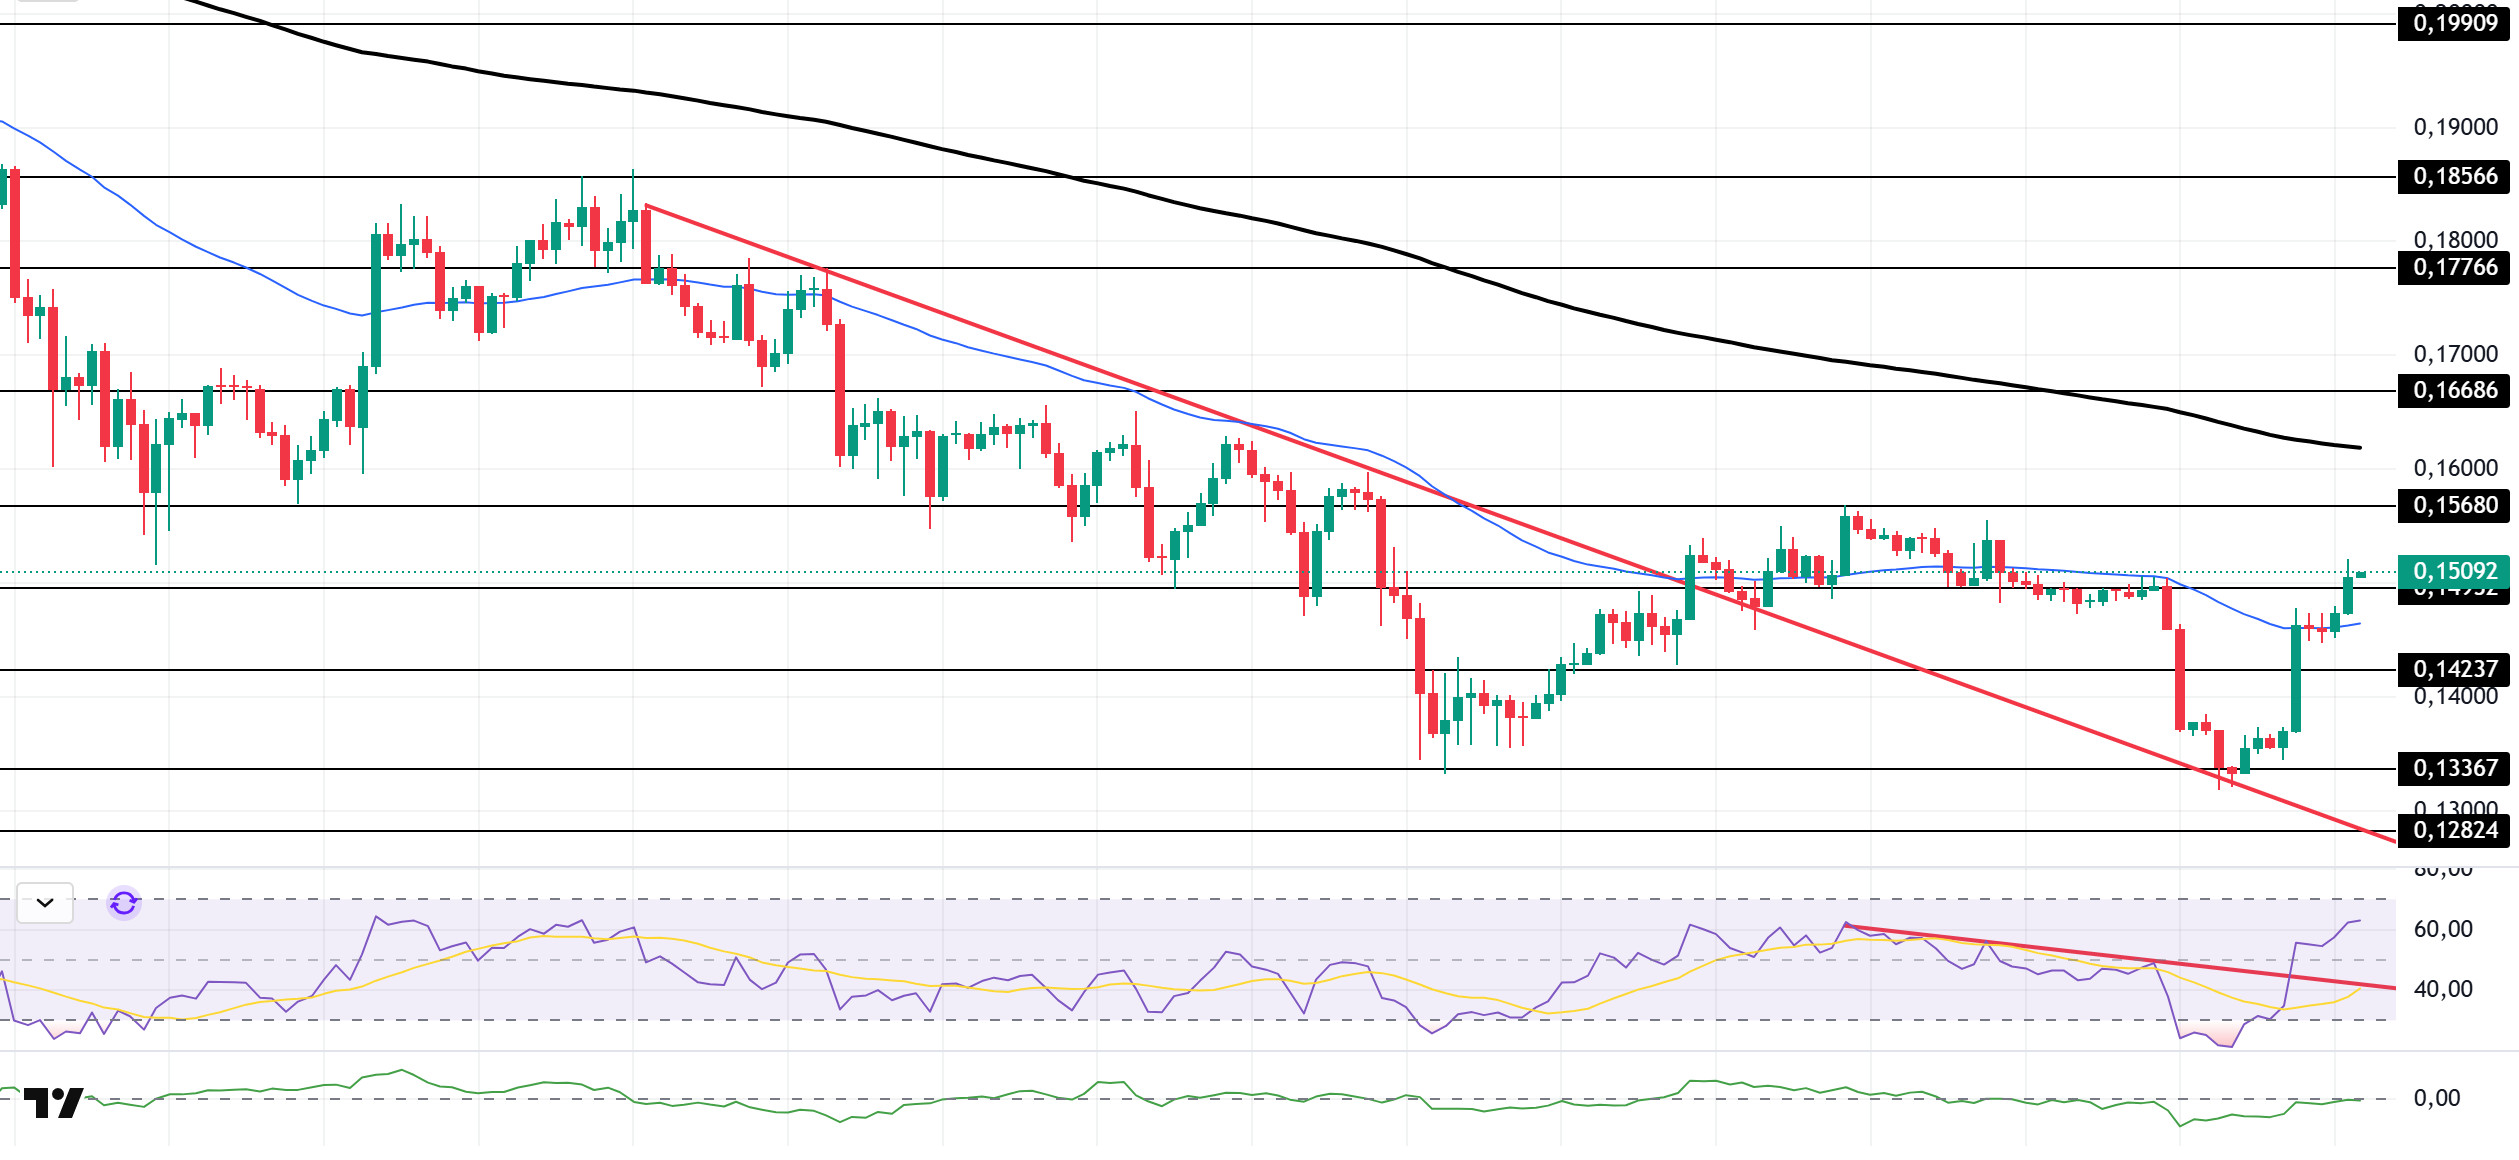
DOGE price maintained its momentum. The asset gained value by gaining downward momentum starting on November 11. As of now, the price has broken above the 50 EMA (Blue Line) moving average. If the upward trend continues, it may test the 200 EMA (Black Line) moving average as resistance. In the event of a pullback, the 50 EMA (Blue Line) moving average could act as support again.
On the 4-hour chart, the 50 EMA (Exponential Moving Average – Blue Line) remained below the 200 EMA (Black Line). This indicates that a downtrend may begin in the medium term. The price being between both moving averages indicates that the price is in a decision phase in the short term. The Chaikin Money Flow (CMF-20) has risen to a neutral level. Additionally, the balance of money inflows and outflows may keep the CMF at a neutral level. The Relative Strength Index (RSI-14) accelerated from the oversold zone to the middle of the positive zone. At the same time, it crossed above the upper zone of the downward trend that began on November 26. This signaled the formation of buying pressure. In the event of potential increases driven by political developments, macroeconomic data, or positive news flow within the DOGE ecosystem, the $0.16686 level stands out as a strong resistance zone. Conversely, in the event of negative news flow, the $0.13367 level could be triggered. A decline to these levels could increase momentum and initiate a new wave of growth.
Supports: 0.14952 – 0.14237 – 0.13367
Resistances: 0.15680 – 0.16686 – 0.17766
AVAX/USDT
AVAX started the day at $12.76 yesterday and closed at $13.62 after increasing buying throughout the day. AVAX gained approximately 6.75% yesterday. With this strong rise yesterday, AVAX managed to break through the $13.50 level and the 20-period Exponential Moving Average (EMA20). Starting the new day with an increase, AVAX is currently trading at $14.13, with an approximate 3.7% increase in value. As the upward momentum that began yesterday continued today, AVAX rose above the EMA50 level and climbed to the upper band of the EMA100 and bearish channel. However, it experienced a slight pullback in this region due to increased selling pressure. The recovery trend in the cryptocurrency market as a whole supports AVAX, while positive news from the Avalanche ecosystem and institutional interest are also among the key factors driving the rise.
On the 4-hour chart, the MACD line crossed above the signal line during AVAX’s rise, strengthening AVAX’s short-term momentum. The MACD is pointing upwards. Although the MACD line is still trading in negative territory, it is moving very close to positive territory. If the MACD crosses into positive territory, the rise could gain further momentum and break through resistance levels more strongly. Additionally, while AVAX traded below all critical Exponential Moving Average (EMA) levels yesterday, it continues to trade above the EMA20 and EMA50 levels as of today. This indicates a strengthening recovery trend in the short term. However, AVAX faced selling pressure at the EMA100 level during its rise. Retesting and breaking this level during the day is critical for the uptrend to continue. Furthermore, AVAX tested the upper band of the bearish channel during today’s rise, and a breakout of the channel could accelerate the uptrend.
From a technical perspective, the $14.21 level, the EMA100 level, and the upper band of the bearish channel stand out as the first significant resistance zone in the short term for AVAX’s rise. Closing above these levels for 4 hours could strengthen AVAX’s rise and pave the way for AVAX to move towards the $15.10 and $15.75 resistance zones. Breaking the EMA100 and the upper band of the bearish channel is particularly critical for a trend reversal. A strengthening MACD and its move into positive territory could also support this scenario. Otherwise, selling pressure at resistance levels could limit the upside. In AVAX’s downward movement, the $13.50 level and the EMA20 level are the first important support zones. Closings below this level could cause AVAX to weaken again and pull back towards the $12.57 and $11.88 support zones.
(EMA20: Red Line, EMA50: Green Line, EMA100: Blue Line, EMA200: Purple Line)
Supports: 13.50 – 12.57 – 11.88
Resistances: 14.21 – 15.10 – 15.75
“AVAXUSDT Image to be Added”
LINK/USDT
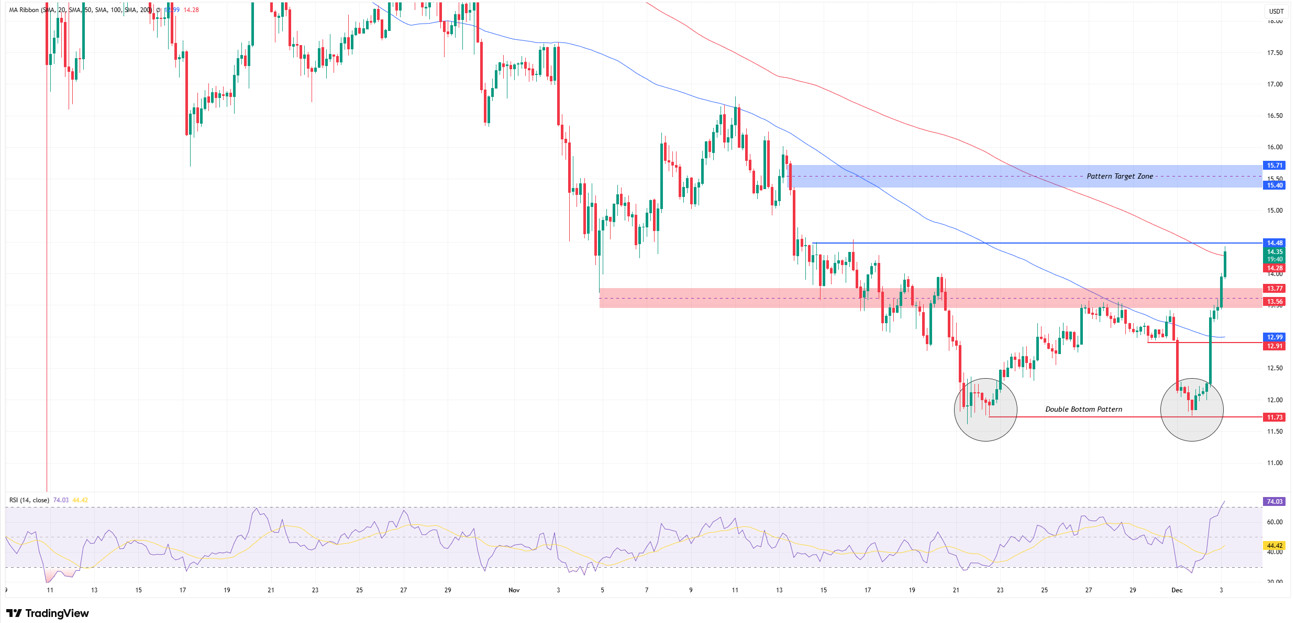
Looking at the chart structure, we see that the price has formed a double bottom pattern at the $11.73 level. The $13.56 – $13.77 band, which is the neckline of the pattern, has been broken upwards with strong volume, activating the structure. Although this breakout increases the possibility of a trend reversal in the short term, it is crucial that the price is just above our 200-day moving average, which is in the $14.28 – $14.45 range, and closes above this level on a 4-hour basis. However, if the closing candle remains below the average and only leaves a wick above, we may see sharp pullbacks. If the upward breakout continues, the formation target of $15.40–$15.71 will emerge as the zone where profit-taking will be triggered. Additionally, since this area is an important supply zone that has seen heavy selling pressure in the past, we can expect the uptrend to be limited here.
In downward price movements, the first short-term support will be in the $13.77–$13.56 range. Since this area is now the broken neckline, it is quite critical for maintaining the uptrend. If this support is lost, the price may retreat towards the $12.91 band. In deeper declines, the level below $11.73, which would invalidate the formation, may come back into focus. Therefore, we can say that the $13 level is the first level to watch in order to maintain positive expectations.
Although reaching the 74 level on the Relative Strength Index (RSI) increases the possibility of a short-term cooling, we can consider excessive buying movements after trend breaks as normal in strong trends. However, even if there are pullbacks on the RSI, maintaining the trend above the 45–50 band will help keep the momentum positive.
Supports: 13.56 – 12.91 – 11.73
Resistances: 14.48 – 15.40 – 15.71
Legal Notice
The investment information, comments, and recommendations contained herein do not constitute investment advice. Investment advisory services are provided individually by authorized institutions taking into account the risk and return preferences of individuals. The comments and recommendations contained herein are of a general nature. These recommendations may not be suitable for your financial situation and risk and return preferences. Therefore, making an investment decision based solely on the information contained herein may not produce results in line with your expectations.

