
Technical Analysis
BTC/USDT
Global markets have refocused their attention on the US-China relationship. President Donald Trump announced that he will meet with Chinese President Xi Jinping within two weeks, stating that the current tariff policy is “unsustainable.” The meeting is expected to address strategic issues, including the trade balance, technology exports, and rare earth elements. White House Economic Advisor Kevin Hassett emphasized that monetary policy should continue to ease, stating that “the expected three interest rate cuts are just the beginning.” On the Bank of Japan (BOJ) front, Vice Governor Shinichi Uchida signaled that interest rate hikes could continue. The VIX, known as the “fear index,” rose to 27.17, reaching its highest level in the last five months and increasing anxiety in the markets.
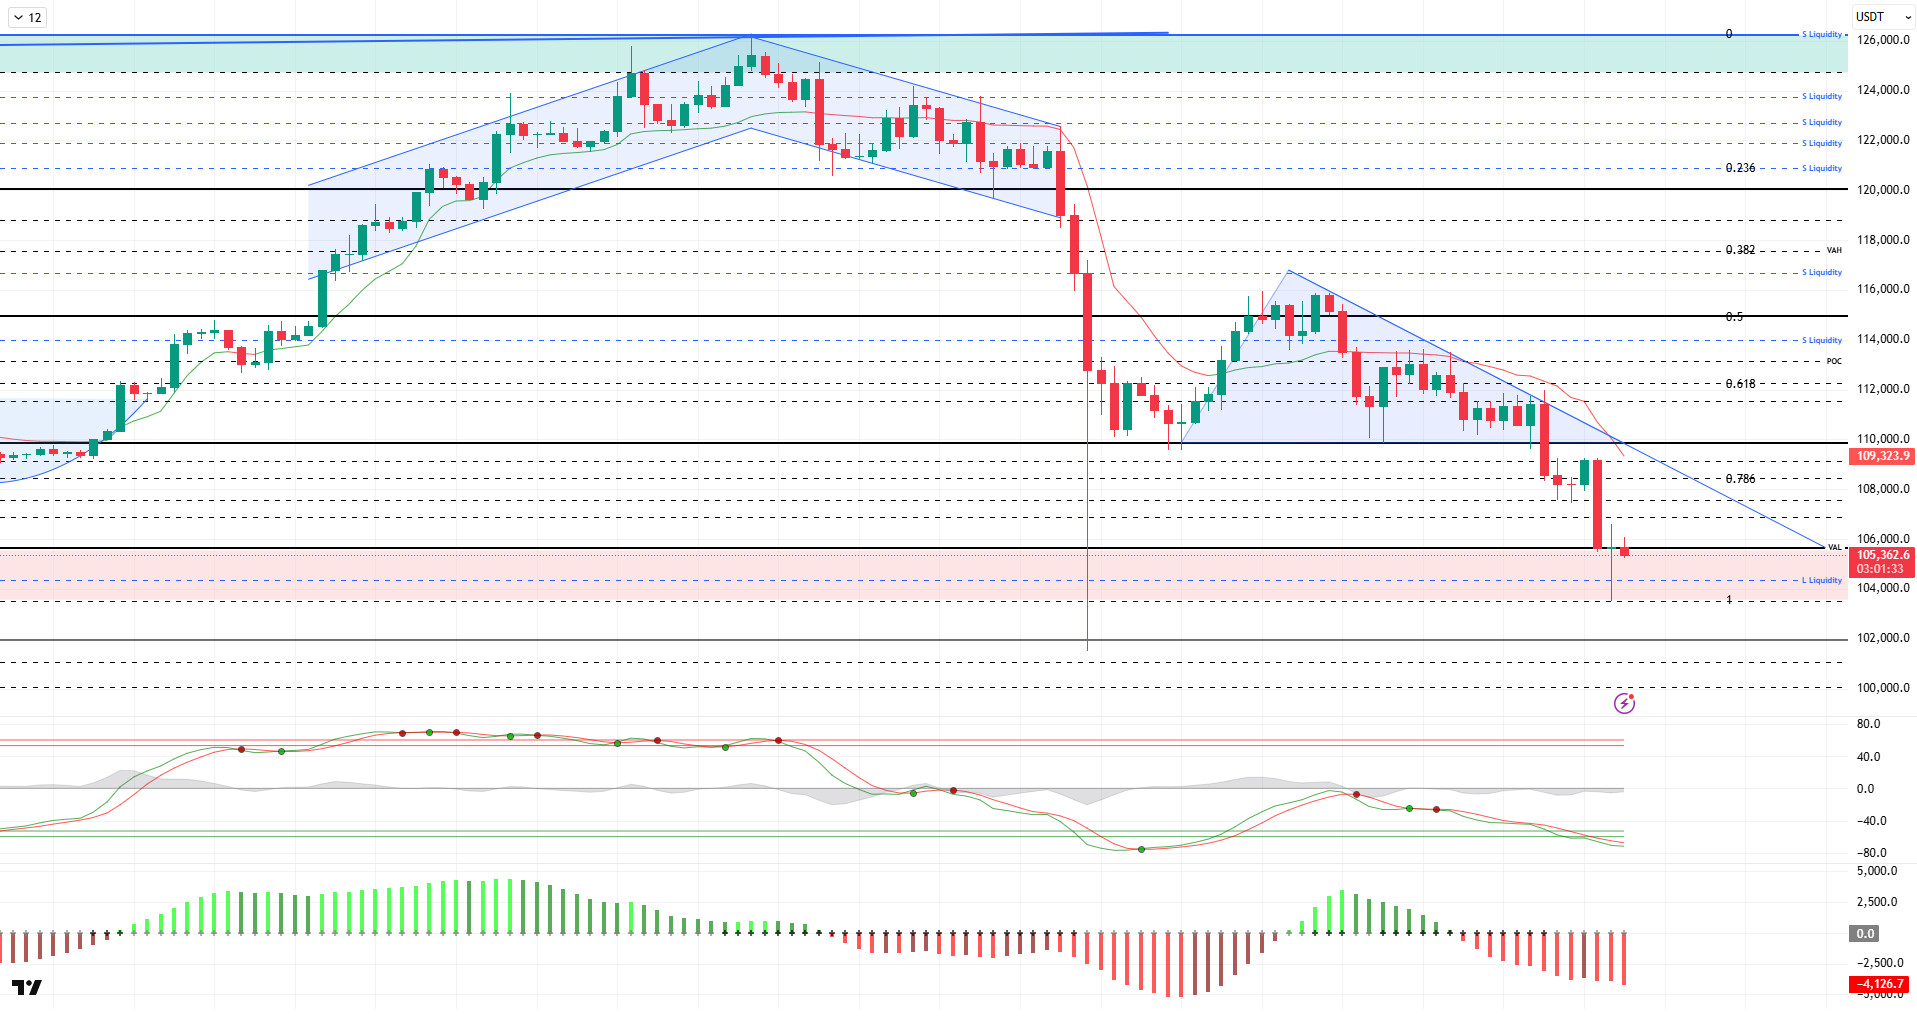
From a technical perspective, deepening the bearish and volatile price movements seen in the previous analysis, the price briefly fell below the 105,000 level, testing the 103,300 level. Following this doji candle, the price returned above the 105,000 level and is now attempting to hold there. Filling the candle that had previously spiked and retreated within a gradually declining trend structure, BTC is trading at the 105,500 level at the time of writing.
Technical indicators show that the Wave Trend (WT) oscillator has fallen below the oversold zone. On the Squeeze Momentum (SM) indicator, the histogram failed to gain strength in the negative zone. The Kaufman moving average (KAMA) is currently at $109,300, positioned above the price.
According to liquidation data, the short-term buying level has intensified at 104,300 on a daily basis, while accumulation is very rare on a weekly and monthly basis, with intensity seen at 93,000 on a six-month basis. In contrast, the selling level is concentrated in the 113,700–113,900 range in the short term, while concentration continues above the 120,000 level in the long term.
In summary, on the fundamental side, the renewed tariff tensions between the US and China, the continued US government shutdown, and the Russia-Ukraine crisis continue to weigh on the price. Technically, BTC reached saturation point by testing its all-time high (ATH) at $126,198. After this level, liquidity data became the main factor triggering the price correction. After a sharp sell-off, BTC recovered somewhat but failed to hold above the $115,000 level and faced renewed selling pressure, falling back to the $110,000 level. Losing the 110,000 level, which we were tracking as a critical reference point, the price briefly fell to 103,300 but then rose back above the 105,000 level. In the coming period, holding above the 105,000 level will be of great importance. In the event of a correction to the decline, we will track the 107,400 and then 108,500 levels during the day. A break in the downward trend could allow the price to return to a bullish structure. Otherwise, rejection from this level could deepen the decline, leading to a loss of six-digit levels.
Supports: 106,600 – 105,000 – 103,000
Resistances: 107,400 – 108,500 – 110,000
ETH/USDT
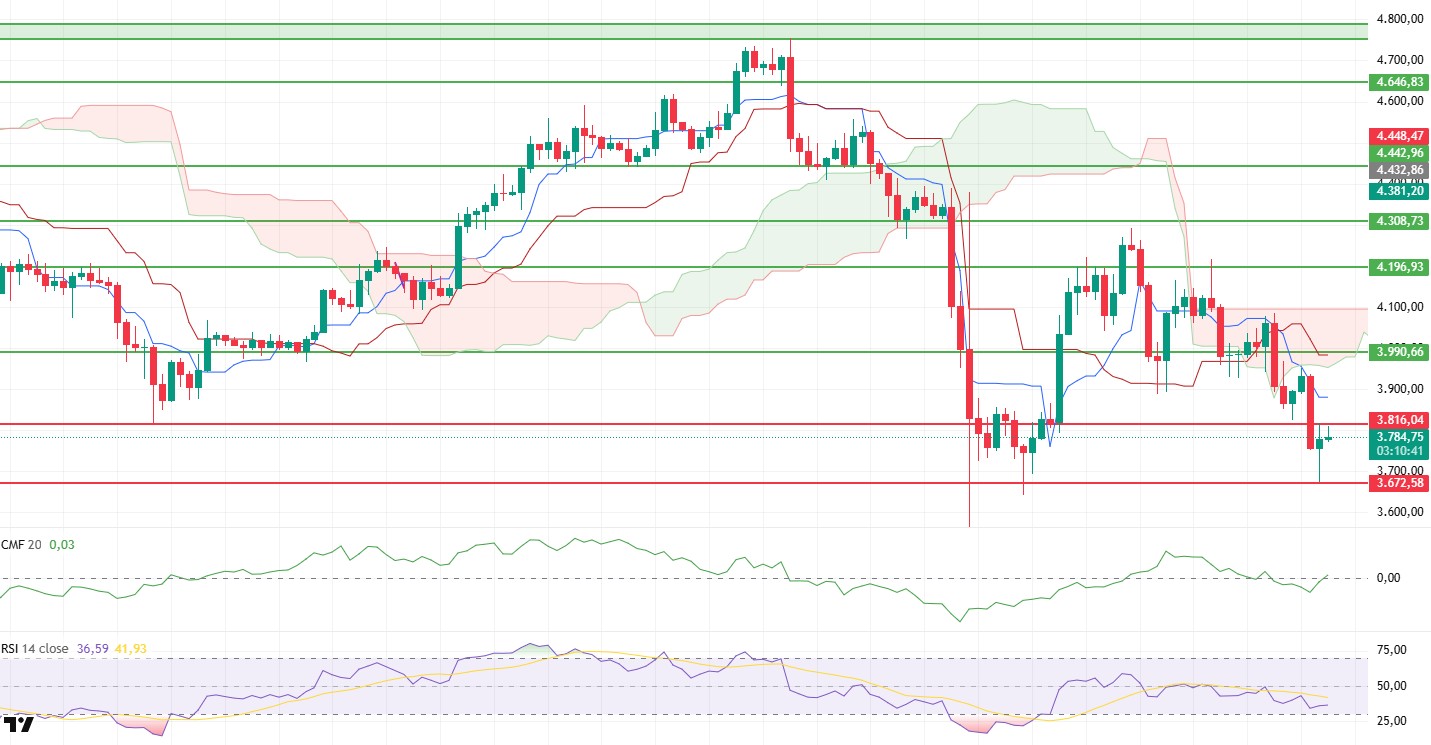
As mentioned in the morning analysis, the ETH price fell sharply to $3,672 after losing the $3,816 support level. With the reactionary buying from this area, the price recovered to the $3,816 level but is struggling to stay above it. The market’s attempt to hold at this level indicates that the search for direction continues in the short term.
The Chaikin Money Flow (CMF) indicator moving back into positive territory reveals that liquidity inflows into the market have begun and capital flows have turned in favor of prices. This development signals that selling pressure has eased and buyers are regaining strength in the short term.
The Relative Strength Index (RSI) continues its weak trend; the ongoing loss of momentum indicates that buyers have not yet fully taken control. The RSI remaining below the 50 level suggests that recovery attempts may be limited.
The Ichimoku indicator maintains its overall outlook. The price remaining below the kumo cloud confirms the continuation of the downward trend technically. The Tenkan level remaining below the Kijun level also supports the continuation of short-term weakness.
Looking at the overall picture, if the ETH price breaks above the $3,816 level, an upward movement is expected to gain momentum. However, if the price remains below this level, the possibility of retesting the $3,672 support level will increase.
Top of Form
Below the Form
Supports: 3,990 – 3,816 – 3,672
Resistances: 4,196 – 4,308 – 4,442
XRP/USDT
Following the weak outlook indicated in the morning analysis, the XRP price lost its $2.35 support and fell to $2.19 during the day. With buying at this level, the price rose back to $2.28, but the overall market structure remains fragile. Although buyers appear to be gaining strength at this level, the impact of selling pressure has not fully subsided.
Although the Chaikin Money Flow (CMF) indicator has turned upward, it remains in negative territory, revealing that liquidity inflows are limited and capital flows have not fully shifted in favor of prices. This structure indicates that the market needs stronger capital support for upward movements to gain traction.
The Relative Strength Index (RSI) indicator maintains its morning outlook. Weak momentum indicates that buyers have not yet taken an active role in the market and that short-term recovery attempts may remain limited.
The overall outlook from the Ichimoku indicator perspective remains unchanged. The price continuing to stay above the upper band of the Kumo cloud indicates that the market is technically continuing its efforts to stabilize.
Overall, XRP holding the $2.28 level suggests that a short-term sideways consolidation may continue. However, a drop below this level could trigger a new pullback towards the $2.07 region. Conversely, if the $2.35 level is regained, market equilibrium could shift in favor of buyers, and the price could rebound towards the $2.47 resistance level.
Supports: 2.4730 – 2.3512 – 2.0768
Resistances: 2.6513 – 2.7306 – 2.8576

SOL/USDT
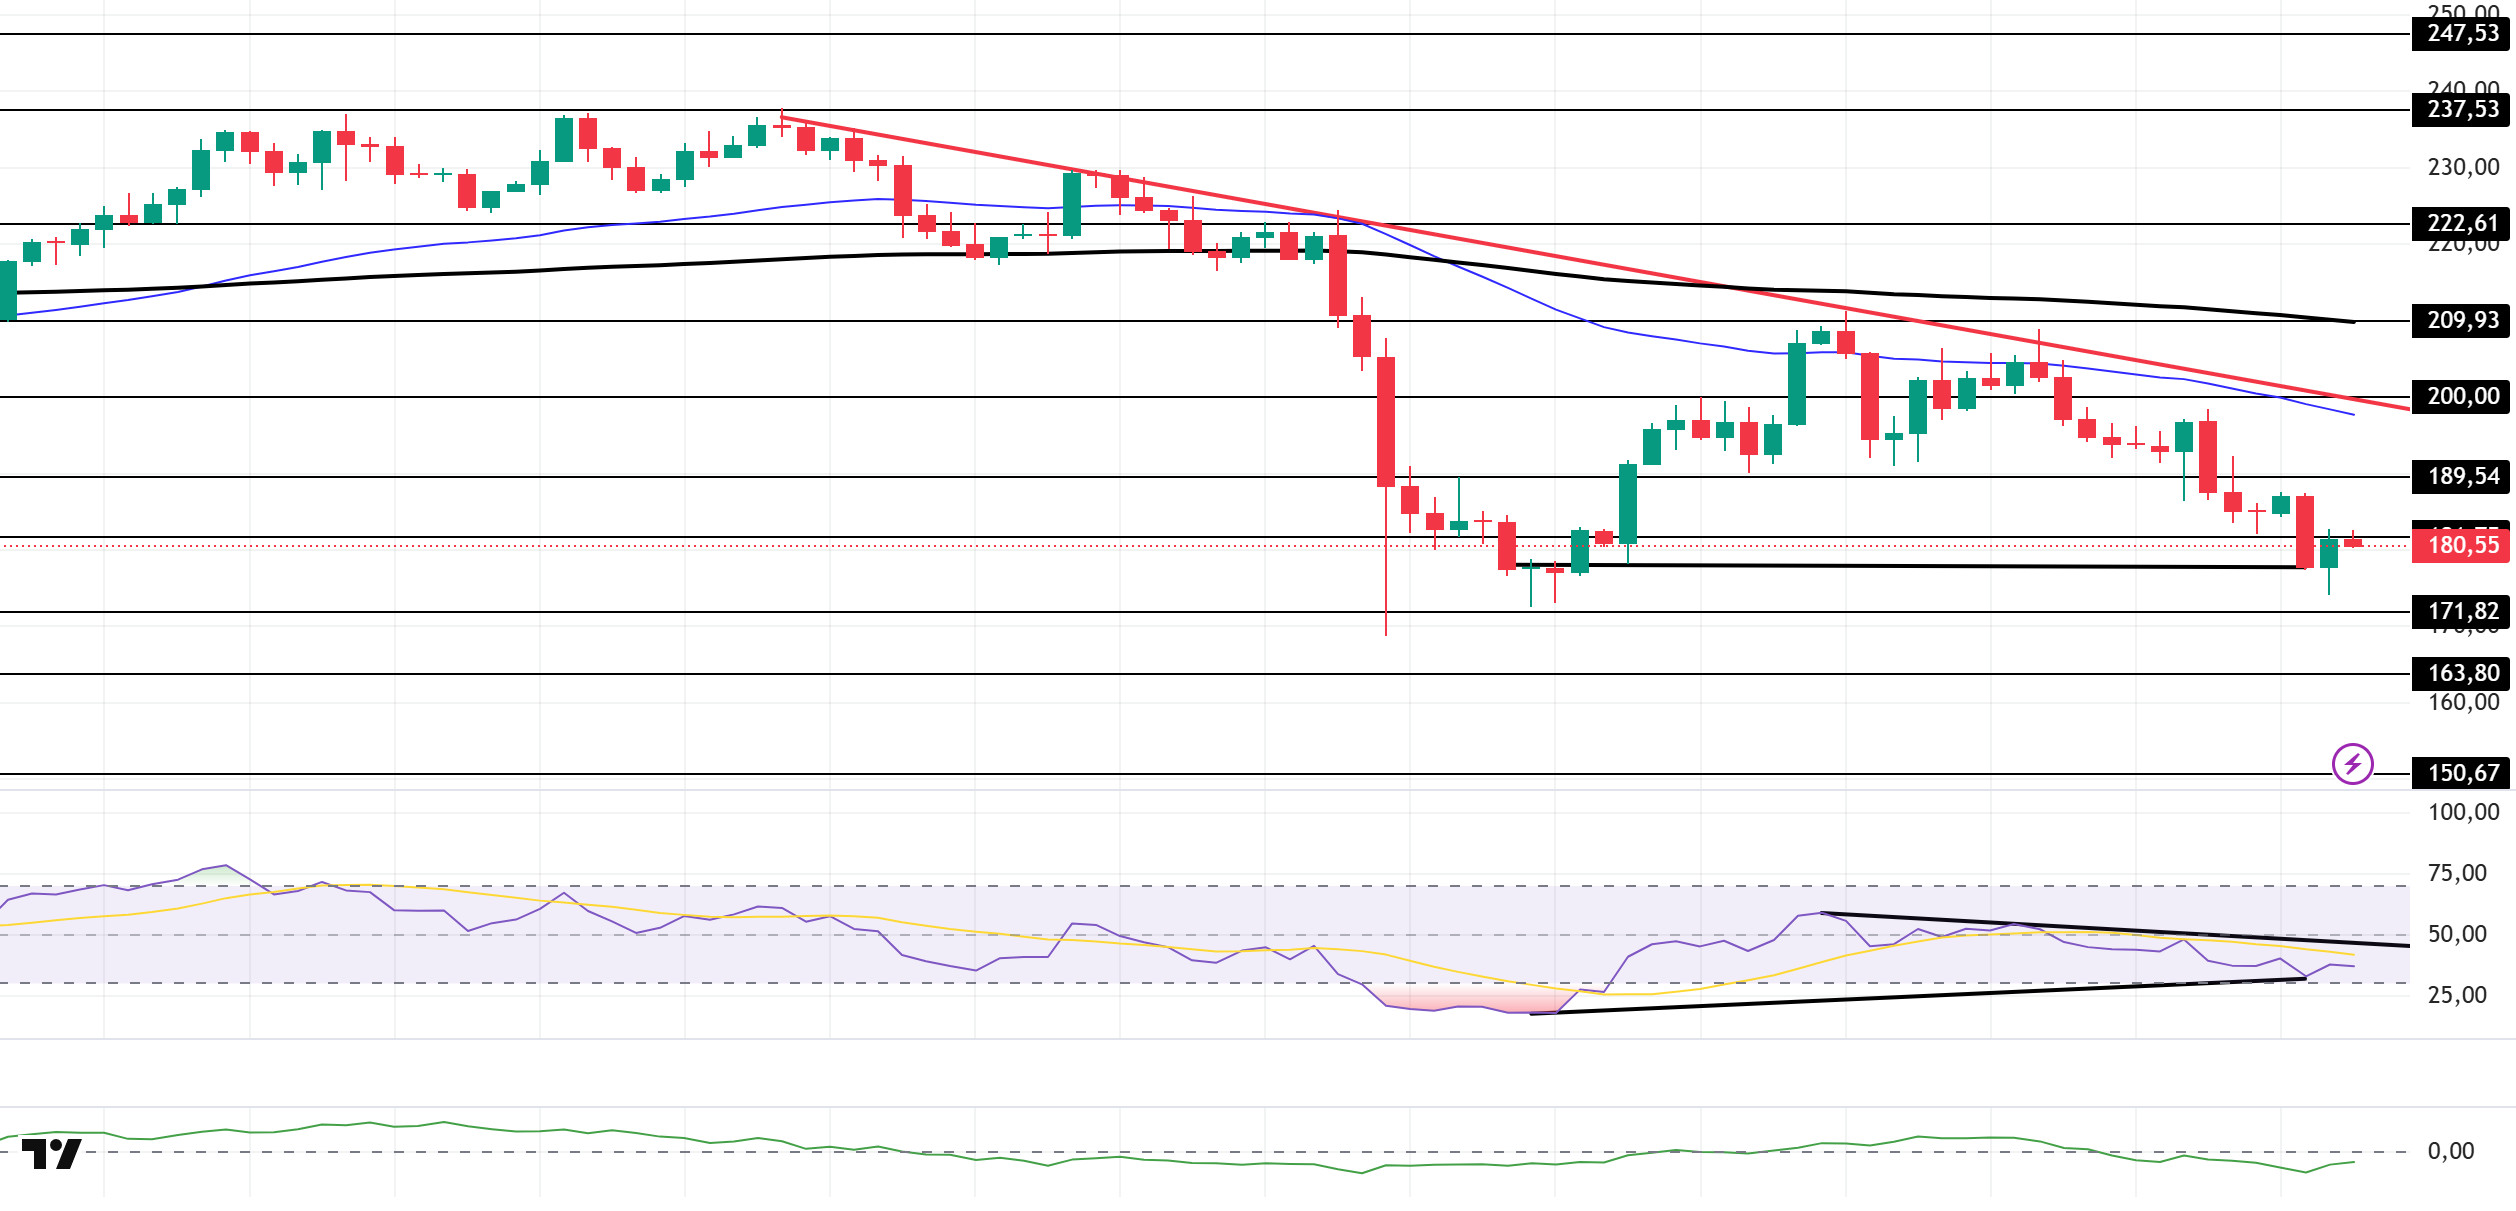
The SOL price continued its decline during the day. The asset remains in the lower region of the downward trend that began on October 6. Testing the $189.54 level as resistance, the price failed to break through and experienced a decline, starting to trade below the strong support level of $181.75. If the pullback continues, the $163.80 level could be triggered. If the uptrend begins, the $189.54 level and the 50 EMA (Blue Line) moving average should be monitored.
On the 4-hour chart, it remained below the 50 EMA (Exponential Moving Average – Blue Line) and 200 EMA (Black Line). This indicates that it may be in a downtrend in the medium term. At the same time, the price being below both moving averages shows us that the asset is in a downtrend in the short term. The Chaikin Money Flow (CMF-20) remained in negative territory. However, an increase in money inflows could push the CMF into positive territory. The Relative Strength Index (RSI-14) remained below the downward trend that began on October 13 and continued to hover around the midpoint of the negative zone. This signaled that selling pressure persisted. On the other hand, there is a bullish divergence. This could push the price up. If there is an uptrend due to macroeconomic data or positive news related to the Solana ecosystem, the $200.00 level stands out as a strong resistance point. If this level is broken upwards, the uptrend is expected to continue. If there are pullbacks due to developments in the opposite direction or profit-taking, the $163.80 level could be tested. If the price falls back to these support levels, an increase in buying momentum could present a potential upside opportunity.
Supports: 171.82 – 163.80 – 150.67
Resistances: 181.75 – 189.54 – 200.00
DOGE/USDT
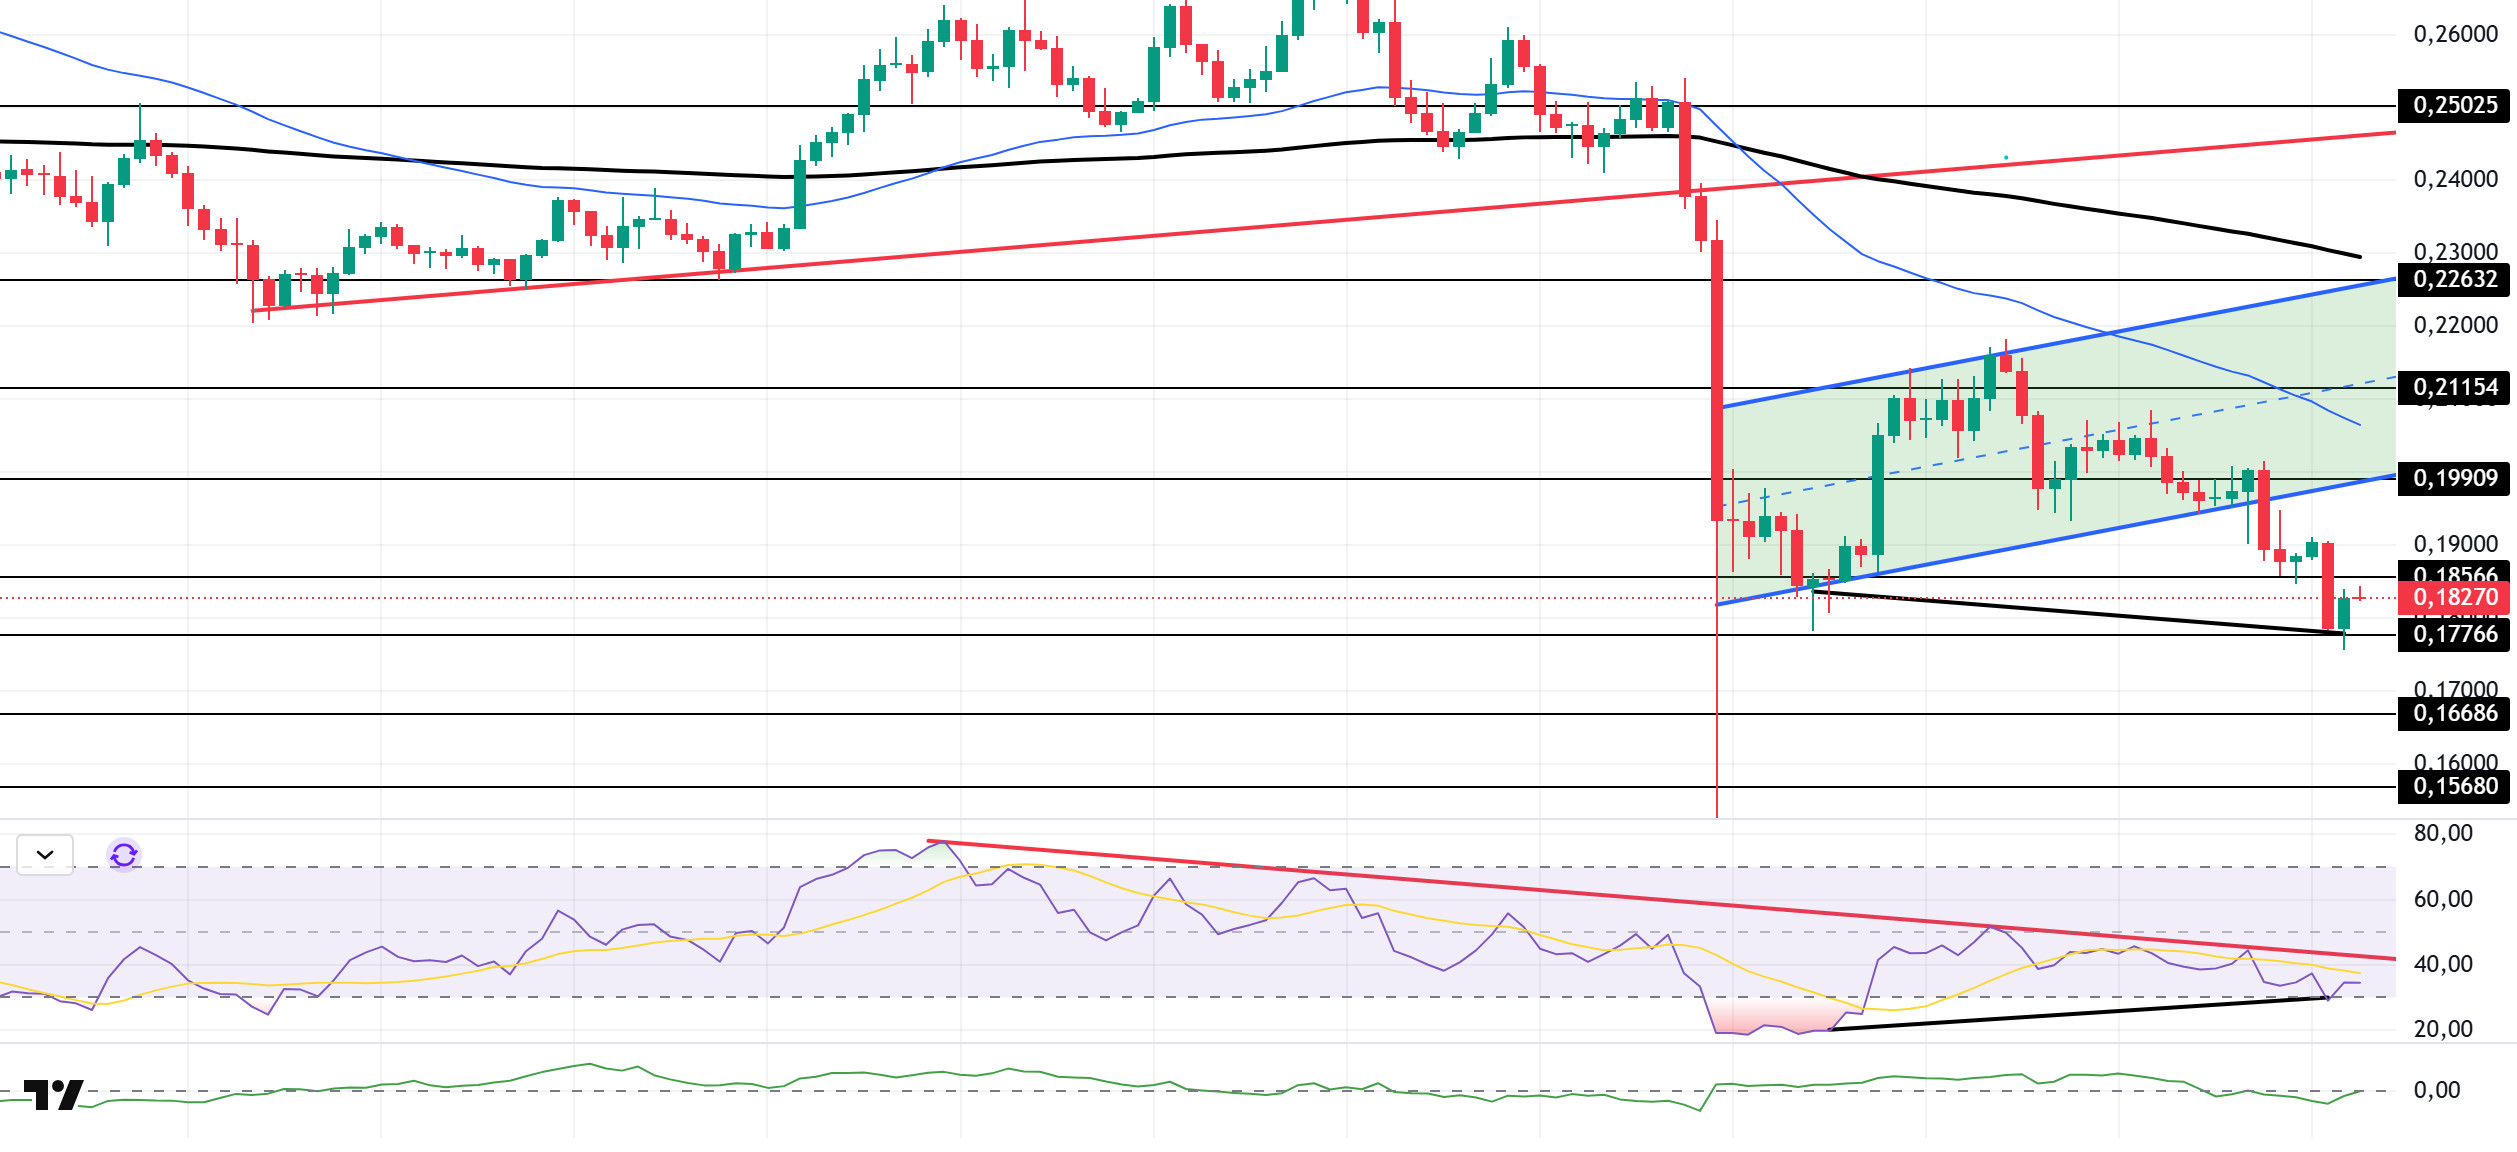
The DOGE price continued to decline during the day. The asset remains in the lower region of the upward trend that began on September 25. Testing the strong support level at the base of the upward trend, the price broke below it with a strong bearish candle, deepening its decline. Currently, the asset is finding support at the strong support level of $0.17766 and has started to move sideways with a slight uptick. If candlesticks continue to close below the rising trend, the pullback could deepen. If an uptrend begins, the 50 EMA (Blue Line) moving average should be monitored.
On the 4-hour chart, the 50 EMA (Exponential Moving Average – Blue Line) remained below the 200 EMA (Black Line). This indicates that a downtrend may begin in the medium term. The price being below both moving averages indicates a downward trend in the short term. The Chaikin Money Flow (CMF-20) rose to a neutral level. Additionally, a decrease in money inflows could push the CMF into negative territory. The Relative Strength Index (RSI-14) continues to remain below the downward trend that began on October 2. The metric, which remains in the middle of the negative zone, indicates that selling pressure continues. At the same time, a positive divergence could bring an uptrend. In the event of an uptrend driven by political developments, macroeconomic data, or positive news flow in the DOGE ecosystem, the $0.19909 level stands out as a strong resistance zone. Conversely, in the event of negative news flow, the $0.16686 level could be triggered. A decline to these levels could increase momentum and initiate a new wave of growth.
Supports: $0.17766 – $0.16686 – $0.15680
Resistances: 0.18566 – 0.19909 – 0.21154
LTC/USDT
LTC ended the day down 3.81% against USDT and lost 1.41% against Bitcoin. On the futures side, the long/short position ratio of 0.8811 opened in the last 24 hours indicates that derivatives market participants continue to expect a decline. Funding rates continue to remain neutral-negative. This picture shows that the decline in the derivatives markets in the first half of the day continued throughout the rest of the day.
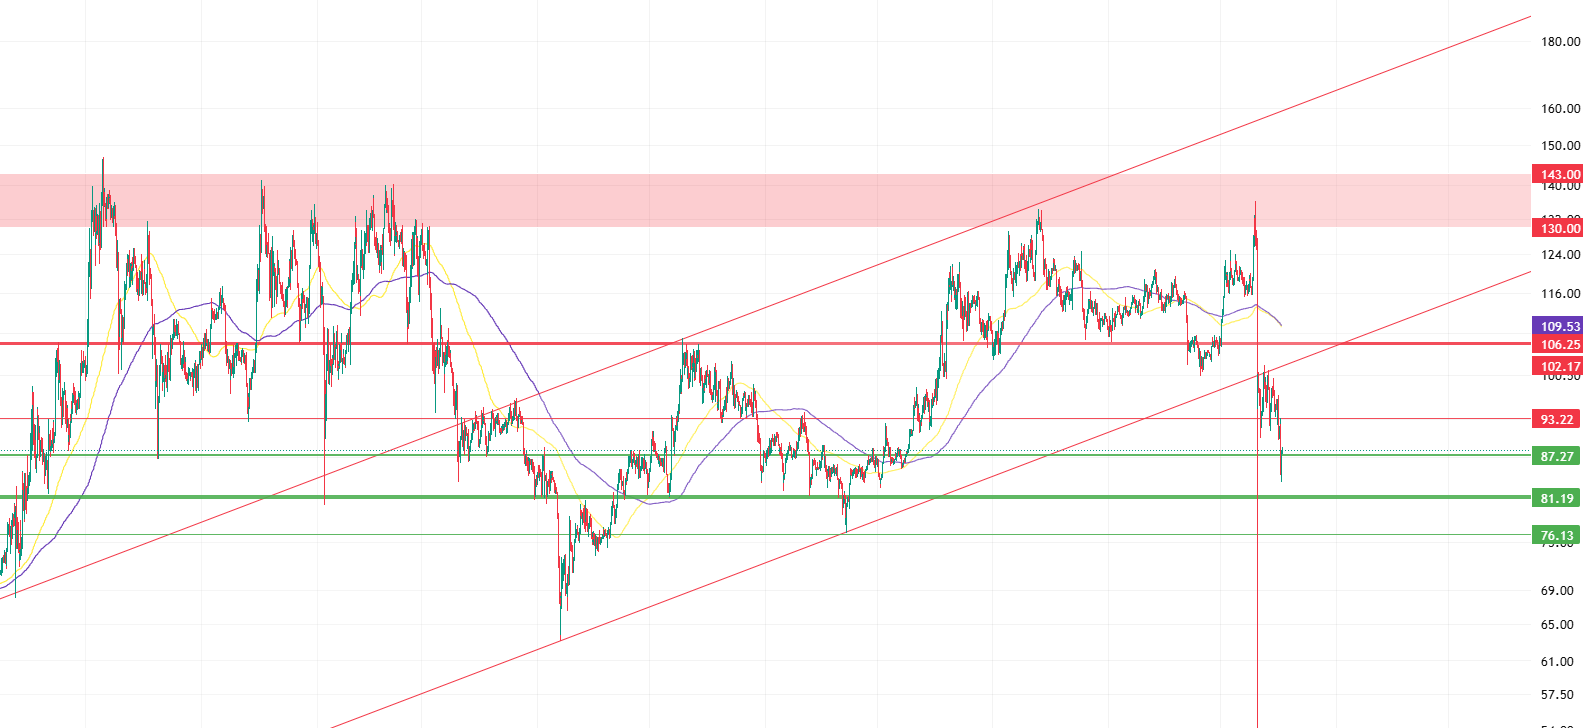
Technically, examining Litecoin’s 4-hour USDT chart, pricing continuing below all moving averages and the rising trend continues to support expectations of a decline with the weighted increase in short positions in the derivatives market, although upward movements are always possible. If this possibility materializes, the first point where the rise could be suppressed is the 93.22 level, which is currently the old support and new horizontal resistance. Next, we encounter the rising trend‘s lower band at 102.17. This level also increases the potential for a crossover with the 50-period moving average. Finally, the 106.25 level continues to be an important level that will create horizontal selling pressure.
In line with expectations, the 87.27 level stands out as a critical zone where the price could find initial support and where risk-averse traders could close their short positions. If the price remains below this level, the 81.19 level emerges as a strong and critical support point. However, losing the 81.19 level could signal the end of the medium-term bullish trend. In this case, investors, perceiving a strengthening bearish trend in the market, may be inclined to take more sell-side positions, with short-term traders potentially targeting the horizontal support at the 76.13 level.
Supports: 87.27 – 81.19 – 76.13
Resistances: 93.22 – 102.17 – 106.25
Legal Notice
The investment information, comments, and recommendations contained herein do not constitute investment advice. Investment advisory services are provided individually by authorized institutions taking into account the risk and return preferences of individuals. The comments and recommendations contained herein are of a general nature. These recommendations may not be suitable for your financial situation and risk and return preferences. Therefore, making an investment decision based solely on the information contained herein may not produce results in line with your expectations.

