
Technical Analysis
BTC/USDT
U.S. President Donald Trump announced that he will soon reveal the new head of the Bureau of Labor Statistics (BLS). It has been reported that the search for a candidate for the Fed chairmanship is ongoing. The U.S. Trade Representative has announced that new tariffs to be applied to countries such as Canada, Brazil, India, and Switzerland have been determined and are not open to negotiation. Metaplanet purchased an additional 463 BTC, increasing its total Bitcoin holdings to 17,595. Europe-based Capital B is preparing for new issuances to raise 11.5 million euros, The Smarter Web Company is aiming for 8.1 million pounds, and H100 Group is targeting approximately 2.2 million dollars. Strategy Board Chairman Michael Saylor stated that Bitcoin should be viewed as a long-term treasury asset.
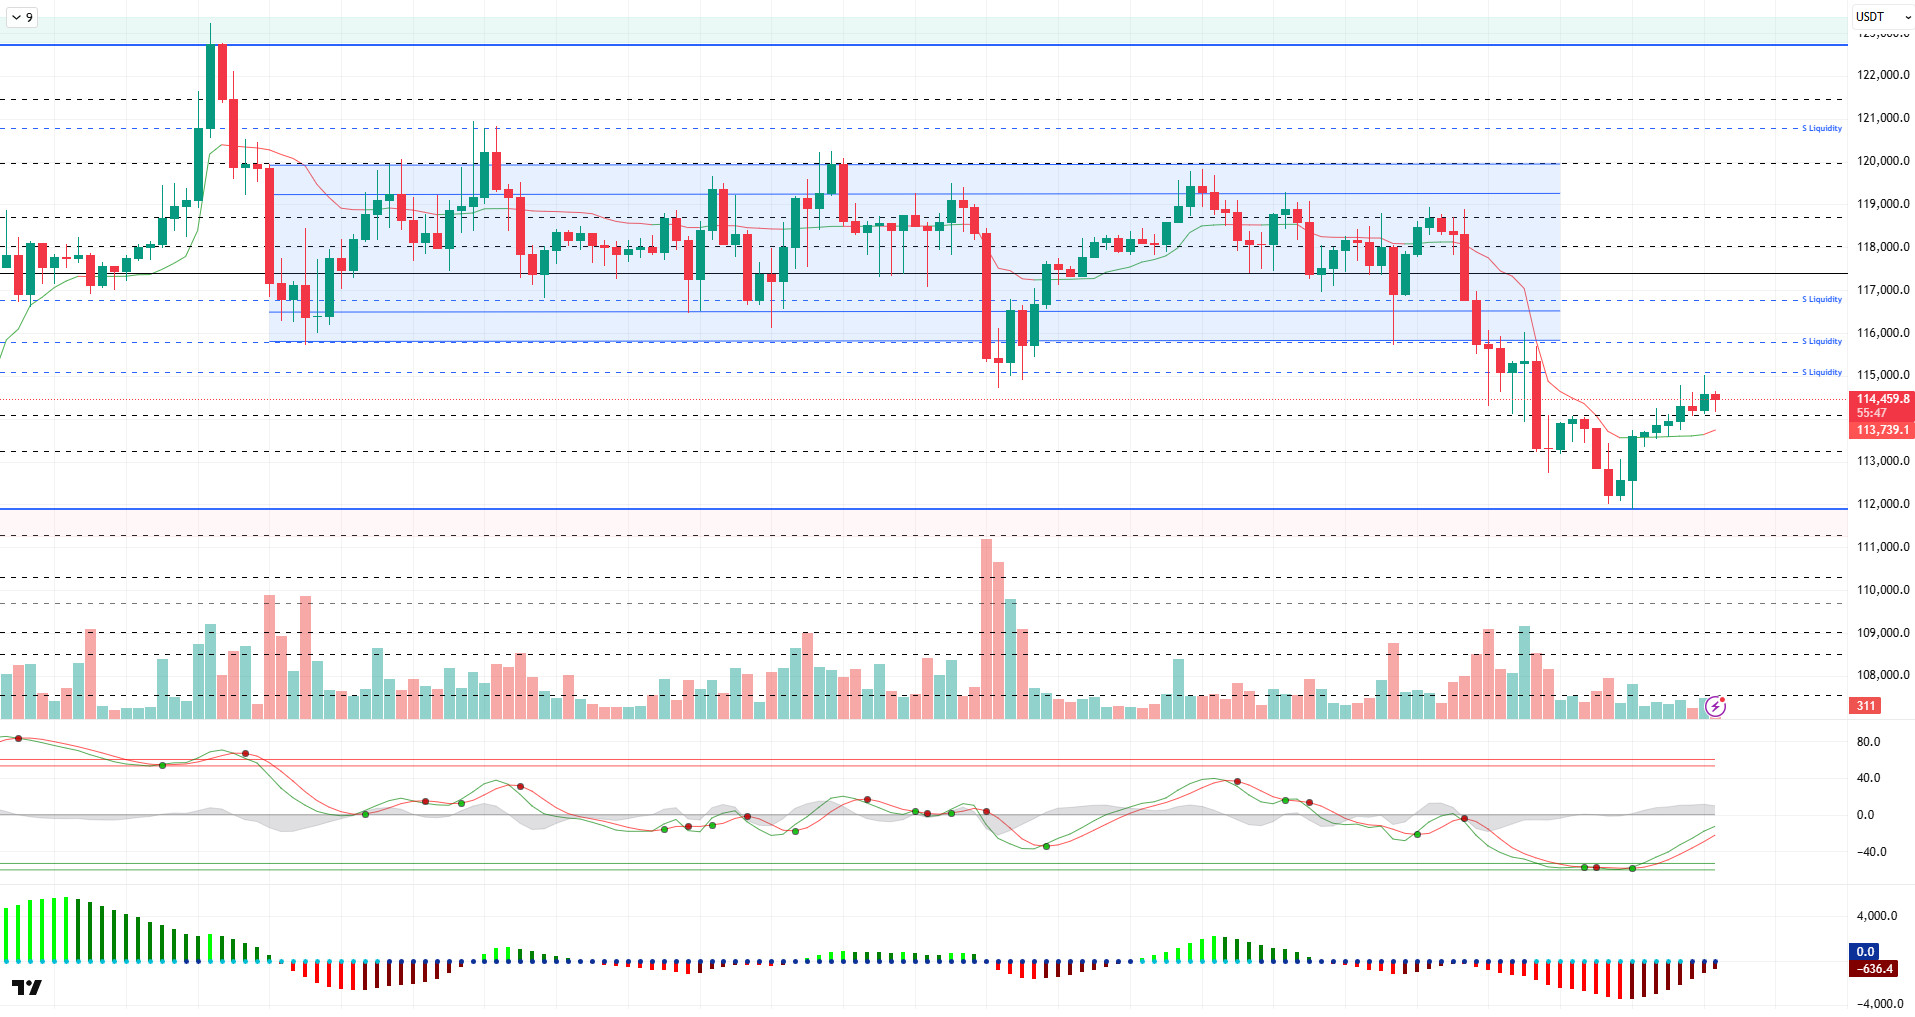
Looking at the technical picture, BTC broke down from the horizontal band consolidation phase and fell to 111,900. The price bottomed out at this level and tested the 115,000 level again with the reaction it received from here. At the time of writing, it continues to trade at 114,300 with slight selling pressure.
On the technical indicators front, the Wave Trend (WT) oscillator has retreated to the oversold zone amid selling pressure but has reversed its trend direction upward. The Squeeze Momentum (SM) indicator has begun to gain momentum in the negative zone. The Kaufman moving average has retreated to the 113,700 level.
Looking at liquidity data, almost all buy transactions were liquidated, while sell transactions continued to increase. Short-term sell accumulation remained in the 115,100–116,800 band, while long-term accumulation continued to hold above the 120,000 level.
In summary, while fundamental developments emerged as factors creating selling pressure in terms of pricing, the manipulation of announced data and increasing expectations of interest rate cuts led to a loss of confidence in the market. Technical outlook and liquidity data, however, kept the price’s upward momentum alive, and in this context, the 115,000 reference point will be monitored. If the price breaks above this level, it is expected to return to the consolidation range and continue pricing near the ATH level. On the other hand, closes below this level indicate that pricing will continue in the “gap” zone, and the 112,000 level becomes critical in the event of new selling pressure.
Support levels: 114,000 – 113,200 – 112,000
Resistance levels: 115,000 – 116,000 – 116,800
ETH/USDT
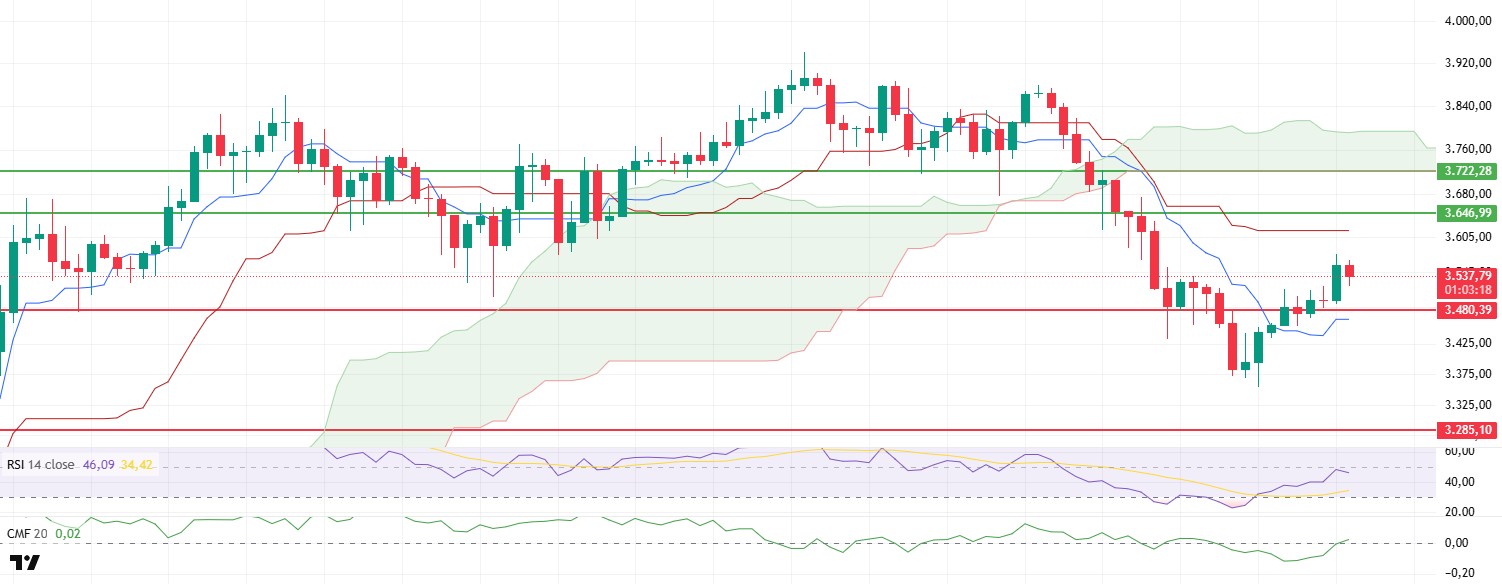
ETH fell below the important support level of $3,646 last Friday and remained under selling pressure throughout the weekend, with the price dropping to $3,350. With buyers entering the market in this region, the price began a recovery process, first breaking above the Ichimoku cloud’s tenkan level and then surpassing the short-term resistance level of $3,480, reclaiming the $3,500 level. While this rise provided a short-term breather in the market, technical and on-chain data suggest caution is warranted regarding the sustainability of this movement.
When on-chain metrics are examined, the decline in open interest data to $22 billion indicates a significant reduction in leveraged positions. While this has somewhat alleviated the market’s excessive inflation, the simultaneous shift of the funding rate back into positive territory suggests that short positions are beginning to close, indicating that market participants are shifting toward a more neutral or bullish outlook in the short term.
The Chaikin Money Flow (CMF) indicator has also moved into positive territory alongside the price recovery process, confirming that liquidity is returning to the market. This indicates that investors are viewing the low levels formed after the sell-off as an opportunity and that the short-term upward trend is gaining strength.
However, when examining the Relative Strength Index (RSI) indicator, despite rising to the 50 level with support from the oversold zone, the price’s inability to respond sufficiently strongly to this rise signals a negative divergence. This confirms that momentum in price movement remains weak and that the market may remain indecisive regarding its direction.
In summary, if the ETH price manages to stay above the $3,480 level in the short term, it could pave the way for an upward trend to strengthen. However, a break below this level, coupled with weak momentum, could lead to an increase in selling pressure. Therefore, despite the short-term upside potential, the current technical structure suggests a cautious approach is warranted.
Top of Form
Below the Form
Support levels: 3,480 – 3,285 – 3,081
Resistance levels: 3,646 – 3,722 – 4,084
XRP/USDT
XRP faced heavy selling pressure after losing its short-term key support zone at $2.99 on Friday and continued its decline to $2.72. This zone has historically been an area where buyers tend to gather, and with the reactionary buying that came on Sunday, the price began to recover and rose back to $2.99 after the weekly close. As of now, XRP is striving to break above this critical threshold, with technical indicators showing a bullish outlook.
The Chaikin Money Flow (CMF) indicator remains in positive territory, with upward momentum indicating accelerated liquidity inflows and strong demand in the market. This suggests that prices are being supported by buyers at current levels and that capital flows continue to favor long positions.
The Relative Strength Index (RSI) indicator also reversed upward with support from the oversold zone and rose above the 50 level, signaling a strengthening in price movement. Since this level is considered the transition line between the neutral zone and the upward trend in technical terms, the RSI settling above this level is a positive signal in terms of momentum.
In the case of the Ichimoku indicator, when the price rises above both the Tenkan and Kijun levels, it indicates that the short-term trend structure has turned positive again. Since these levels also act as dynamic support-resistance zones, XRP’s ability to hold above these levels is important for the technical outlook to gain strength. Additionally, approaching the cloud structure suggests that momentum could increase further if a significant breakout occurs.
In general, XRP regaining the $2.99 level could be seen as a sign that buyers have taken control, and if it stays above this level , an upward movement is likely to gain momentum. On the other hand, if this level is not broken again or sustained above it, limited profit-taking and short-term pullbacks may come into play. Therefore, the $2.99 level should be closely monitored as a critical threshold for intraday price movements.
Supports: 2.8471 – 2.6513 – 2.4777
Resistances: 2.9967 – 3.2813 – 3.4014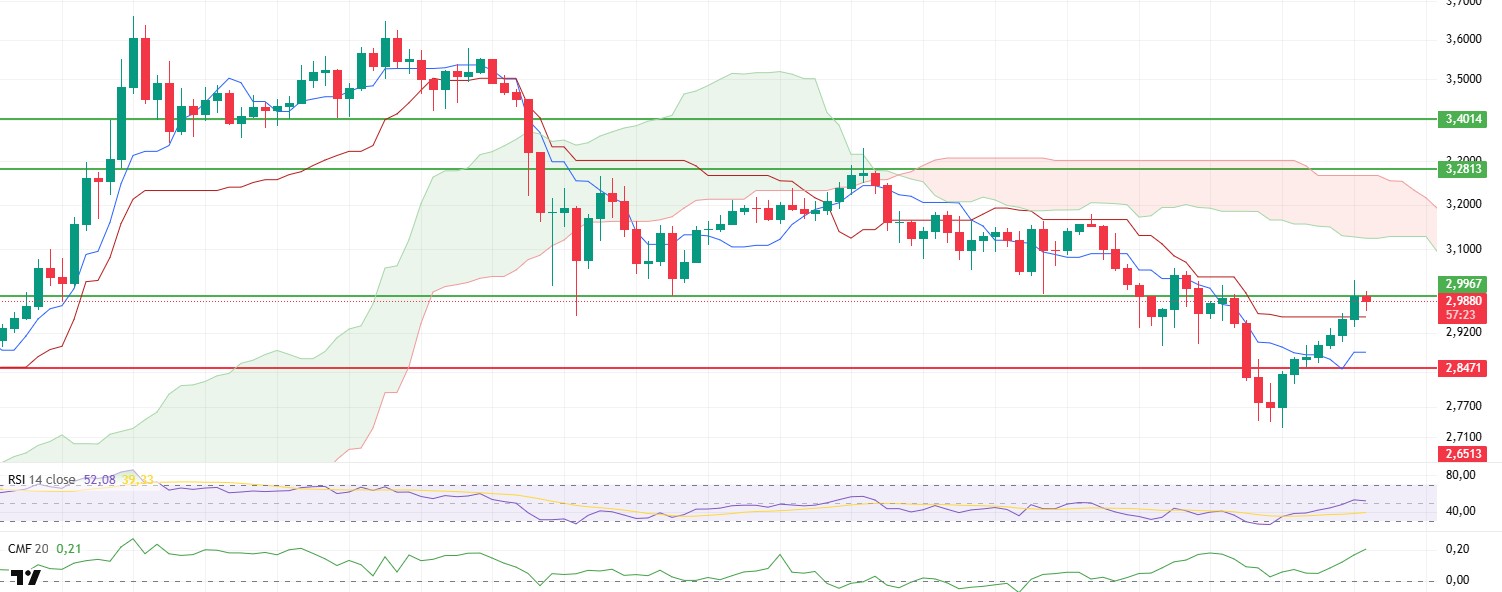
SOL/USDT
Anatoly Yakovenko described the communities as “useless,” sparking a backlash amid Solana’s growing meme coin confidence and active holder base.
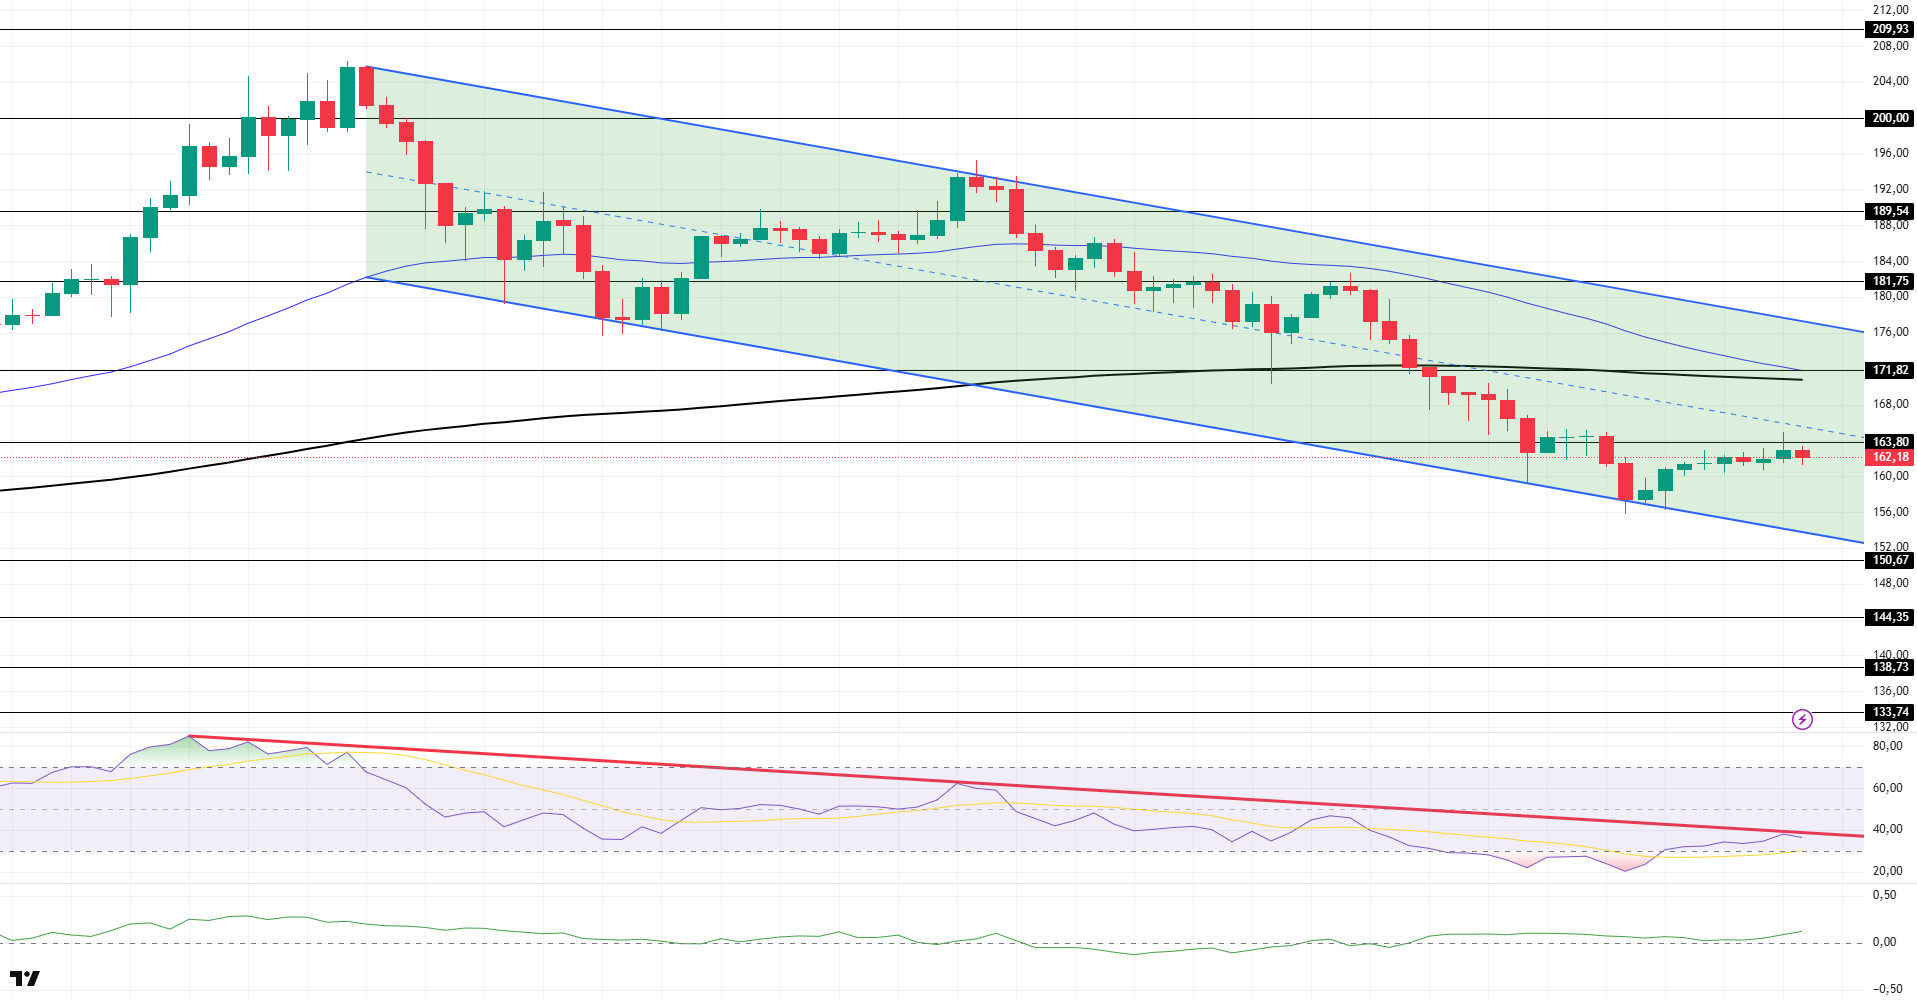
The SOL price experienced a slight increase. The asset continued to remain within the downward trend that began on July 23. The price, which remained below the 200 EMA (Black Line) moving average, continued its pullback, testing the bottom level of the downward trend and then experiencing an increase. As of now, it is testing the strong resistance level of $163.80. If the upward movement continues, the $171.82 level can be monitored. In the event of a downward movement, the bottom level of the downward trend should be monitored.
On the 4-hour chart, the 50 EMA (Blue Line) remains above the 200 EMA (Black Line). This indicates that the upward trend may continue in the medium term. At the same time, the price being below both moving averages shows that the market is currently in a downward trend. The Chaikin Money Flow (CMF-20) has started to move into positive territory. An increase in money inflows could push the CMF into the upper levels of the positive zone. The Relative Strength Index (RSI-14) has continued to remain below the downward trend that began on July 21 and is currently testing this trend as resistance. In the event of an upward movement due to macroeconomic data or positive news related to the Solana ecosystem, the $171.82 level emerges as a strong resistance point. If this level is broken upward, the upward movement is expected to continue. In case of pullbacks due to developments in the opposite direction or profit-taking, the $150.67 level could be tested. A decline to these support levels could increase buying momentum, presenting a potential opportunity for an upward movement.
Support levels: 150.67 – 144.35 – 138.73
Resistance levels: 163.80 – 171.82 – 181.75
DOGE/USDT
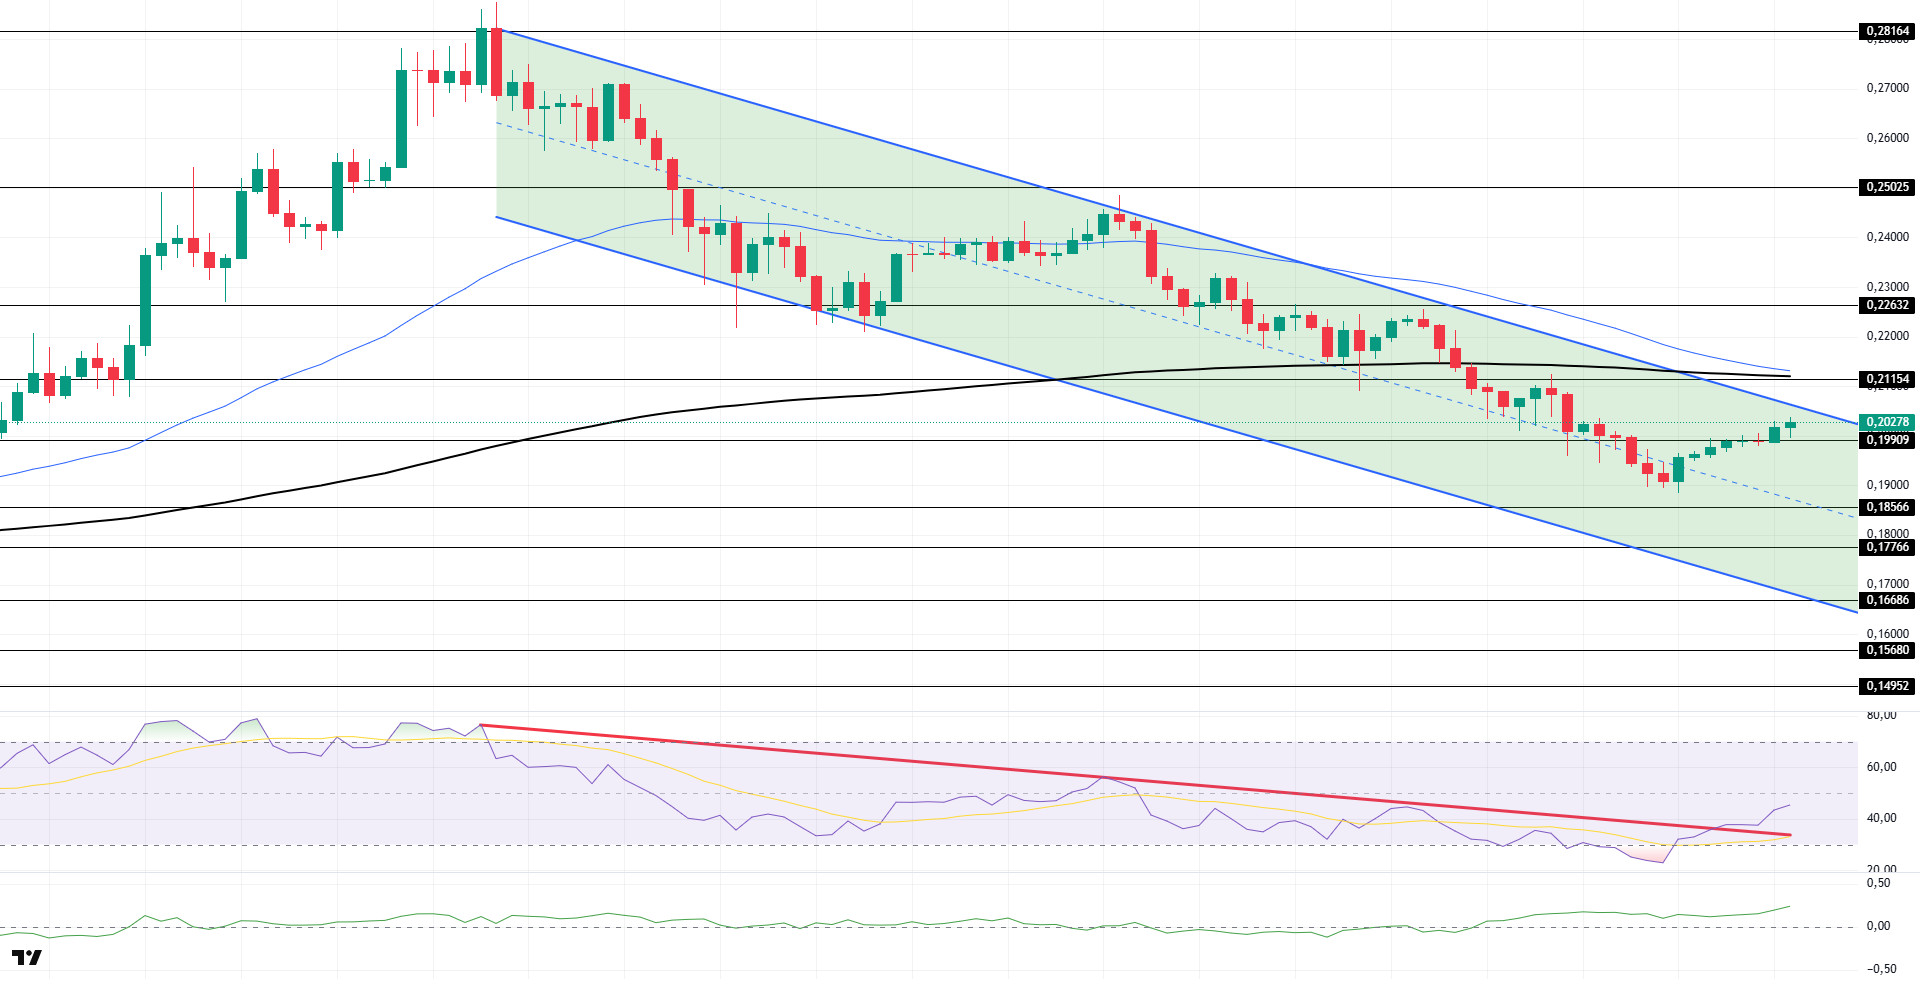
The DOGE price has been moving sideways. The asset gained momentum from the middle of the downtrend that began on July 21 and rose, preparing to test the ceiling level of the uptrend. The price remains below the 200 EMA (Black Line) moving average while staying within the trend. In the event of a continued pullback, the 0.19909 dollar level can be monitored as support. If an uptrend begins, the 0.21154 dollar level should be monitored.
On the 4-hour chart, the 50 EMA (Blue Line) remains above the 200 EMA (Black Line). This indicates that the asset is in an upward trend in the medium term. The price being below both moving averages indicates that the asset is in a downward trend in the short term. The Chaikin Money Flow (CMF-20) has crossed into positive territory. Additionally, positive cash inflows could push the CMF into the upper levels of the positive zone. The Relative Strength Index (RSI-14) remains in the negative zone. Furthermore, the downward trend that began on July 21 has been broken upward. This could trigger an upward movement. In the event of upward movements driven by political developments, macroeconomic data, or positive news flow within the DOGE ecosystem, the $0.22632 level emerges as a strong resistance zone. In the opposite scenario or in the event of negative news flow, the 0.18566 dollar level could be triggered. A decline to these levels could increase momentum and potentially initiate a new upward wave.
Support levels: 0.19909 – 0.18566 – 0.17766
Resistance levels: 0.21154 – 0.22632 – 0.25025
Legal Notice
The investment information, comments, and recommendations contained herein do not constitute investment advice. Investment advisory services are provided individually by authorized institutions taking into account the risk and return preferences of individuals. The comments and recommendations contained herein are of a general nature. These recommendations may not be suitable for your financial situation and risk and return preferences. Therefore, making an investment decision based solely on the information contained herein may not produce results in line with your expectations.

