Technical Analysis
BTC/USDT
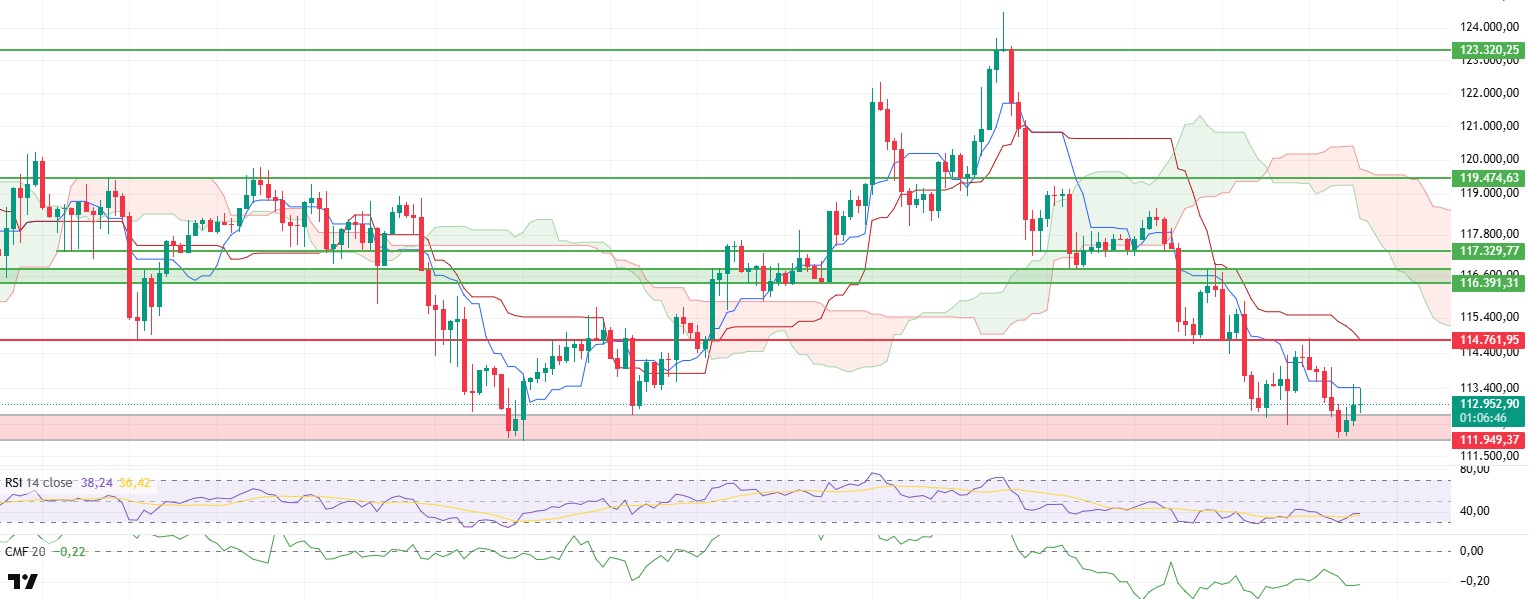
The BTC price continued its downward trend after losing the tenkan level in the evening hours yesterday, retreating to the area previously identified as support and marked by the red rectangle on the chart. Although the price tested the tenkan level again with buying activity from this area, the continued weakness in technical indicators suggests that the recovery movement remains limited.
On-chain data further supports this weakness. The Cumulative Volume Delta (CVD) indicator shows that spot market purchases have been significantly stronger than futures purchases over the past two days. While this points to the potential for a short-term reversal, it is not sufficient to signal a lasting trend reversal. In particular, the Chaikin Money Flow (CMF) indicator’s continued horizontal movement in the negative zone highlights that liquidity entering the market remains limited and that purchases have failed to generate a strong momentum.
The momentum picture is also weak. The Relative Strength Index (RSI) indicator showed a slight recovery after the recent decline, finding support in the oversold zone and rising to 38. However, this movement does not carry enough strength to reverse the trend structurally. The RSI still maintains its negative outlook.
In the Ichimoku indicator, the fact that the price is trading below both the Tenkan and Kijun levels, and even below the Kumo cloud, indicates that both the short-term and medium-term technical structures remain weak. This outlook suggests that the downward trend in the market has not yet come to an end and that stronger volume and momentum support are needed for any upward attempts to become sustainable.
In the current outlook, it is likely that the BTC price will retest the critical support zone at the $111,950 level during the day. A downward break of this level could lead to increased selling pressure and more severe declines. On the other hand, if the price manages to rise above the Tenkan level and sustain itself above the 114,761 dollar level, the current negative structure could break down, paving the way for a potential upward trend.
Support levels: 111,950 – 110,936 – 107,886
Resistance levels: 114,761 – 117,329 – 119,474
ETH/USDT
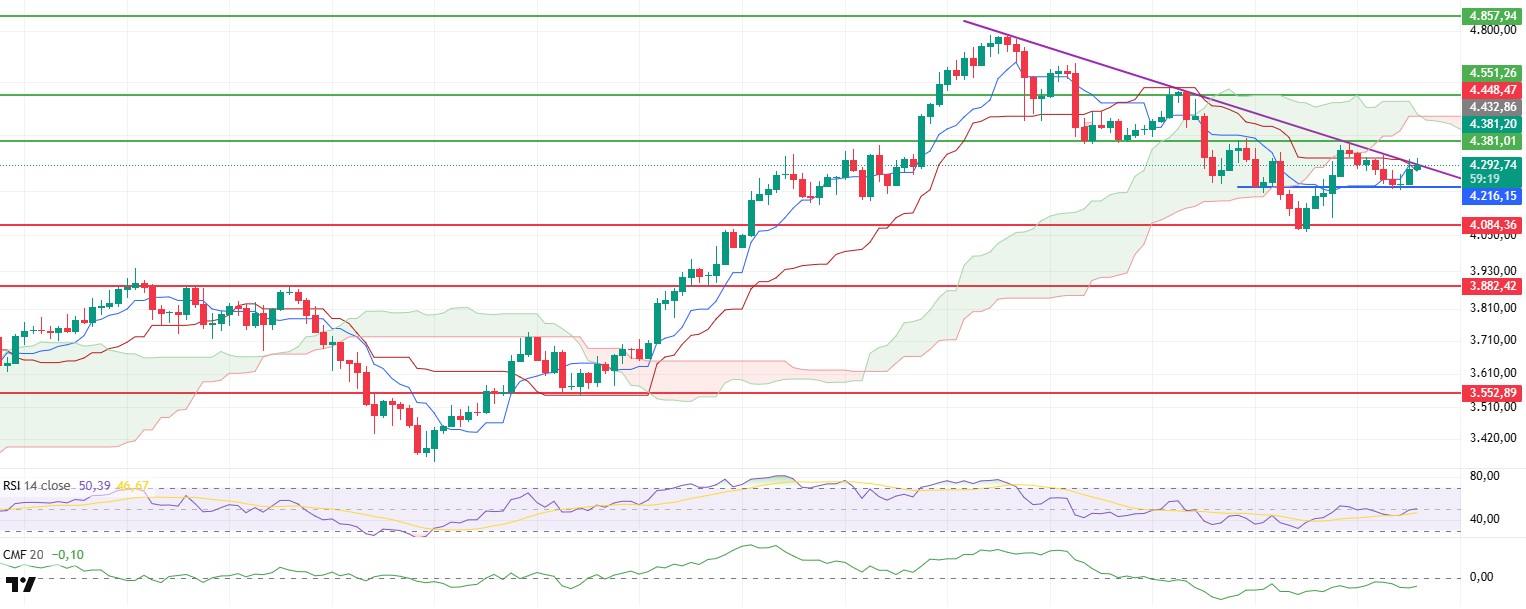
The ETH price rose in the morning hours to $4,296 due to buying from the support level of $4,216. This movement triggered a series of important signals on the short-term technical structure. However, when the overall picture is examined, it is seen that stronger support in terms of both volume and liquidity is needed for the rise to become permanent.
The price approaching the downward trend line indicated by the purple line in the chart is showing serious effort to break through this area. If this level is broken, the price may increase its upward momentum and test higher resistance levels. However, if this breakout is not supported by volume, the price may come under downward pressure again and retreat to the current support levels. The trend line, in particular, stands out as the most critical area for determining short-term direction.
The Ichimoku indicator also shows positive signals in the short term. The price rising above the tenkan level and the tenkan level crossing above the kijun level indicate that short-term buyers are gaining strength. This structure increases the likelihood of the price rising to the kumo cloud boundary. However, since the price is still trading below the kumo cloud, it is important to emphasize that the overall trend remains weak and negative. Therefore, for the sustainability of the upward movement, it is critical for the price to break above the kumo cloud.
The Chaikin Money Flow (CMF) indicator is maintaining its horizontal movement in the negative zone. This situation reveals that there is no strong liquidity inflow into the market and that the uptrend is not firmly established. As long as there is no significant increase in liquidity, upward movements may remain limited, and the risk of the price returning to support levels remains high.
When evaluating this technical and on-chain chart, there is a high probability that the price will test the $4,381 level during the day. However, if the price reacts to the trend line indicated by the purple line and falls below the tenkan level again, selling pressure may increase with the loss of the $4,216 support level, and the price may decline to the $4,084 level. In particular, price movements around the trend line, tenkan level, and kumo cloud should be closely monitored as the most critical signals determining the short-term direction.
Top of Form
Below the Form
Support levels: 4,216 – 4,084 – 3,882
Resistance levels: 4,381 – 4,551 – 4,857
XRP/USDT
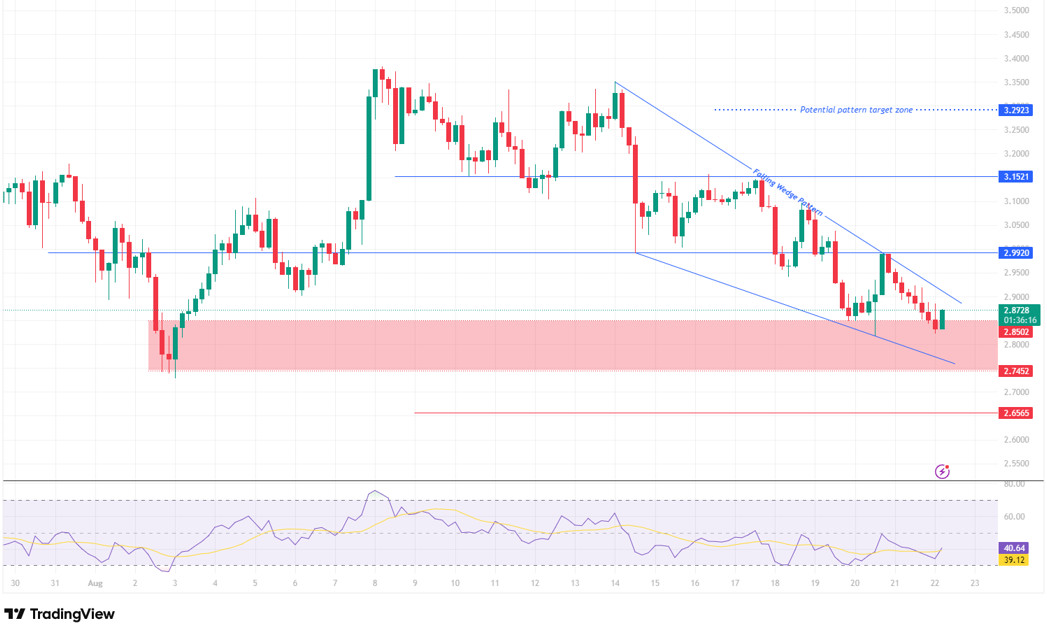
XRP failed to break above the 2.99–3.00 range as we mentioned in yesterday’s analysis and continued its downward movement under selling pressure. Currently, the price is showing a weak appearance around the 2.89 level. Although the upper band of the formation was tested, no breakout occurred, so sellers remain in control in the short term. Therefore, we can say that the 2.99–3.00 band remains a critical threshold for direction confirmation.
In the downside scenario, the red zone (2.85–2.74) retains its importance. Although the price is currently moving towards this zone, we cannot see any developments that would support this rise in momentum, and we are seeing increased pressure from sellers. This range is a strong defense line as it coincides with both horizontal support and the lower trend line of the wedge. However, staying below this level could bring a pullback towards the 2.6565 support.
In an upward scenario, the price must break above the 2.99–3.00 band for a renewed rally. Unless there are closes above this region, the upward momentum may remain weak. If this breakout occurs, the 3.1521 level could come into focus first, followed by the formation target zone at 3.29. On the Relative Strength Index (RSI) side, momentum is still weak compared to yesterday’s analysis, and it needs to move above the 45–50 band for a recovery signal. In short, the critical threshold for XRP remains unchanged. The 2.85–2.74 range below and the 2.99–3.00 band above continue to be the main levels that will determine the price direction.
Support levels: 2.8502 – 2.7452 – 2.6565
Resistance levels: 2.9920 – 3.1521 – 3.2923
SOL/USDT
Cryptocurrency investment firm SOL Strategies has publicly disclosed that it currently holds slightly over 400,000 Solana tokens in its treasury.
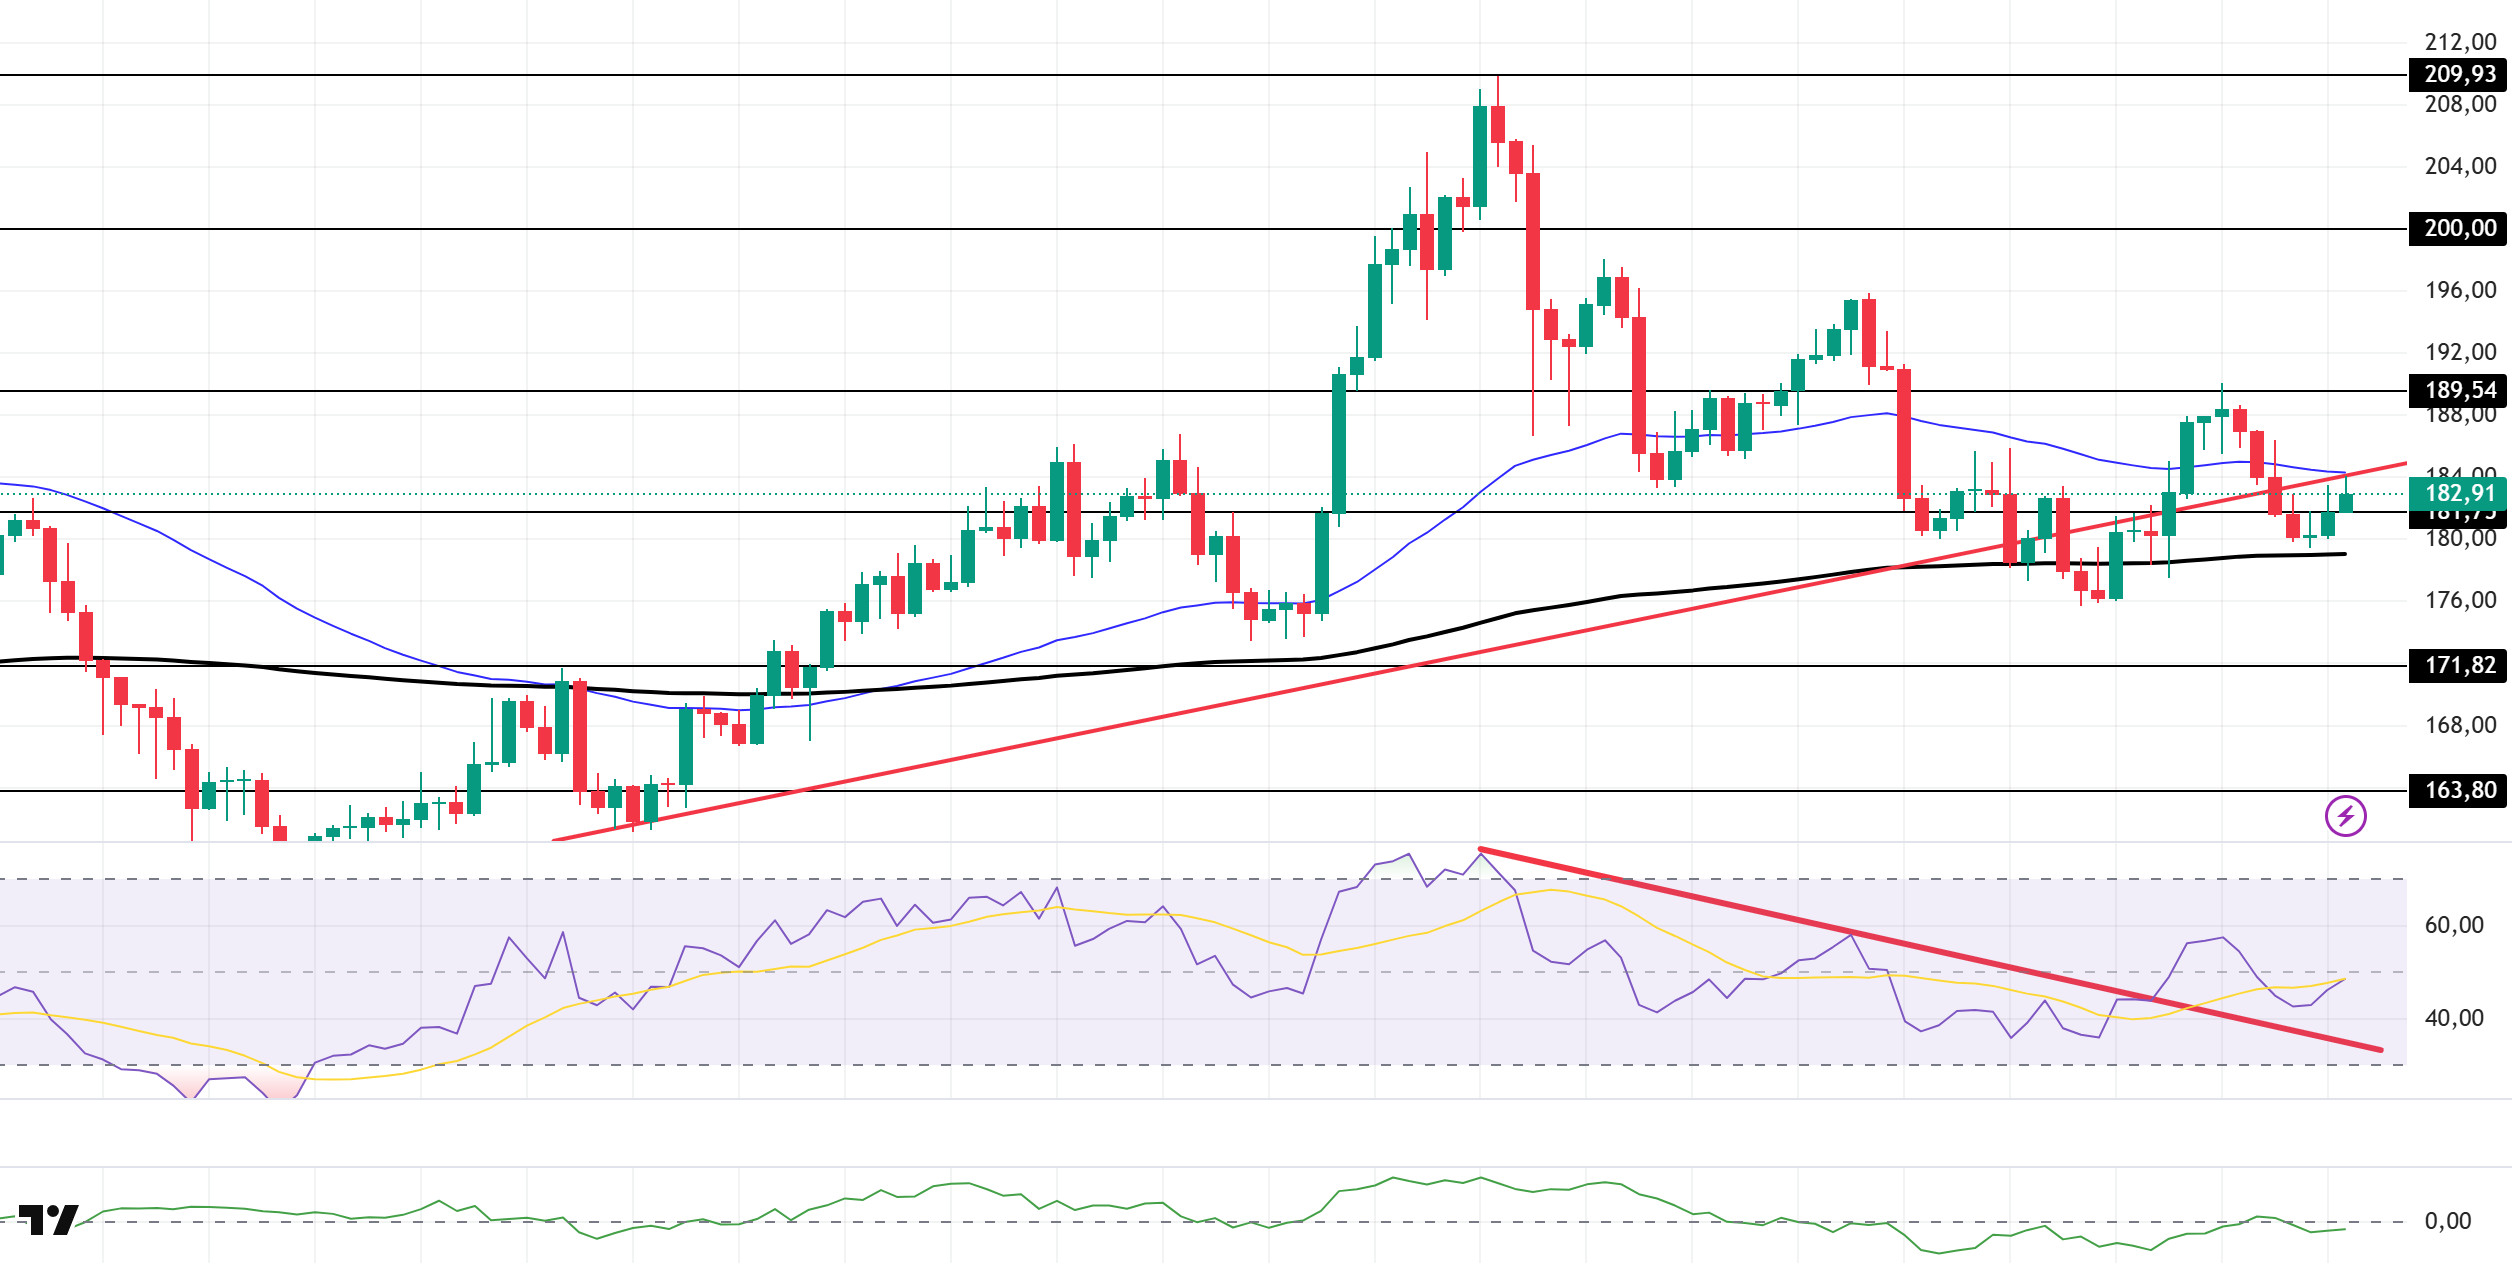
The SOL price continued its sideways movement. The asset tested the 200 EMA (Exponential Moving Average – Black Line) moving average as support and experienced upward momentum. As of now, it is testing the rising trend line that began on August 2 and the 50 EMA (Blue Line) moving average as resistance. If it closes above this level, it could continue its upward movement. In the event of a pullback, the $171.82 level should be monitored.
On the 4-hour chart, the 50 EMA (blue line) remained above the 200 EMA (black line). This indicates that the upward trend may continue in the medium term. At the same time, the price being between the two moving averages shows that the market is in a decision phase in the short term. The Chaikin Money Flow (CMF-20) has dropped below the negative level. However, an increase in money inflows could push the CMF back into the positive zone. The Relative Strength Index (RSI-14) remained above the downward trend that began on August 14 and its rise into the positive zone indicates an increase in buying pressure. In the event of an upward movement driven by macroeconomic data or positive news related to the Solana ecosystem, the $189.54 level emerges as a strong resistance point. If this level is broken upward, the upward movement is expected to continue. In case of pullbacks due to developments in the opposite direction or profit-taking, the $171.82 level could be tested. A decline to these support levels could increase buying momentum, presenting a potential opportunity for an upward movement.
Support levels: 181.75 – 171.82 – 163.80
Resistance levels: 189.54 – 200.00 – 209.93
DOGE/USDT
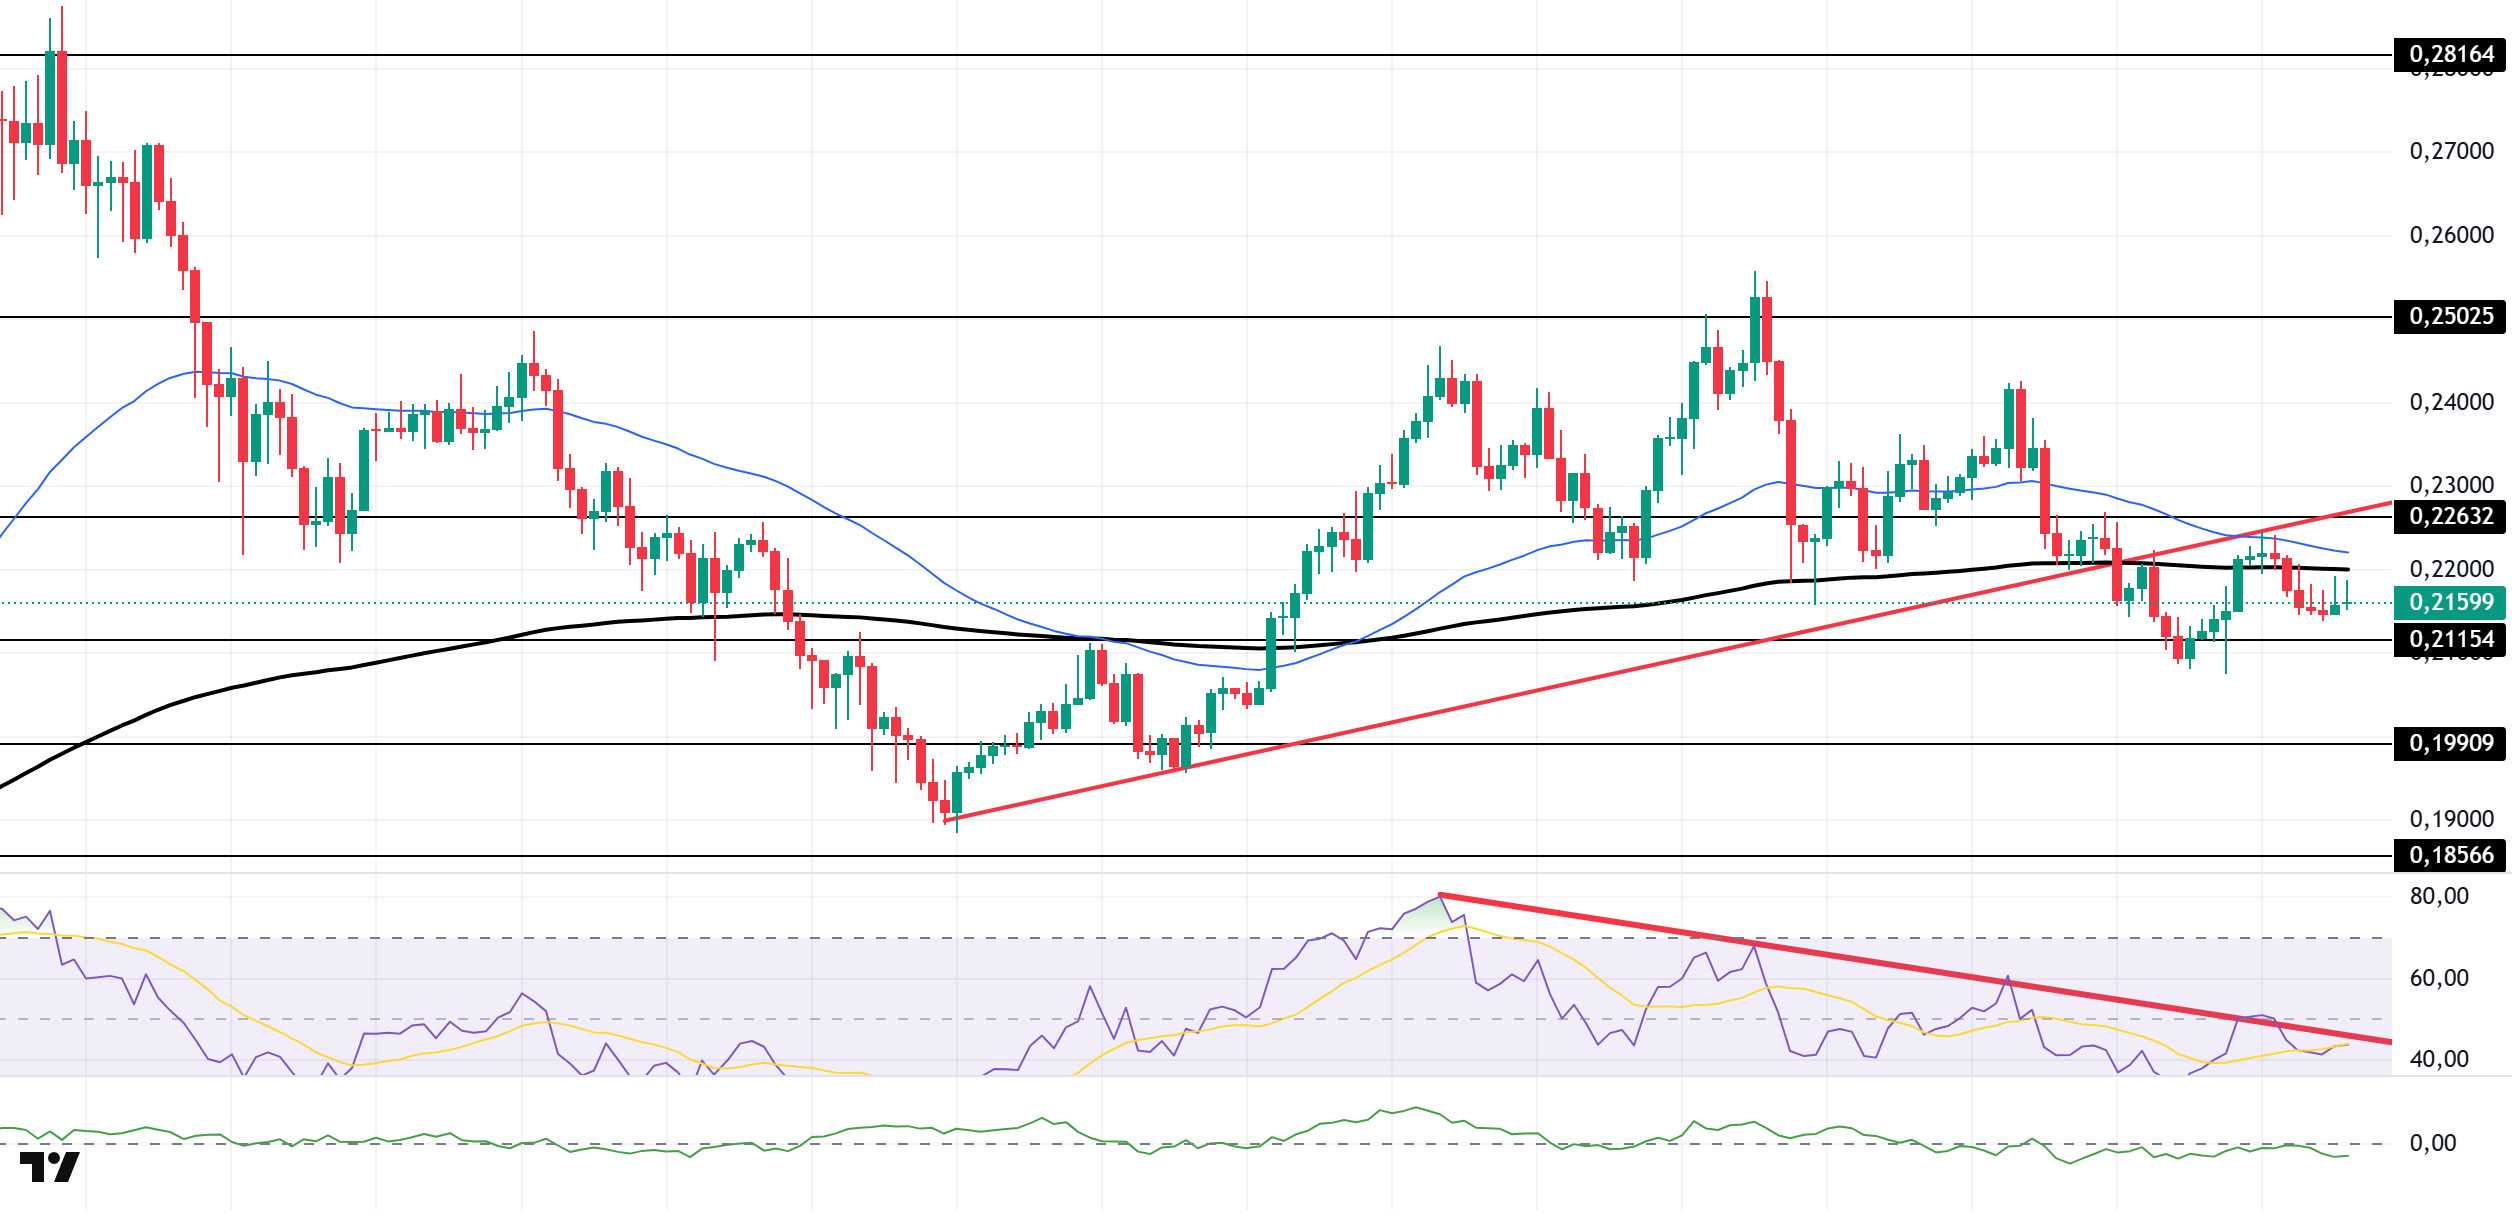
The DOGE price has been moving sideways. The asset continues to trade below the upward trend that began on August 2. This could keep selling pressure going. The price, which is facing resistance from the 50 EMA (Exponential Moving Average – Blue Line), is currently testing the 200 EMA (Black Line) moving average as resistance. If the price closes above the 200 EMA, the 0.22632 dollar level should be monitored. In the event of a pullback, the 0.21154 dollar level should be watched.
On the 4-hour chart, the 50 EMA continues to remain above the 200 EMA. This indicates that the asset is in an upward trend in the medium term. The price being below both moving averages indicates that the asset is also in a downward trend in the short term. The Chaikin Money Flow (CMF-20) has fallen back into negative territory. Additionally, an increase in money inflows could push the CMF back into the positive zone. The Relative Strength Index (RSI-14) has also moved back into the negative zone. At the same time, it is currently testing the resistance level of the downtrend that began on August 9. If momentum is lost, selling pressure may increase. In the event of an upturn driven by political developments, macroeconomic data, or positive news flow within the DOGE ecosystem, the $0.22632 level emerges as a strong resistance zone. In the opposite scenario or in the event of negative news flow, the 0.21154 dollar level could be triggered. A decline to these levels could lead to increased momentum, potentially initiating a new upward wave.
Support levels: 0.21154 – 0.19909 – 0.18566
Resistance levels: 0.22632 – 0.25025 – 0.28164
LINK/USDT
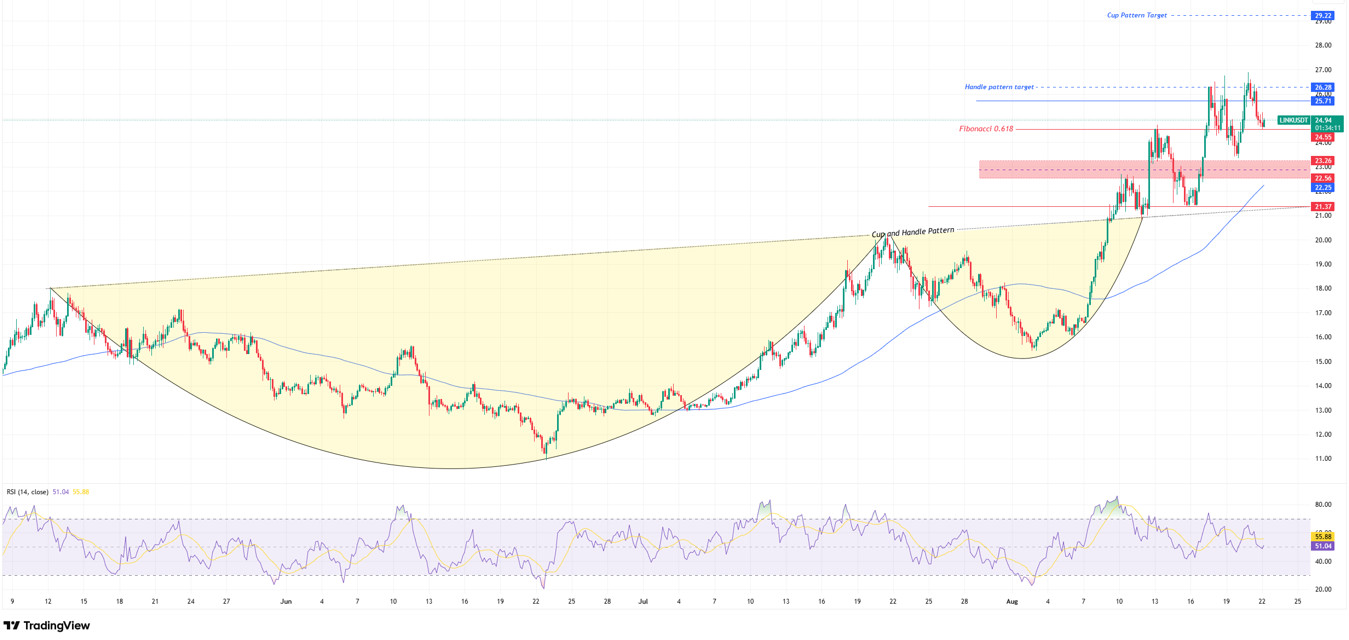
LINK moved in line with our previous analysis expectations, facing a strong downward sell-off at the end of the consolidation between 26 and 25 dollars, and encountered demand at the Fibonacci 0.618 level. If the price manages to hold above this level, it will bring the 26.28 dollar level back into focus as a target, despite facing resistance at the 25.75 level. If the price closes above this level, we could see momentum accelerate and reach the 29.22 dollar range.
In the opposite scenario, the 0.618 (24.55 dollar) level is currently the most critical area that must not be lost. A move below this level could trigger fear in the market, leading to an increase in selling pressure and a deeper decline. In such a case, the next demand zone would be the 23.26 to 22.56 region. Considering the current support level, reaching the next support level would mean a decline of approximately 9%. Therefore, the 24.55 level could be quite decisive when making short-term risk plans. In the medium to long term, as long as the 21.37 dollar level is maintained, our trend will support upward price movements.
On the indicator side, the Relative Strength Index (RSI) shows that buyers and sellers are almost in balance. For the upward momentum to gain strength, it is important for the RSI to rise above 60 and hold there. Additionally, the current price remaining above the 50-day moving average can be seen as an extra sign supporting the medium-term upward outlook.
Support levels: 24.55 – 23.26 – 21.37
Resistance levels: 25.75 – 26.28 – 29.22
ADA/USDT
The ADA price limited its downward trend in the channel with a horizontal movement for a while following the release of macroeconomic data yesterday. Both the statements of FED members and the release of PMI data were precursors to the uncertainty in the market. The Jackson Hole Economic Symposium began yesterday and will continue until August 23. This meeting could put an end to the uncertainty in the markets. Today, FED Chairman Jerome Powell will deliver a speech. In this speech, the market is expected to experience increased volatility as he signals a potential rate cut in September.
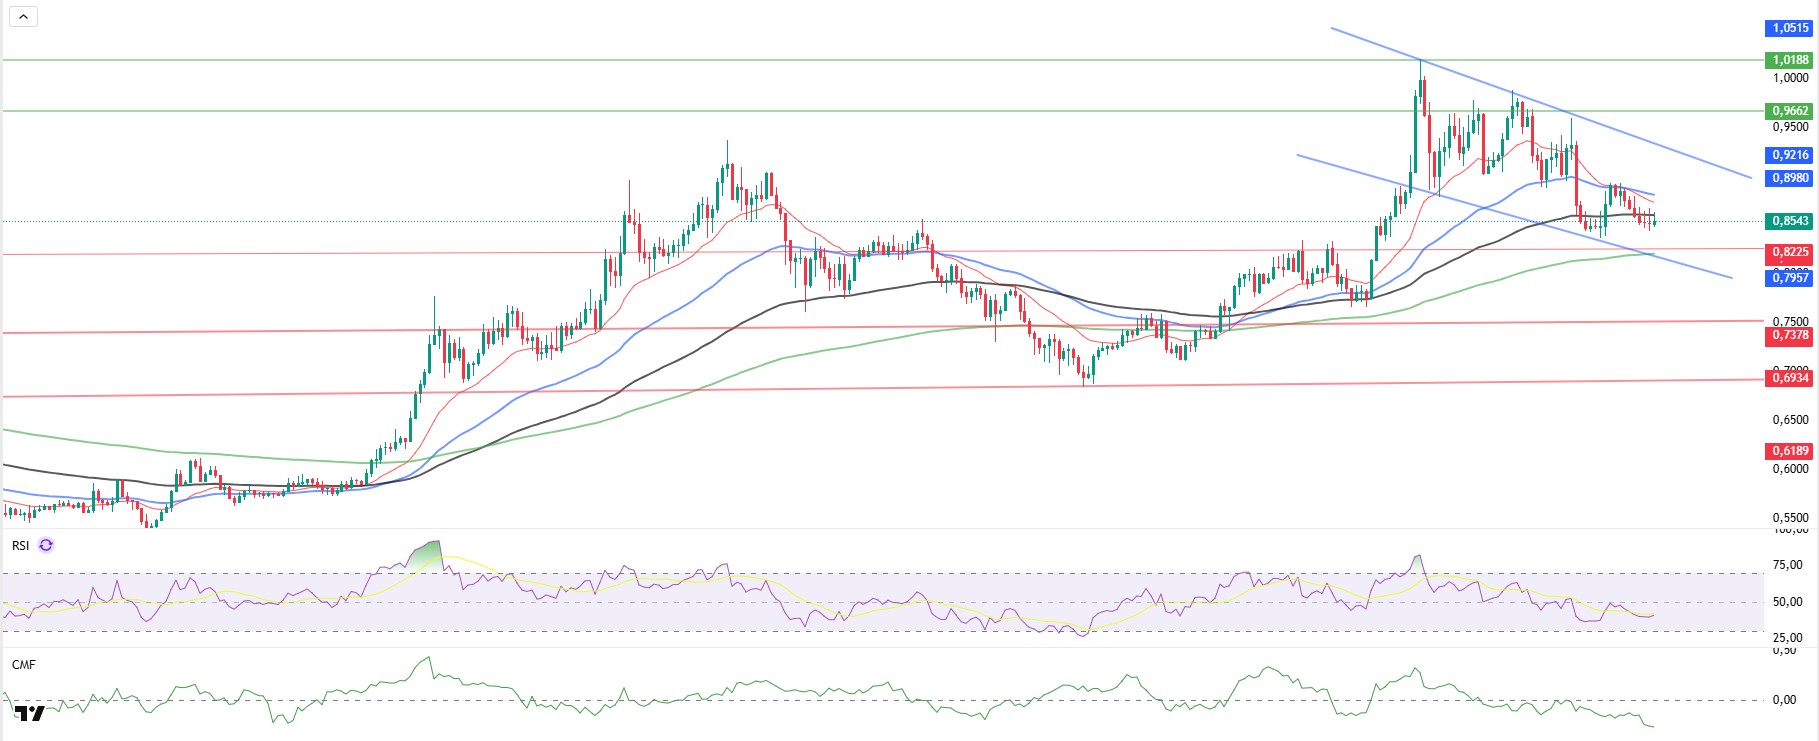
Technically speaking, it continues to trade at 0.8494 levels, managing to hold above the 100-day Exponential Moving Average (EMA-Black Line). As of today, as long as it closes above the 50 EMA (Red Line) and 20 EMA (Blue Line), the price may accelerate its upward trend. If the price closes above the 100-day EMA, it may test the 0.8980 level again. If it breaks above the descending channel on the 4-hour chart, it is expected to remain above the 0.9662 level. The Relative Strength Index (RSI-14) continues to move in the sell zone, dropping to 39 levels, while the Chaikin Money Flow (CMF-20) has fallen to -0.25 levels, confirming the downtrend signal. The decline in money inflows may keep the CMF in the sell zone and exert a downward pressure on the price. In the event of positive macroeconomic data or news related to the Cardano ecosystem, the 1.0188 dollar level could emerge as a strong resistance point. In the event of a decline, the 0.8225 level will be the key support level to monitor.
Support levels: 0.8225 – 0.7378 – 0.6934
Resistance Levels: 1.0515 – 1.0188 – 0.9662
Legal Notice
The investment information, comments, and recommendations contained herein do not constitute investment advice. Investment advisory services are provided individually by authorized institutions taking into account the risk and return preferences of individuals. The comments and recommendations contained herein are of a general nature. These recommendations may not be suitable for your financial situation and risk and return preferences. Therefore, making an investment decision based solely on the information contained herein may not produce results in line with your expectations.