
Technical Analysis
BTC/USDT
In his speech at the OECD Paris meeting, SEC Chairman Paul Atkins explained that most crypto assets are not securities and that a holistic framework with clear rules will be created in the new period. Wells Fargo predicted that the Fed will make five interest rate cuts until mid-2026. Wall Street strategists stated that the CPI data to be released will have a limited impact on stocks. The White House announced that President Trump dismissed Fed member Lisa Cook. BlackRock plans to list its iShares Bitcoin ETF on the London Stock Exchange after a new regulation that will expand access for individual investors. South Africa-based Altvest Capital plans to adopt Bitcoin as a reserve asset by raising $210 million in funding. UK-based Smarter Web Company bought another 30 BTC, bringing its total reserves to 2,470 BTC. Producer Price Index (PPI) in the US increased by 2.6% yoy in August. Expectations were at 3.3% and the previous value was announced as 3.3%.
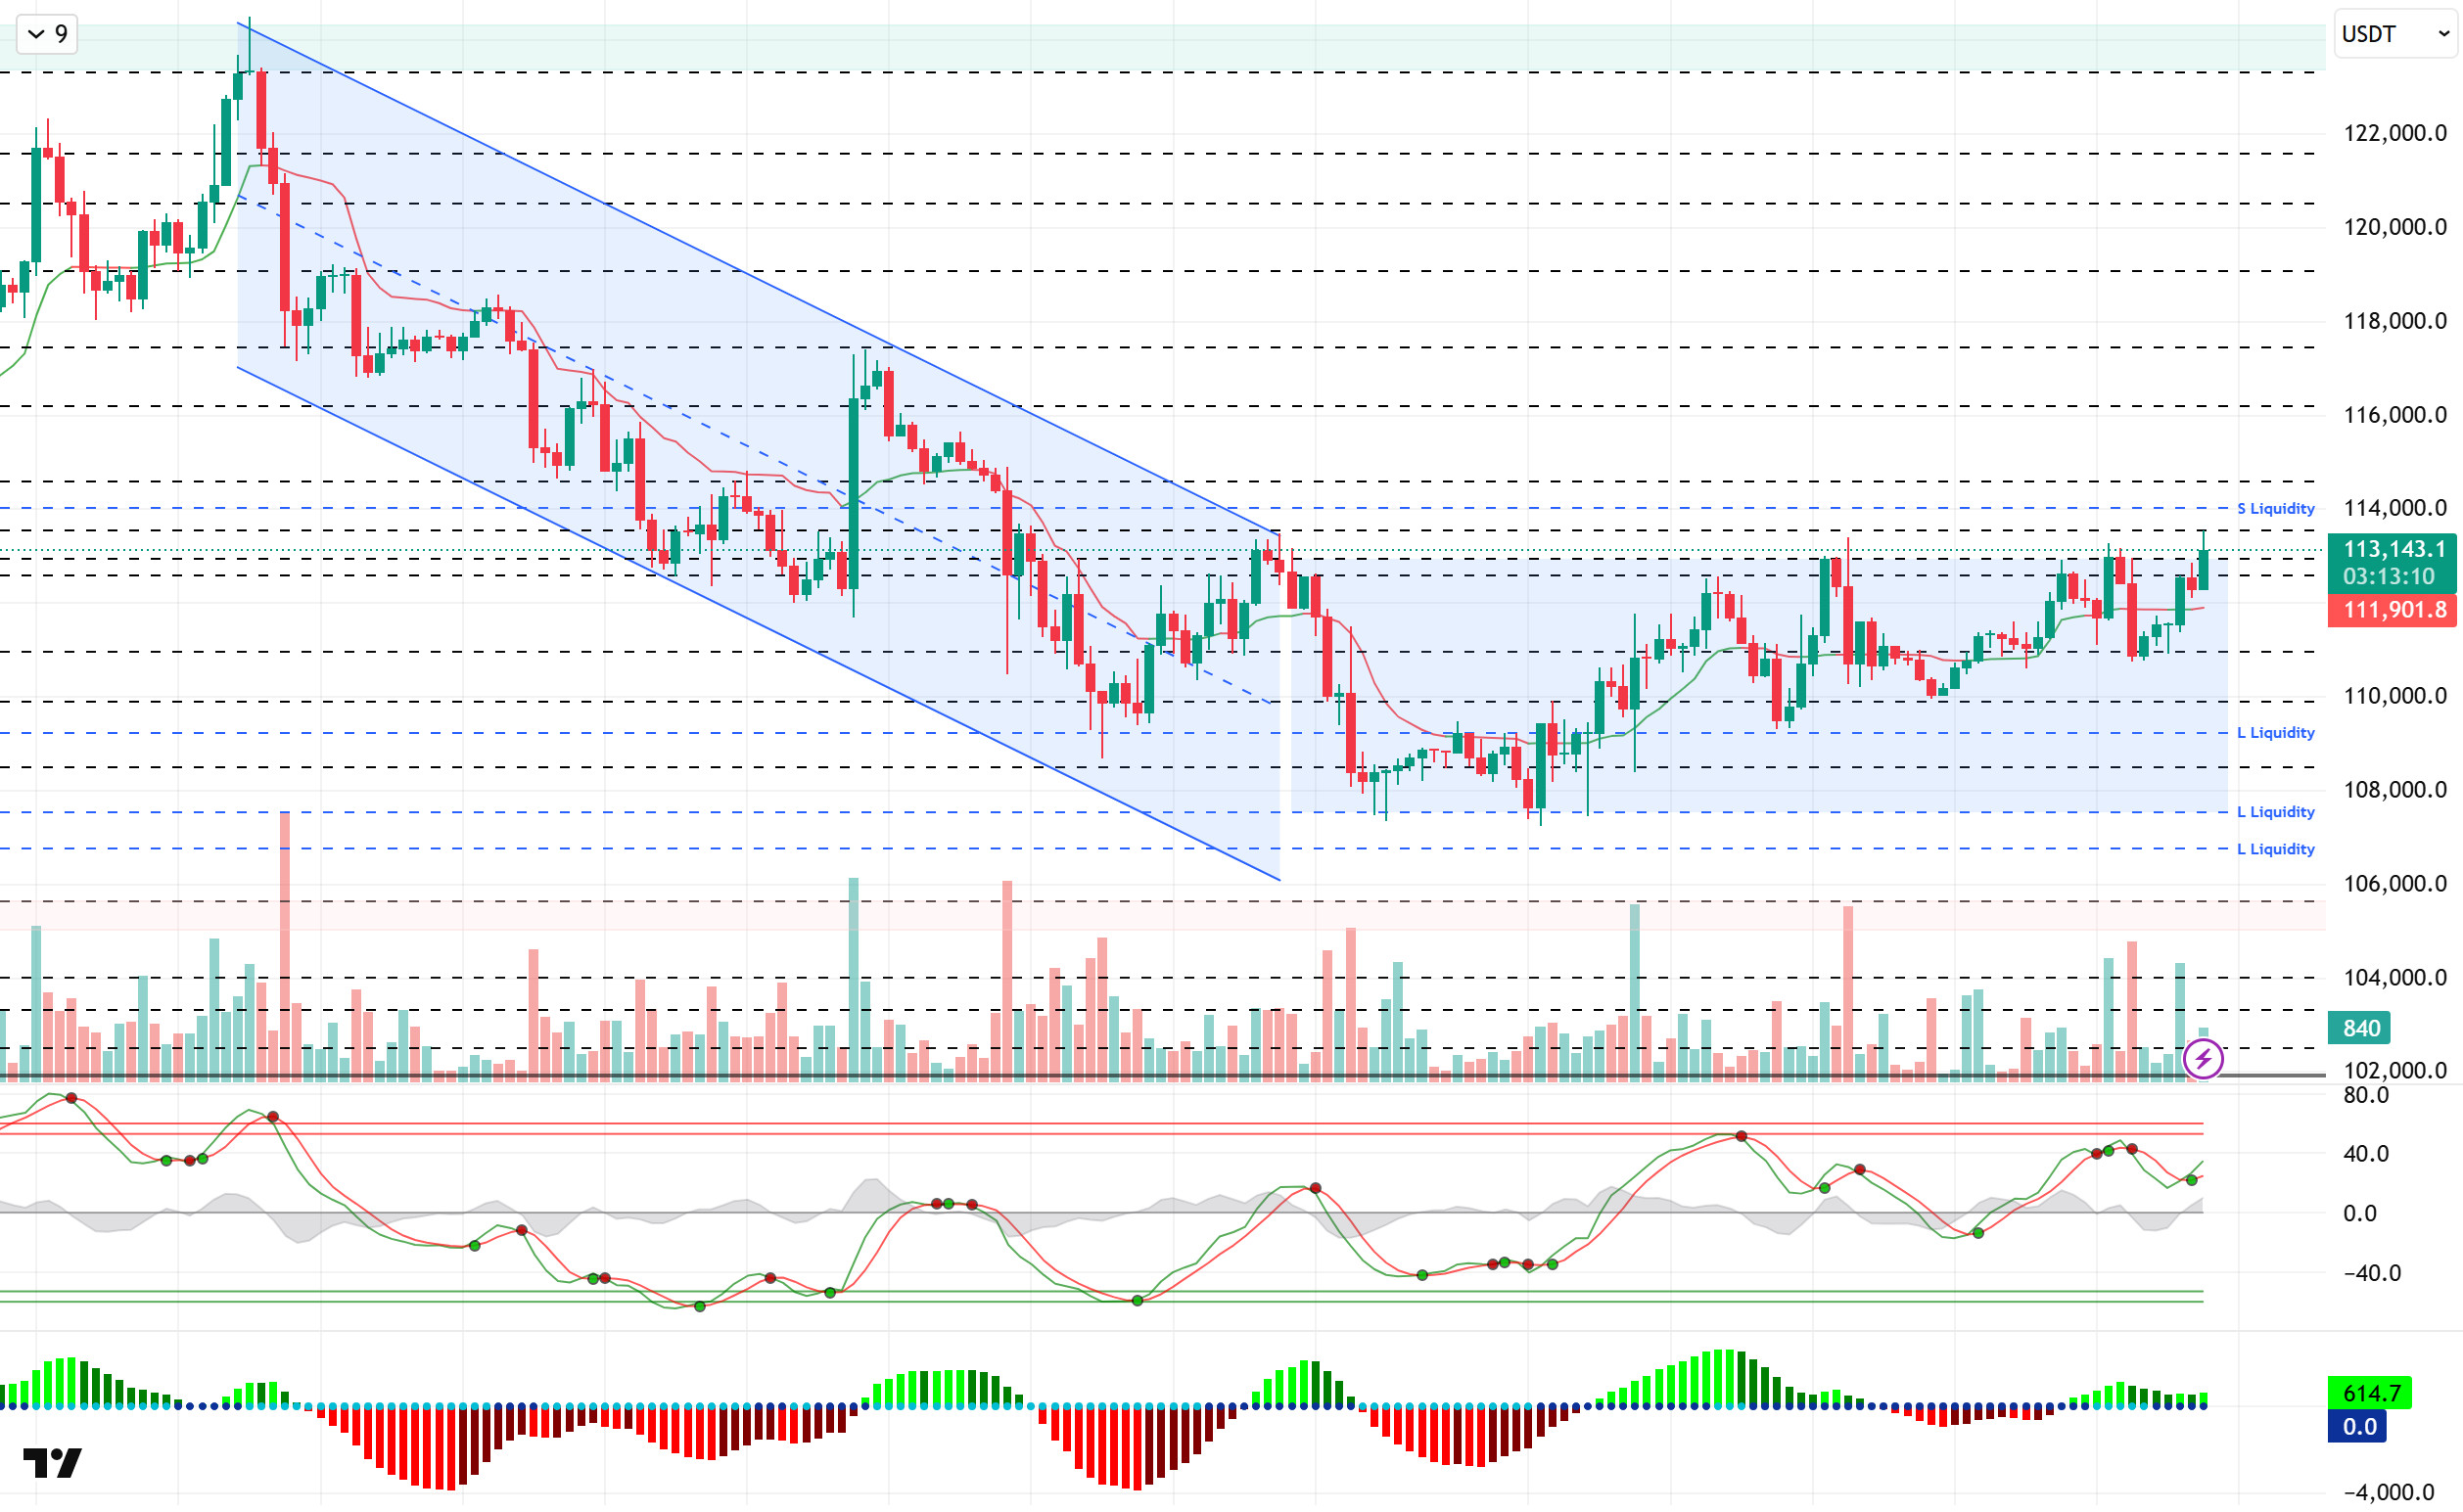
When we look at the technical outlook, BTC, which continued its pricing within the horizontal band range, exceeded the 113,000 level and tested the 113,500 level after the macro data announced. For BTC, which was trading at 113,200 at the time of writing the analysis, the horizontal band gap may give way to a new bullish channel with closures above this level.
Technical indicators once again headed towards the overbought zone with the Wave Trend oscillator (WT) giving a buy signal, pointing to a trend reversal near the channel mid-band. On the Squeeze Momentum (SM) indicator, the histogram is trying to regain momentum in the positive area. The Kaufman moving average is currently moving below the price at 111,900.
Looking at the liquidity data, short-term accumulating sell trades were liquidated at 113.200, while the wider timeframe sell accumulation intensified above 114.000 and became the target zone. The buying tier, on the other hand, was liquidated to some extent at 110,000 – 110,900 levels in the short term, while the 109,000 band became a more intense accumulation zone in the long term.
To summarize, the loss of the optimistic mood in recent days with fundamental developments, interest rate cut discussions among Fed members, tariffs remaining on the agenda with the new distribution of duties and political tensions stand out as factors that put pressure on the price. In technical terms, the formation of a favorable ground for a new upward movement created some recovery. While it was noteworthy that the rises remained in the form of liquidity purchases, it was noteworthy that the price movements turned from a falling trend movement into a horizontal trend channel. The reappearance of catalysts in the market for a new long-lasting uptrend may be possible by creating a driving force on the price. In this context, 112,600 stands out as a critical reference area in the continuation of the upward movement. Exceeding this level may cause the price to gain momentum and bring a movement towards the 114,000 liquidity level. In a possible selling pressure, the 108,500 level may meet us in case of a break of 110,000.
Supports 110,000 – 108,500 – 107,400
Resistances 112,600 – 114,000 – 115,000
ETH/USDT
According to Coinglass data, 135,700 ETH exited exchanges in the last 24 hours, with the largest outflow coming from Coinbase at 120,800 ETH. Validatorqueue data showed that the exit queue on the Ethereum PoS network reached 2.16 million ETH and the waiting time exceeded 37 days. Matrixport reported that trading volume declined from $122 billion to $41 billion, with leveraged long positions at risk of liquidation. SharpLink’s reserve remained at 837,230 ETH, while BitMine’s assets increased to 2,070,000 ETH; Sharp Link also bought back nearly 1 million SBET shares in a $1.5 billion share buyback program.
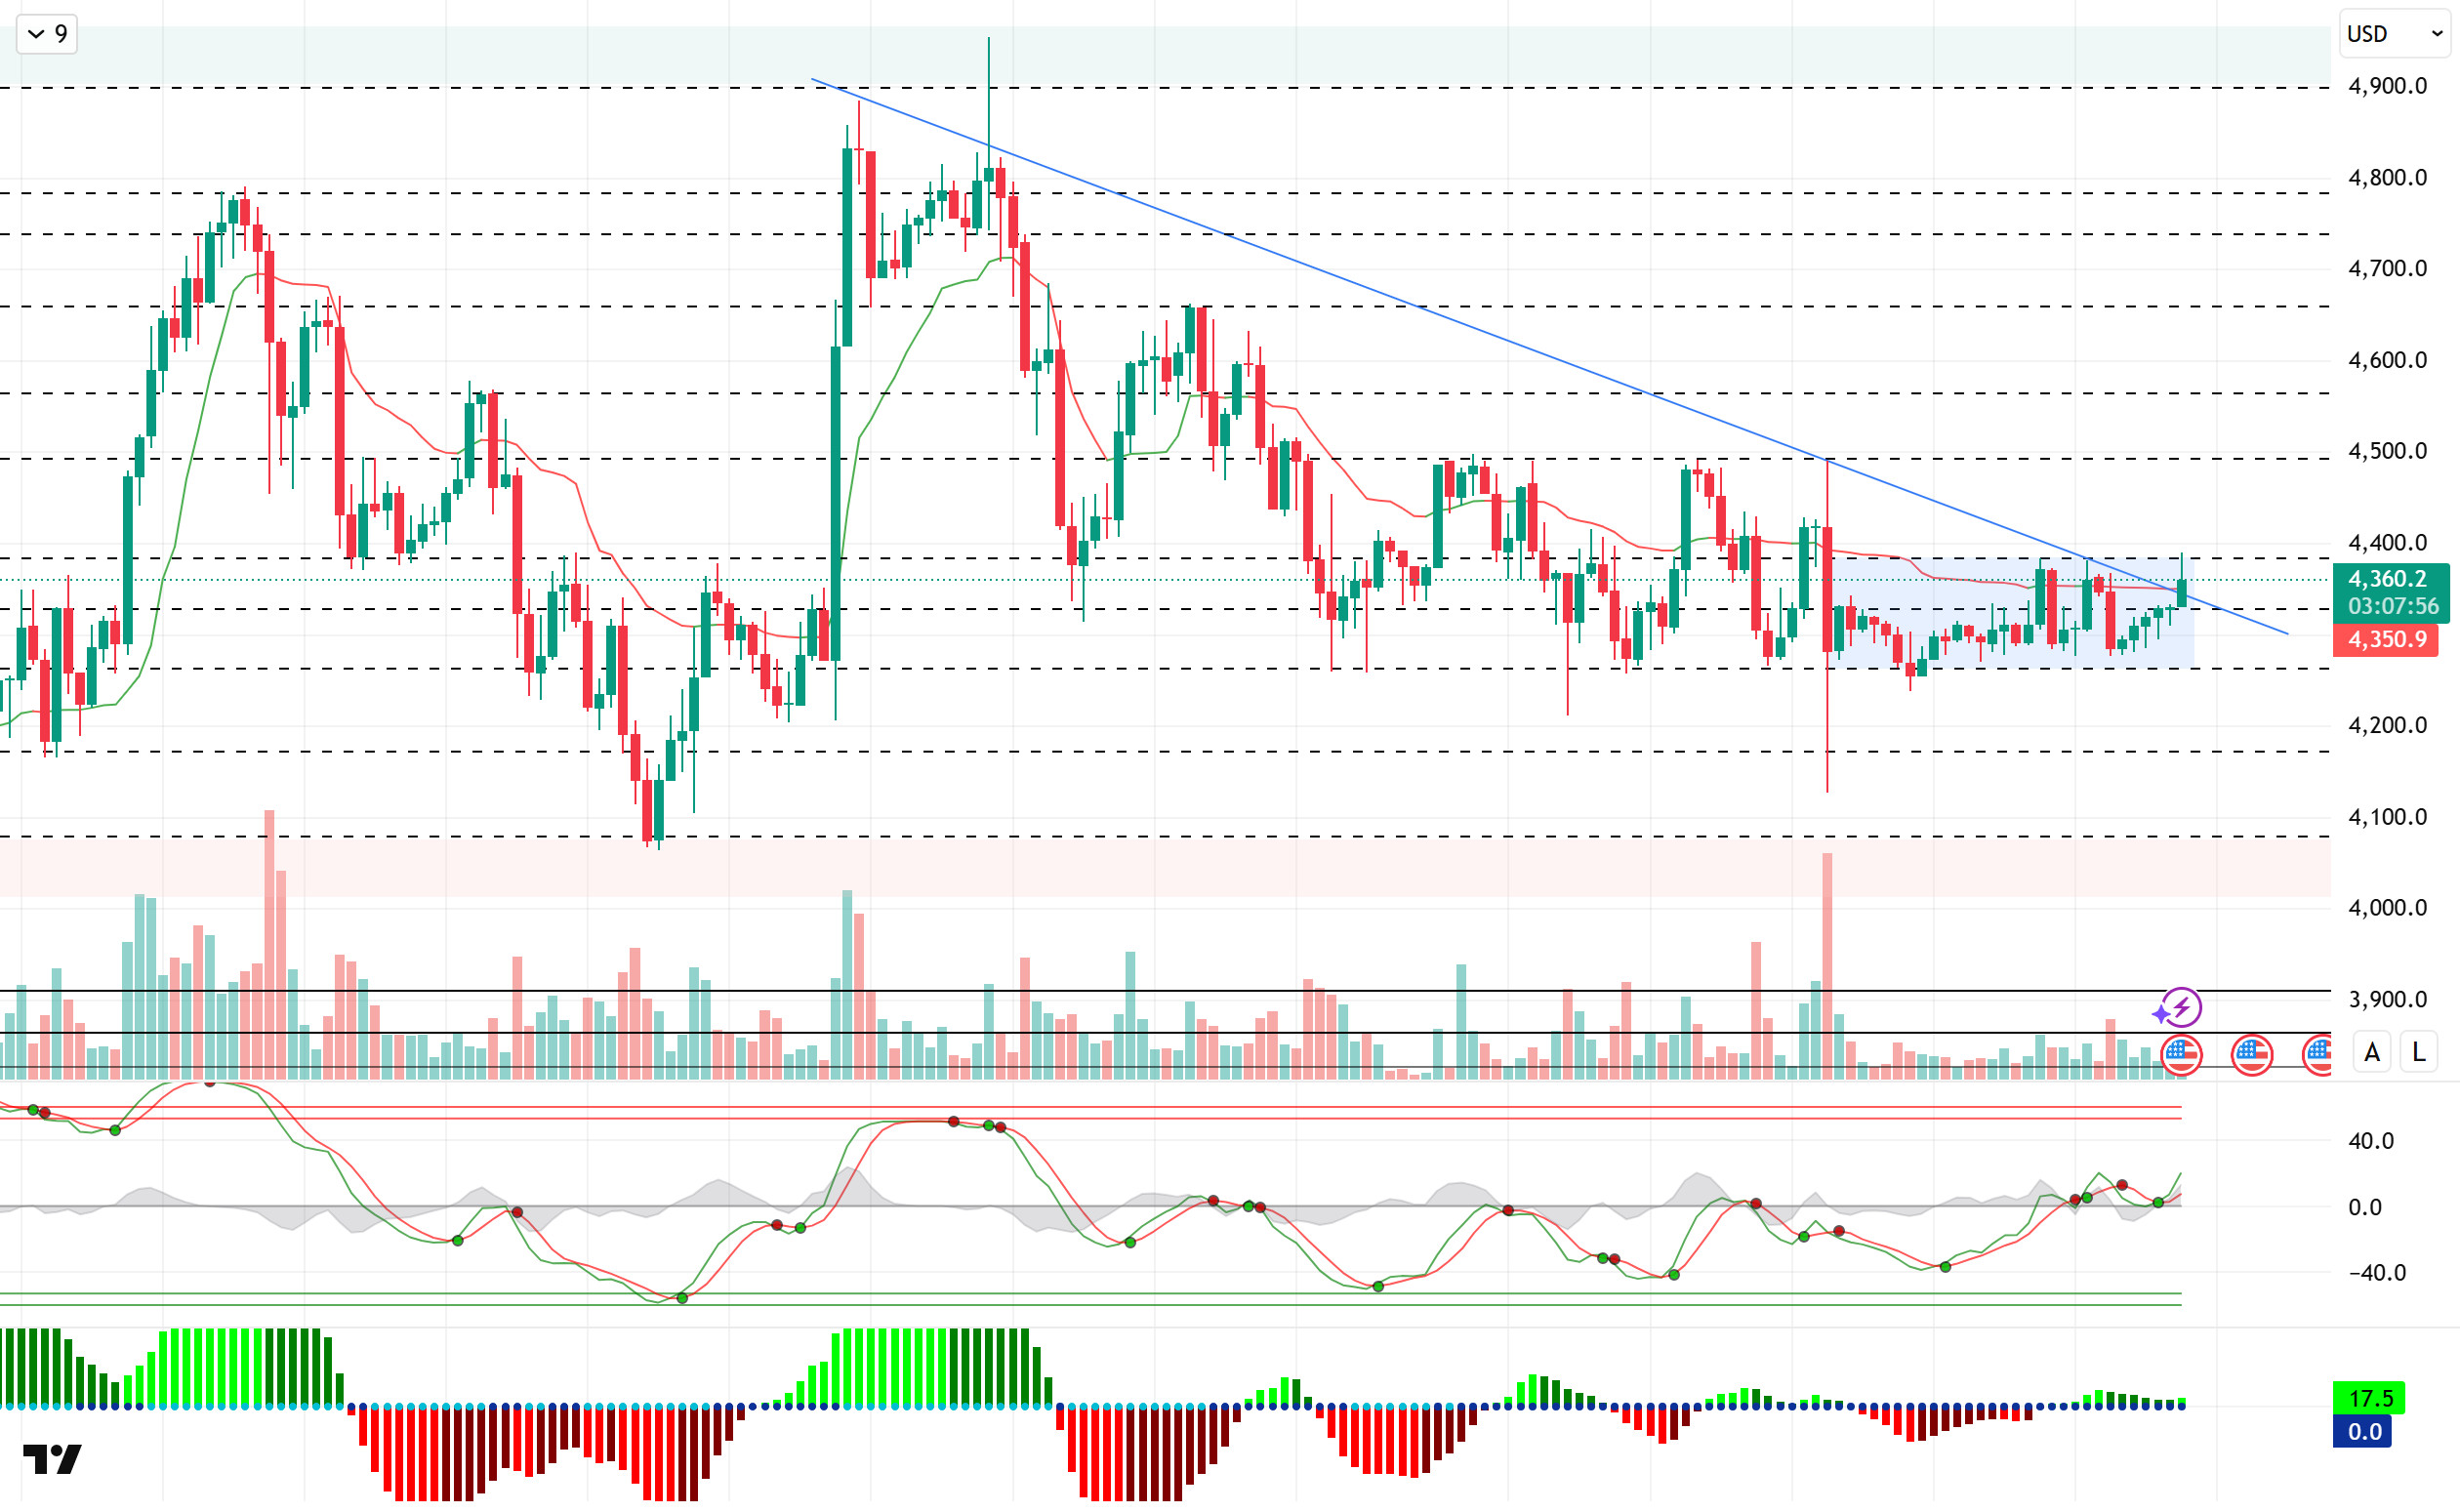
Looking at the technical outlook, ETH broke through the falling trend line once again and reached 4,385 levels. In the previous analysis, ETH, which moved around 4.315 in the previous analysis, increased risk appetite after the data released stood out as the factor that provided momentum on the price. At the time of writing, it continues to trade at 4,370.
Technical indicators, Wave Trend oscillator (WT), after the weakening sell signal in the middle band of the channel, was replaced by a buy signal and headed towards the overbought zone again. In the Squeeze Momentum (SM) indicator, the histogram is trying to regain momentum in the positive area. The Kaufman moving average is currently moving above the price at 4,350.
Looking at the liquidity data, the short-term sell accumulation was liquidated at 4,355, while the sell step was sparse. The buying bias continues to intensify at 4,200 and above in the short and extended timeframe.
In sum, ETH continues to move in line with the overall market developments. When we look at the fundamental dynamics specific to ETH, it is seen that institutional interest continues as ETF inflows turn positive again. On the technical side, while the price continues to recover, liquidity data continues to determine the limits of price movements. In this context, closes above the 4,330 level falling trend line stand out as a critical threshold. The momentum that may occur above this level may move the price to the 4,490 resistance zone. On the other hand, 4,260 will be followed as a support and liquidity area in possible pullbacks. If this support is broken, the downtrend structure may deepen further.
Supports 4,260 – 4,170 – 4,080
Resistances 4,330 – 4,385 – 4,490
XRP/USDT
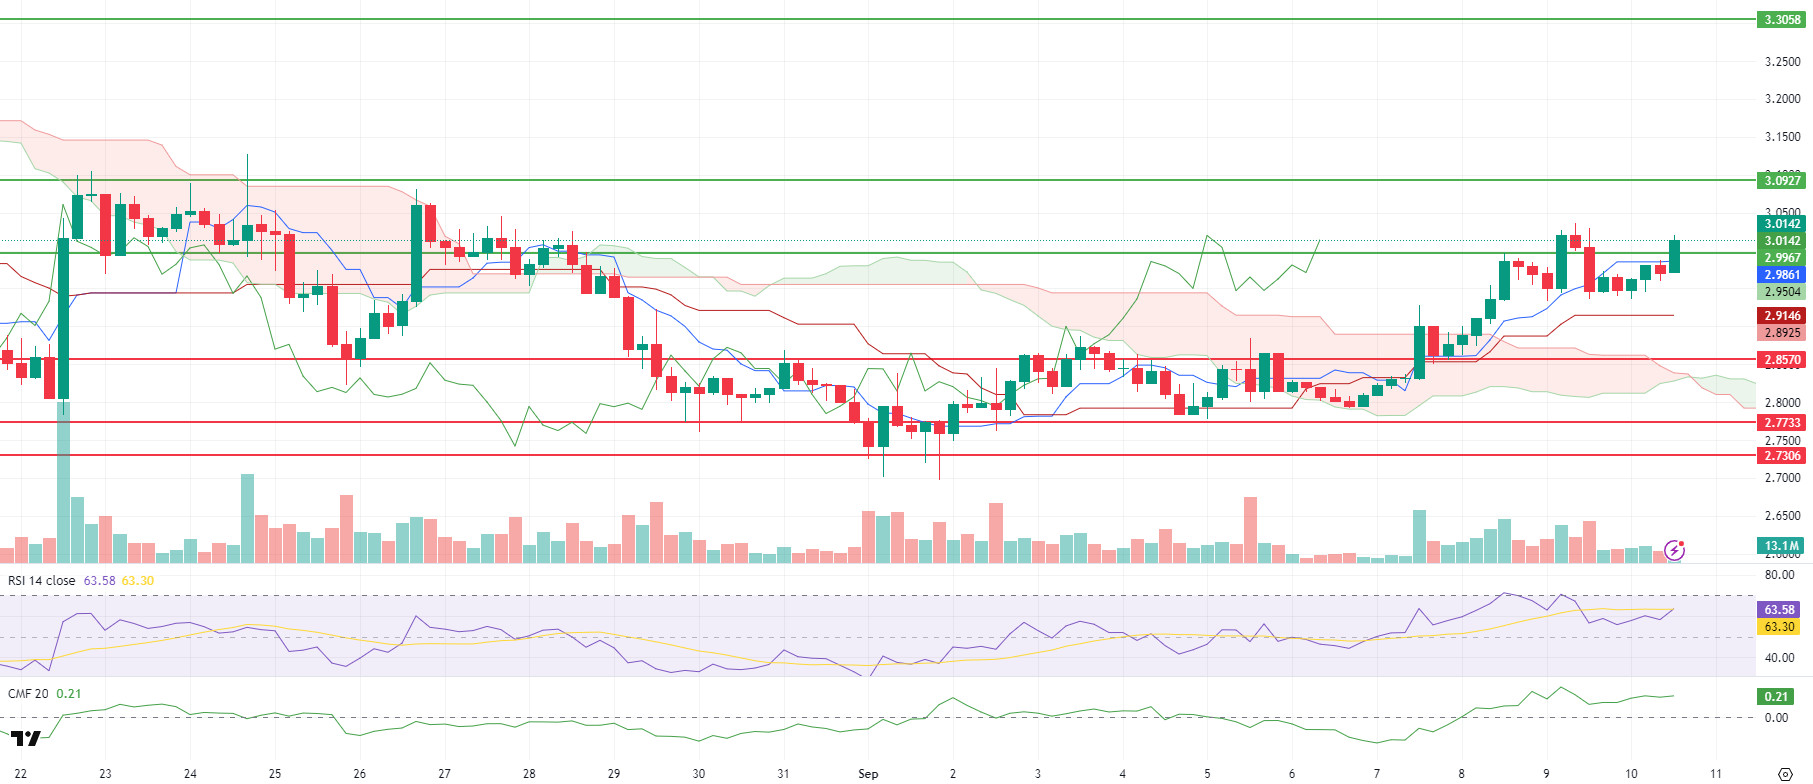
The rise in the cryptocurrency market after the announcement of the US Producer Price Inflation (PPI) data was reflected in XRP. With the purchases after the US PPI data, XRP rose above $ 3.00 again. With this rise, XRP is trading above the resistance level of $ 2.9967. According to Ichimoku, the structure is positive in the short term. It is above Tenkan ($2.986) and Kijun ($2.915) and the price is holding above the cloud.
Relative Strength Index (RSI) is settled in neutral-positive territory at 64. Since it is far from the 70 band, there is still room for upside, but profit realizations may be seen in the 65-70 range. Chaikin Money Flow (CMF) showed an uptrend as it remained in positive territory at 0.22. This shows that liquidity inflows continue and the resistance breakout is likely to be permanent. In general, momentum and liquidity also support the price.
In the short term, if there is a 4-hour closing and volume confirmation above $ 2.9967 in the short term, XRP may come to $ 3.0927 and then $ 3.3058 resistance levels in the continuation of the rise. Otherwise, declines below $ 3.00 may come to the Tenkan band and then the Kijun band below this band. Closes below $2,857 would significantly weaken the bullish scenario and increase the risk of a deeper correction towards $2,773 support. If we look at the general outlook, the momentum coming after the US PPI data is in line with the Ichimoku structure, RSI and CMF. Persistence above $3.00 is the key to the breakout.
Supports: 2.8570 – 2.7733 – 2.7306
Resistances 2.9967 – 3.0927 – 3.3058
SOL/USDT
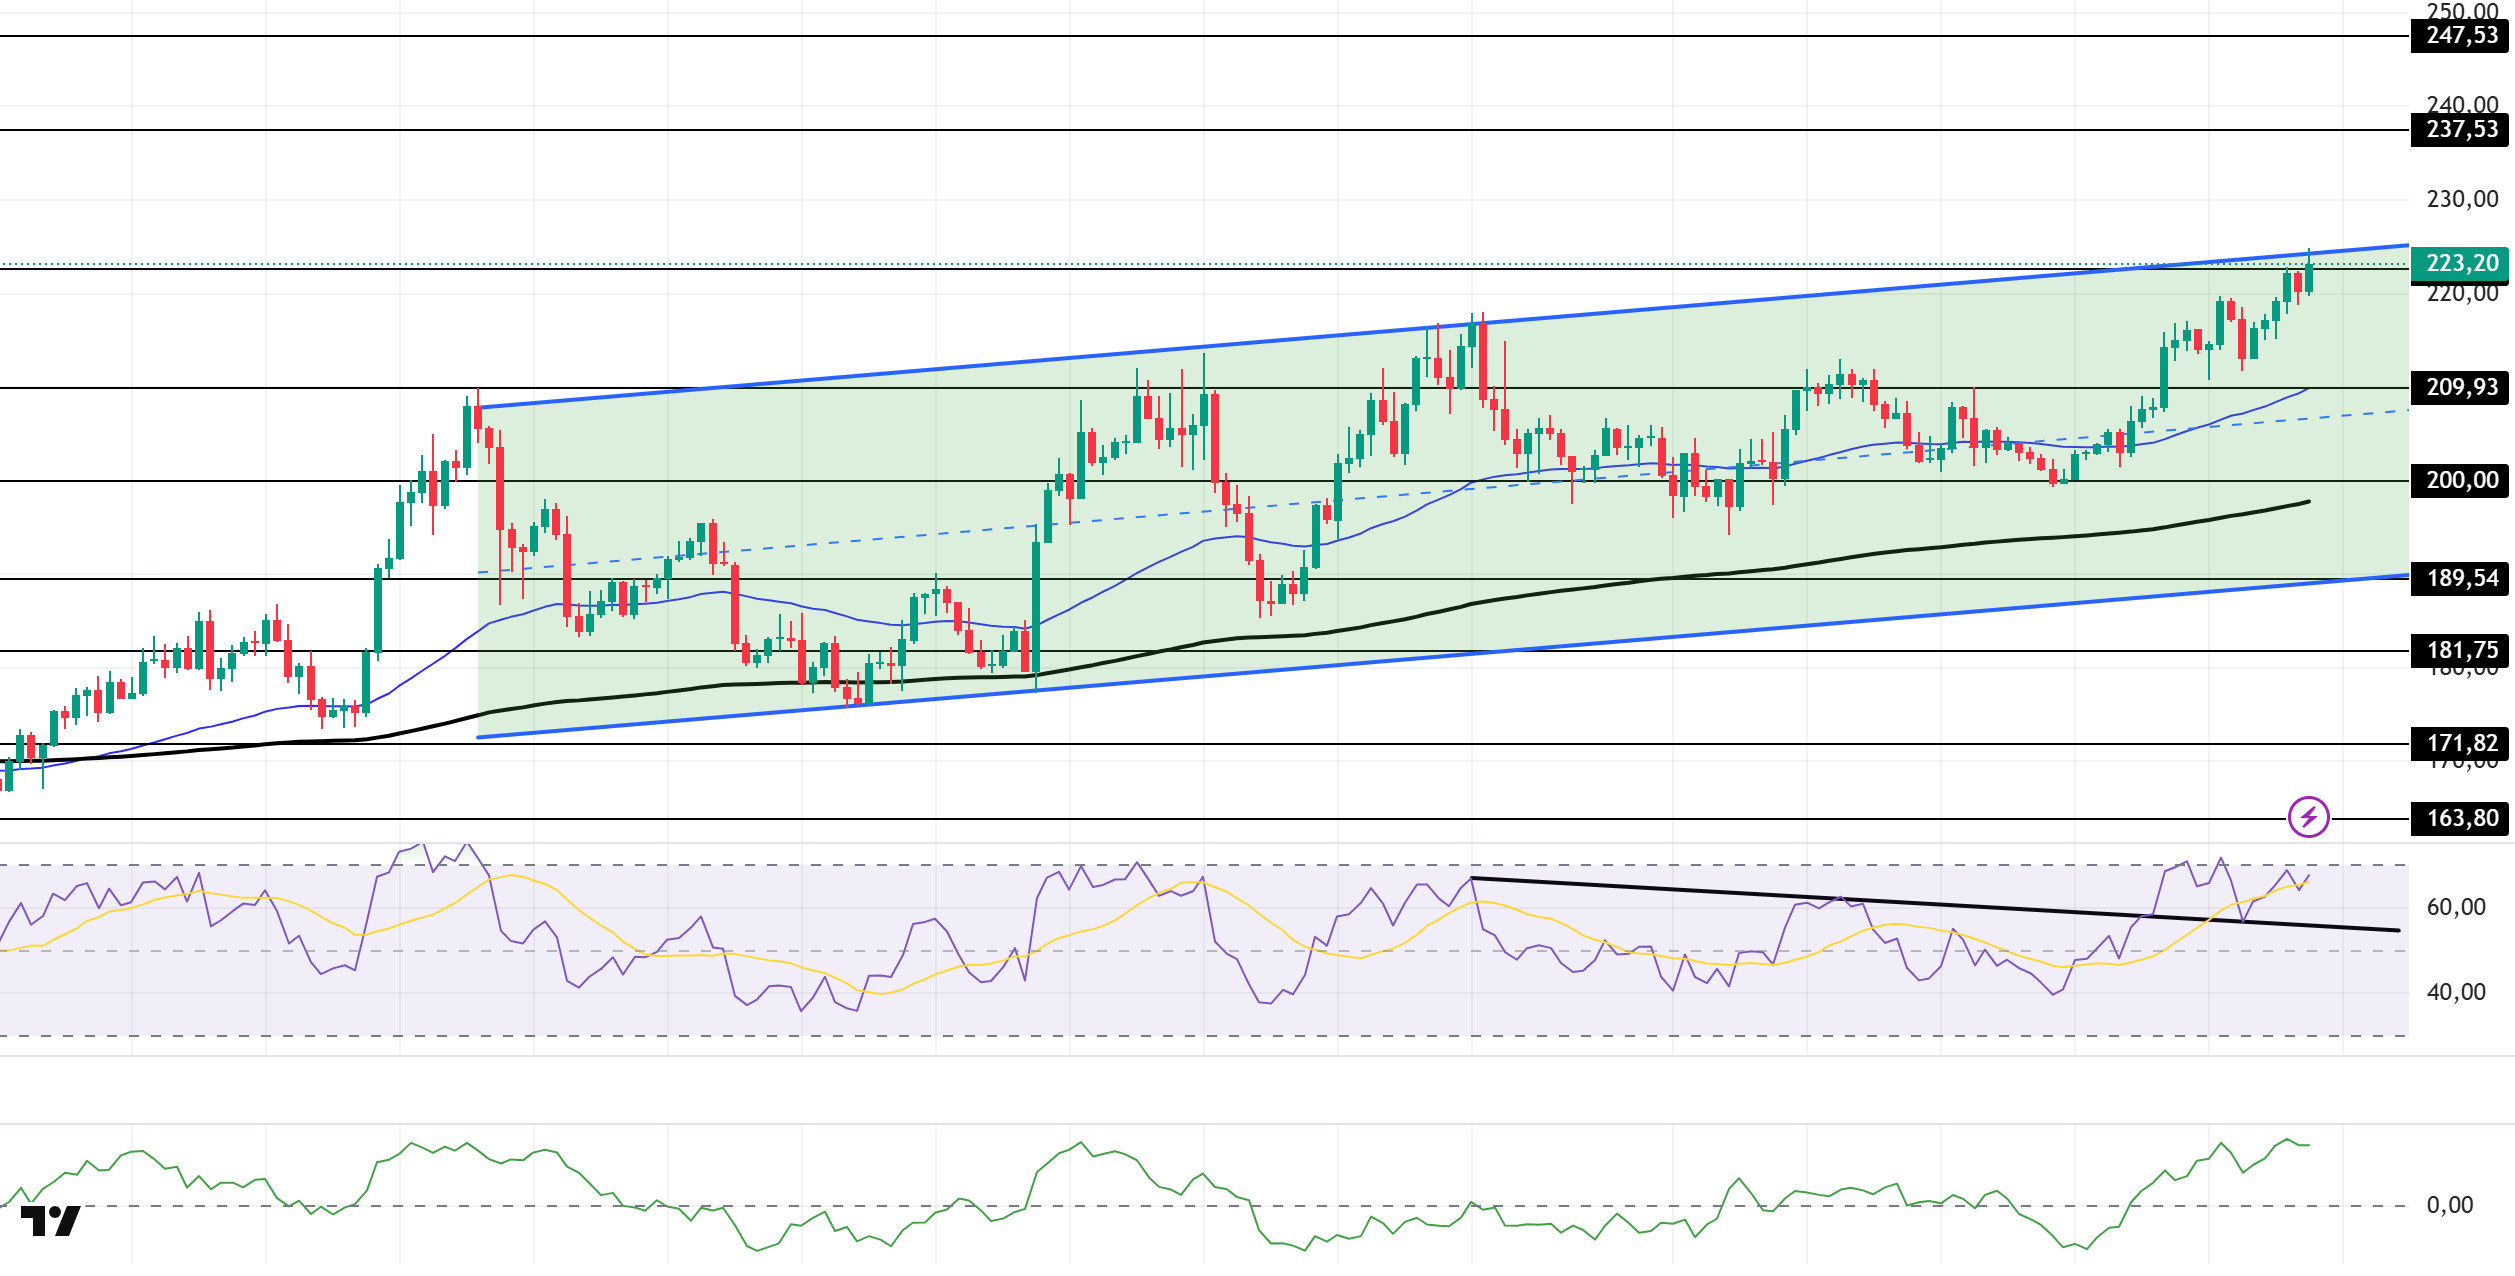
SOL price was slightly bullish during the day. The asset continues to appreciate within the uptrend that started on August 14. Currently testing the ceiling level of the rising trend pattern and the strong resistance level of $ 222.61, the $ 237.53 level can be followed if the price breaks this upward. In retracements, the 50 EMA (Exponential Moving Average – Blue Line) moving average can be followed.
On the 4-hour chart, it continued to be above the 50 EMA (Exponential Moving Average – Blue Line) and the 200 EMA (Black Line). This suggests that the uptrend may continue in the medium term. At the same time, the fact that the price is above both moving averages suggests that the market is bullish in the short term. Chaikin Money Flow (CMF-20) continued to be in positive territory. However, an increase in inflows may keep CMF above the positive zone. Relative Strength Index (RSI-14) continued to be in positive territory. At the same time, it received support from the ceiling of the downtrend that started on August 29 and managed to hold in the upper part of the trend. This could exacerbate the upside. The $237.53 level stands out as a strong resistance point in the event of a rally on the back of macroeconomic data or positive news on the Solana ecosystem. If this level is broken upwards, the rise can be expected to continue. If there are pullbacks due to contrary developments or profit realizations, the $ 209.93 level can be tested. In case of a decline to these support levels, the increase in buying momentum may offer a potential bullish opportunity.
Supports 209.93 – 200.00 – 189.54
Resistances 222.61 – 237.53 – 247.53
DOGE/USDT
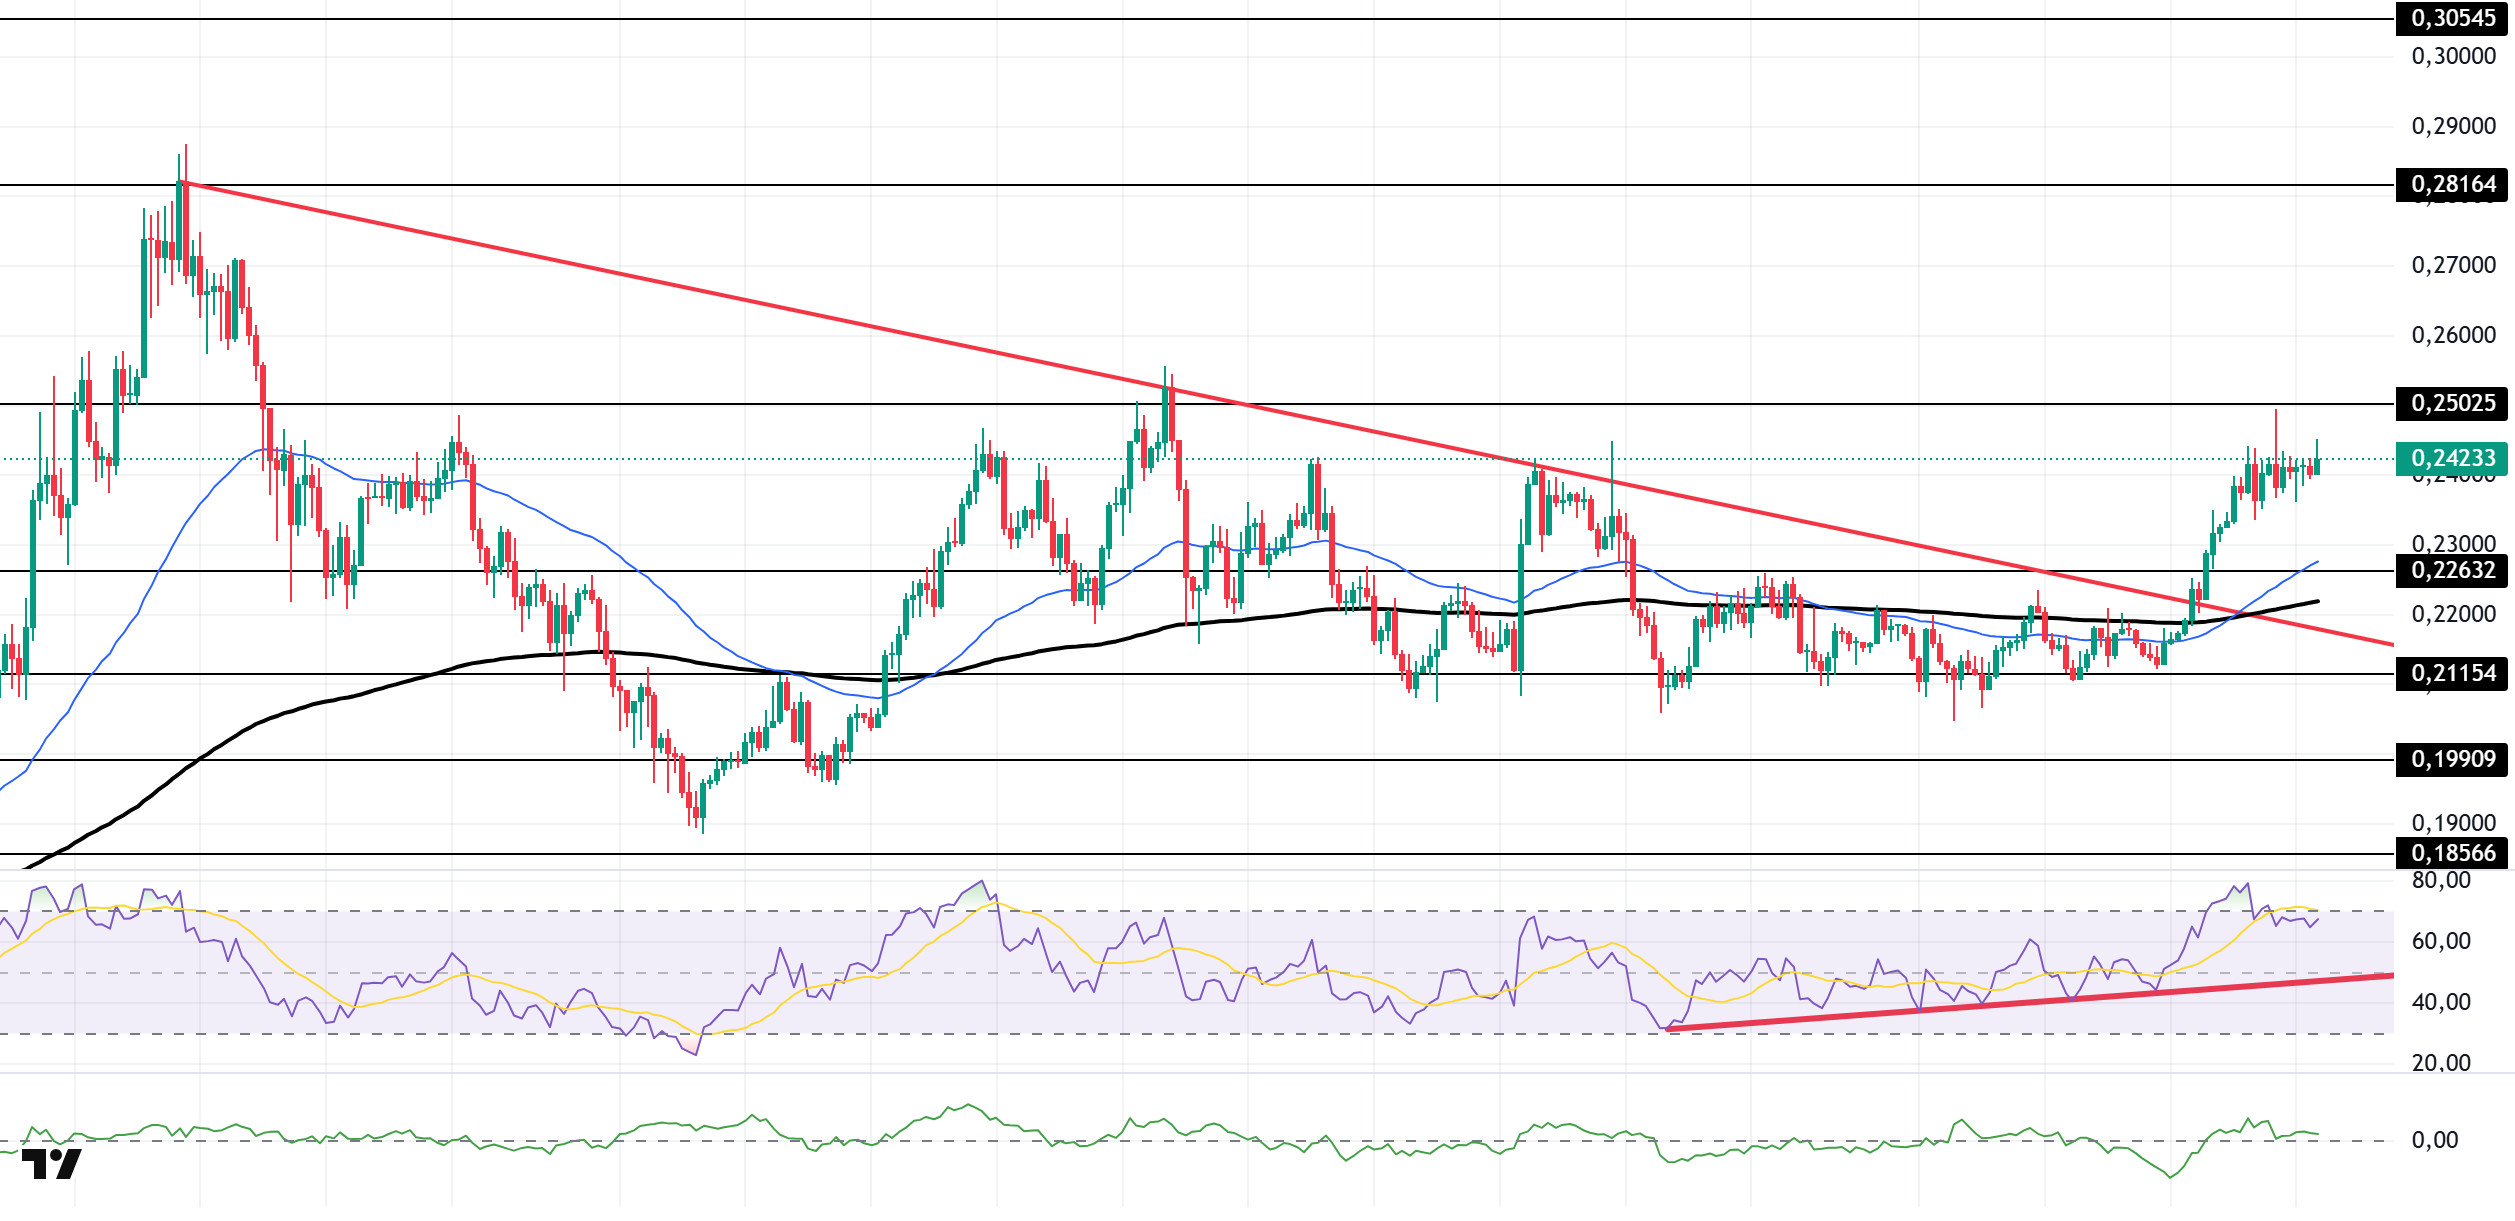
The DOGE price continued its sideways trend during the day. The asset remained in the upper zone of the downtrend that started on July 21. Above the 50 EMA (Exponential Moving Average – Blue Line) and 200 EMA (Black Line) moving averages, the price maintained its momentum and moved higher, but tested the strong resistance level of $0.25025 and retreated. As of now, the asset, which maintains its momentum, may break the $0.25025 level if it continues its uptrend. In case of a possible pullback, the $0.22632 level may be triggered.
On the 4-hour chart, the 50 EMA (Blue Line) remained above the 200 EMA (Black Line). This indicates a continuation of the upward trend in the medium term. The fact that the price is above both moving averages suggests that the uptrend is strong in the short term. Chaikin Money Flow (CMF-20) continues to be in positive territory. In addition, an increase in inflows may push CMF to the upper levels of the positive zone. Relative Strength Index (RSI-14) retreated slightly from the overbought zone. At the same time, it remains in the upper zone of the uptrend that started on August 26. This signaled that momentum may continue. The $0.28161 level stands out as a strong resistance zone in the case of possible rises in line with political developments, macroeconomic data or positive news flow in the DOGE ecosystem. In the opposite case or possible negative news flow, the $0.22632 level may be triggered. In case of a decline to these levels, the momentum may increase and a new bullish wave may start.
Supports 0.22632 – 0.21154 – 0.19909
Resistances 0.25025 – 0.28164 – 0.30545
AVAX/USDT
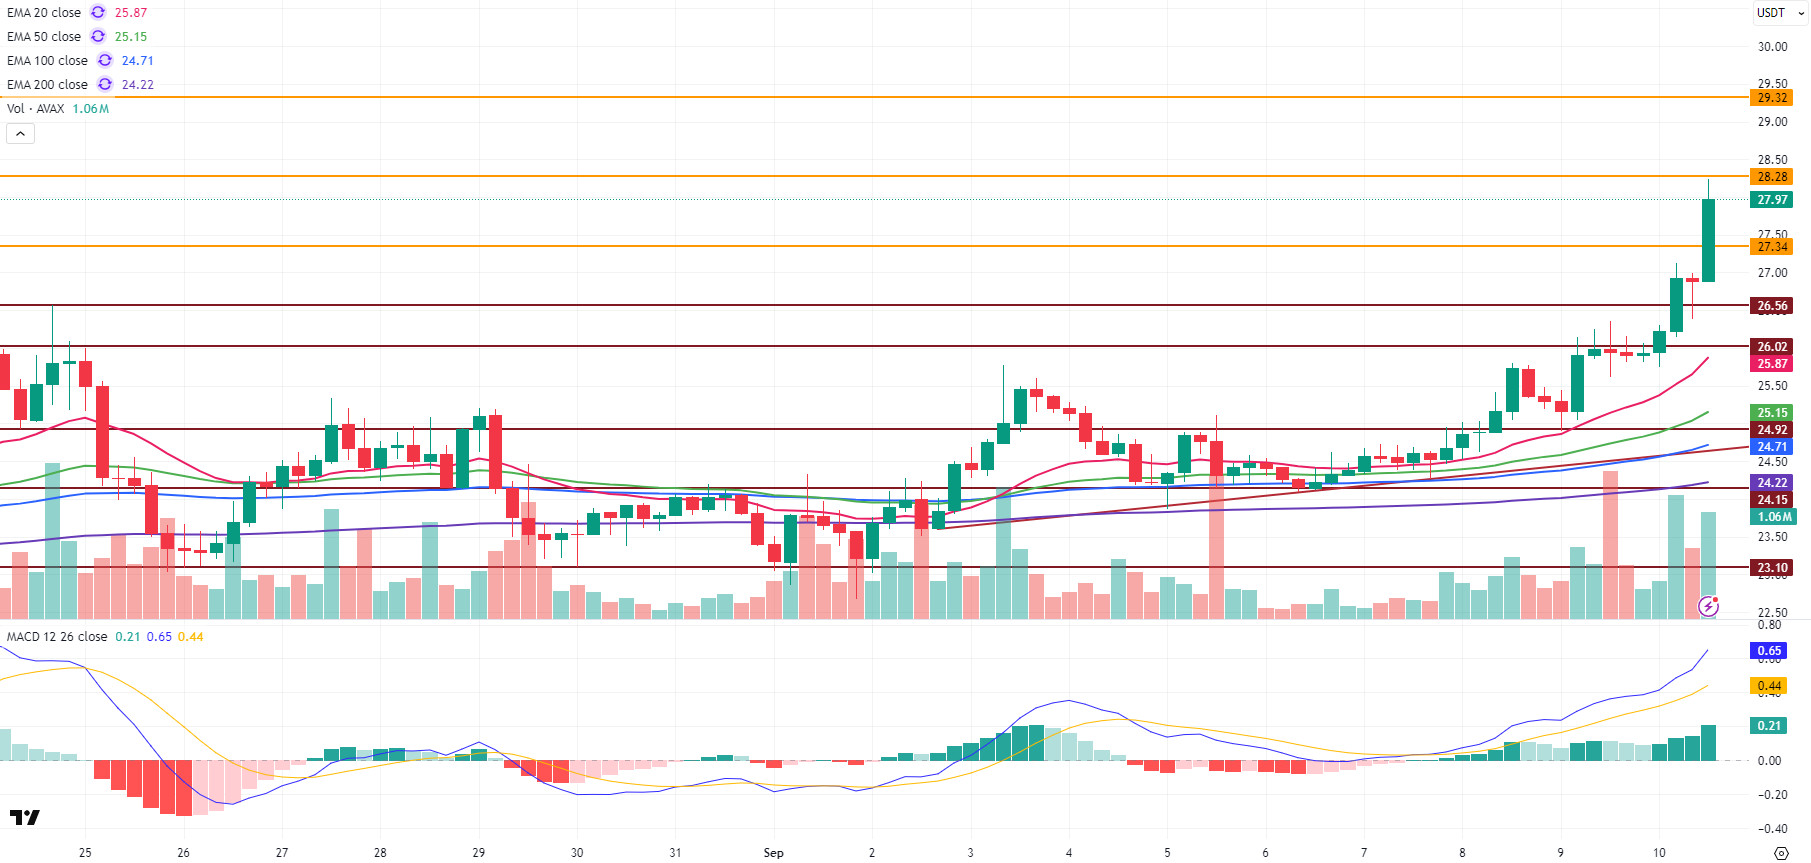
AVAX started the new day with a rise and first rose above the $ 27 level. However, it fell below the $ 26.56 level with selling pressure from this region. AVAX, which retreated to $ 26.40 on the 4-hour chart, recovered again with purchases from here and rose again above the $ 27 level. AVAX, which moved in parallel with the rise seen in the cryptocurrency market after the announcement of the US Producer Price Inflation (PPI) data, rose to the resistance level of $ 28.28. The increase in transaction volume on the ecosystem side plays a catalytic role in the rise of AVAX.
On the technical indicators side, MACD remains above the signal line and maintains its positive momentum. This allows AVAX to break the resistance zones with strong volume. In addition, AVAX is moving away from critical EMA levels, signaling that selling pressure is weakening.
After breaking the $ 26.02 level in its rise today, AVAX managed to break the $ 26.56 level in the continuation of the rise. AVAX, which rose above the resistance level of $ 27.34 after the US Producer Price Inflation (PPI) data was announced, may test the resistance levels of $ 28.28 and then $ 29.32 in the continuation of the rise if it performs candle closures above this level. On the contrary, AVAX cannot be permanent above $ 27 and if it falls below this level, selling pressure may increase. In this scenario, the $ 26 level stands out as a critical support zone. If AVAX falls below this zone, the decline may gain momentum and the $ 24.92 support level may come to the agenda. The general outlook is still positive. In the short term, the potential for a gradual rise towards the $ 30 level continues. However, if the gradual rise cannot be maintained above the resistance zones, it may decline with the selling pressure that may occur.
(EMA20: Pink Line EMA50: Green Line , EMA100: Blue Line , EMA200: Purple Line)
Supports 26.56 – 26.02 – 24.92
Resistances 27.34 – 28.28 – 29.32
BNB/USDT
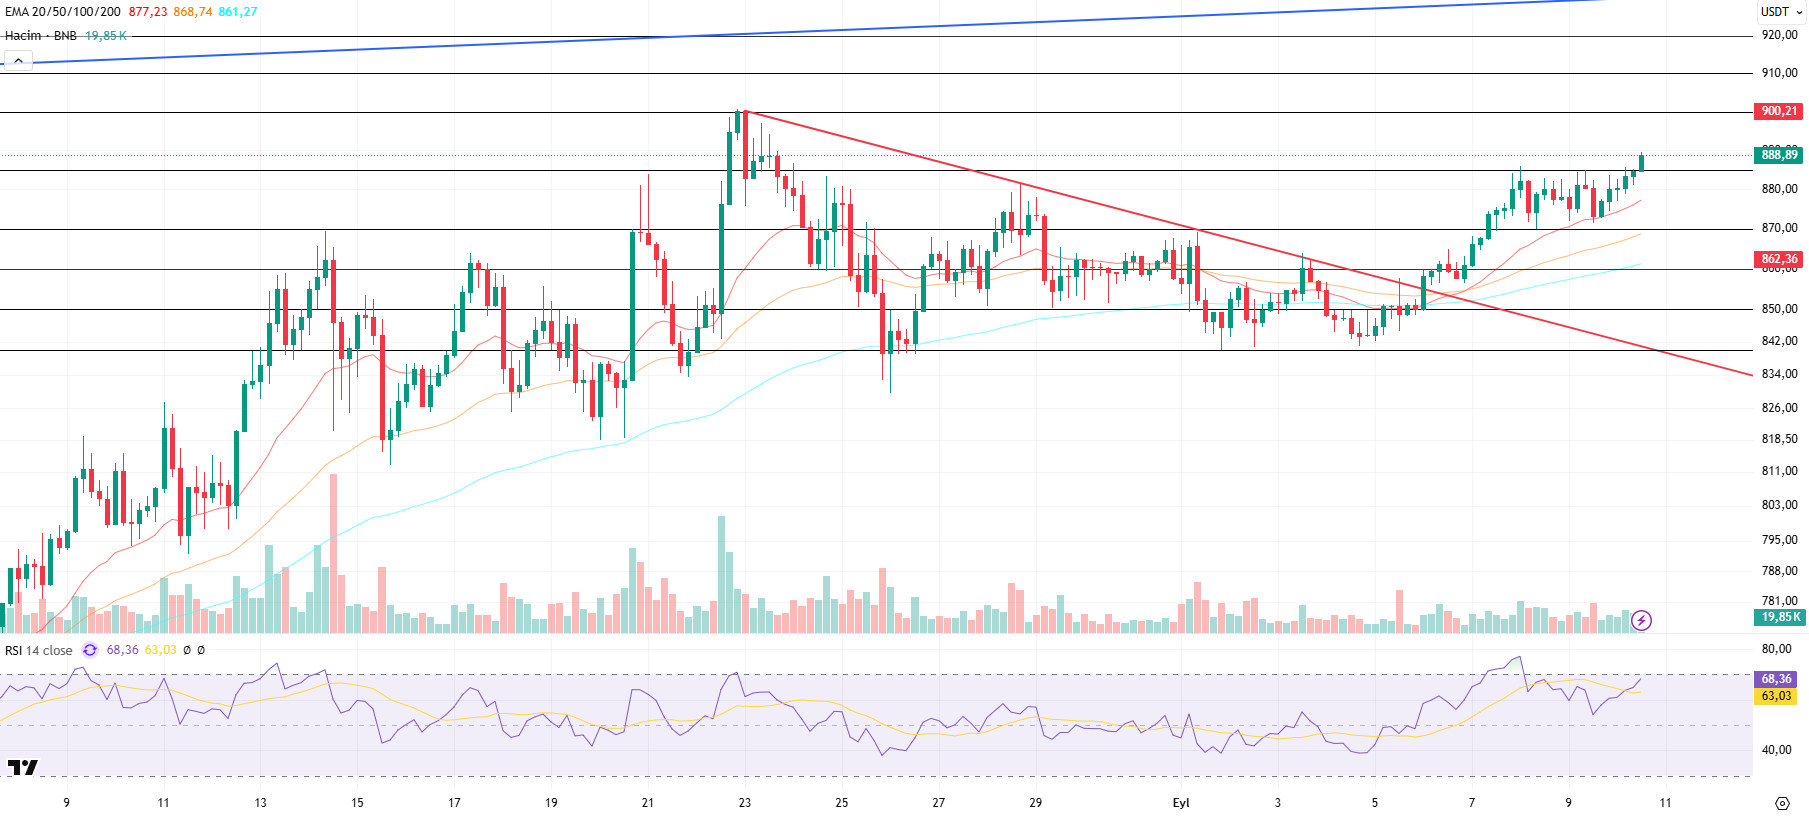
From a technical perspective, BNB/USDT fell as low as $840 on the four-hour chart with the recent pullbacks and regained bullish momentum with the support it received from this level. With this momentum, BNB recovered to the $ 885 level. Thus, the price action generally displayed a horizontal outlook in the $ 840-885 band.
With the effect of the news flow on the fundamental side today, BNB managed to move above the $ 885 level. Persistence above this level shows that the price has left the decision phase and continues its upward trend.
Technical indicators for BNB/USDT, which is currently trading in the range of $885-900, reveal that the recent weakness in trading volume has attracted attention. This picture indicates that indecision is prominent in the market.
In addition, the Relative Strength Index (RSI) fell towards the 50 level with the recent pullbacks and turned down. However, as the price found support at EMA 20 (red line), the RSI turned upwards again. This technical structure indicates that upward movements may continue in the short term, albeit limited.
Within the framework of the current outlook, BNB is expected to test the $ 900 resistance level in the first place if the buying momentum is maintained. If this level is exceeded, it is possible that the price may turn towards $ 910 and $ 920 levels, respectively. On the other hand, if there is no permanence above the $ 885 level and sales strengthen, the price is likely to retreat back to $ 885 support. If this level is broken downwards, the $ 870 and $ 860 levels stand out as critical follow-up zones.
Supports 885 – 870 – 860
Resistances 900 – 910 – 920
ADA/USDT
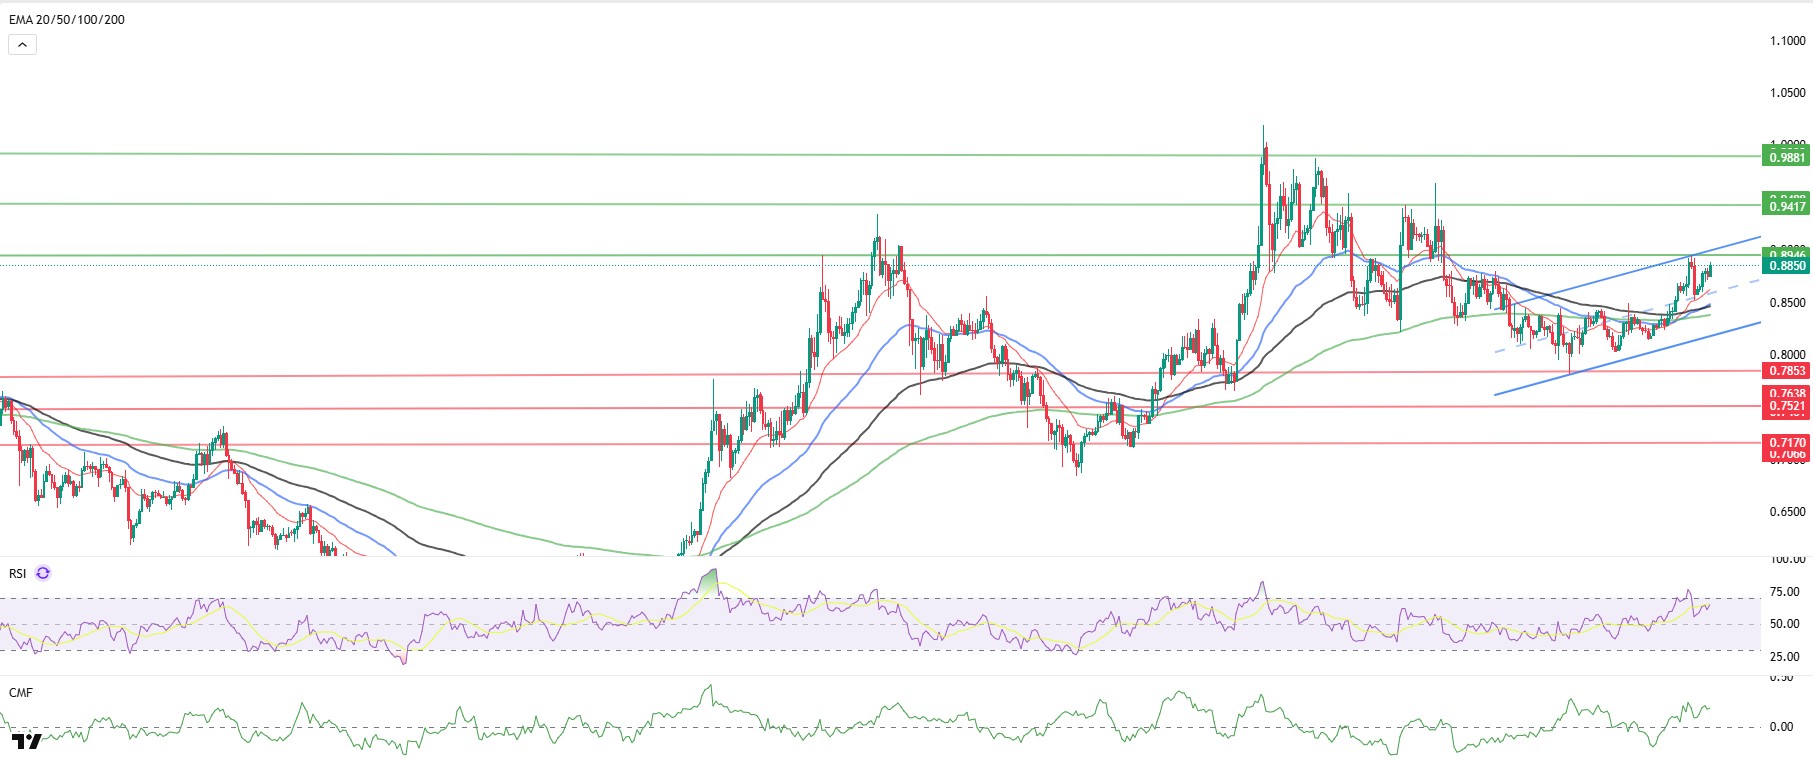
Cardano (ADA) rose after the US Producer Price Index (PPI) data released today and realized reaction buying at the level of $ 0.8887. The US PPI rose by 2.6% year-on-year, below expectations. This development triggered an upward movement in short-term US interest rate futures and led investors to increase their expectations for a Fed rate cut. These expectations supported the general upward trend in cryptocurrency markets.
From a technical point of view, ADA price is still moving within the ascending channel band. In this context, it is expected that the long leveraged positions of about 758 thousand dollars at the level of $ 0.9019 will be liquidated. This move may cause the price to head towards the first resistance level tested yesterday at $0.9058 with reaction purchases during the day. If this level is surpassed, it is likely to reach $0.9280, the peak of the ascending channel within the major trend. The fact that the price is already above all moving averages indicates that the uptrend is strengthening. In particular, staying above the 20-day exponential moving average (EMA-20, Red Line) and 50-day exponential moving average (EMA-50, Blue Line) levels is critical for the sustainability of the uptrend. Momentum indicators also generate positive signals. Relative Strength Index (RSI) rose to 65, approaching the overbought zone. On the other hand, Chaikin Money Flow (CMF-20) indicator rose to 0.17, indicating that the buying potential in the market remains strong. The increase in money inflows supports the CMF to remain in positive territory and creates a bullish correlation with the RSI. This alignment increases the likelihood of a sustained buying bias.
In terms of fundamental factors, possible statements by US President Donald Trump, along with the US Unemployment Claims data expected to be released tomorrow, or institutional/strategic purchases that may take place in the Cardano ecosystem are among the factors that may support the price to head towards the strong resistance point at $ 0.9280. However, in case of a possible selling pressure in the markets, the 0.7851 dollar level should be followed as a critical support point.
Supports 0.7851 – 0.7566 – 0.7170
Resistances 0.9982 – 0.9636 – 0.9280
Legal Notice
The investment information, comments, and recommendations contained herein do not constitute investment advice. Investment advisory services are provided individually by authorized institutions taking into account the risk and return preferences of individuals. The comments and recommendations contained herein are of a general nature. These recommendations may not be suitable for your financial situation and risk and return preferences. Therefore, making an investment decision based solely on the information contained herein may not produce results in line with your expectations.

