Technical Analysis – September 25, 2025
BTC/USDT
As calls for an ethics review of chip and crypto deals between the UAE and Trump’s team come to the fore, Fed officials Austan Goolsbee and Mary Daly strike different tones on interest rate cuts. Chinese Premier Li Qiang announced that his country will no longer seek developing country status at the WTO. US-China technical trade talks will take place in Washington, while calls to avoid politicizing trade emerged in China-EU contacts. SEC Chairman Paul Atkins reported that they are conducting joint regulatory work with the CFTC for crypto markets.
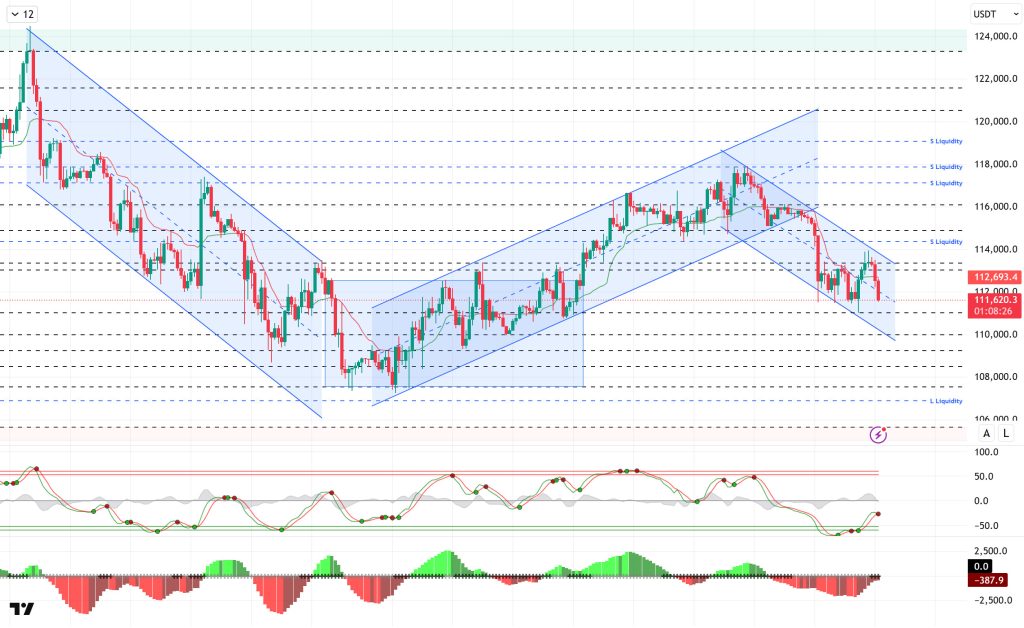
Looking at the technical picture, BTC, which tested the 113,000 level in the previous analysis, managed to break through this level in its latest attempt and tested the 113,900 level. Unable to maintain its gains, the price faced renewed selling pressure and fell below the 112,000 level. At the time of writing, it continues to trade slightly bearish around the 111,700 region.
Technical indicators show that the Wave Trend oscillator (WT) gave a buy signal in the oversold zone, but after the trend reversal, it turned back to selling. The Squeeze Momentum (SM) indicator’s histogram is gaining momentum within the negative zone. The Kaufman moving average is currently trading above the price at the 112,700 level.
According to liquidation data, short-term buy-side transactions have started to intensify again around 111,000. On the sell side, the concentration in the 113,500–114,000 band has been liquidated. In the long term, a significant concentration was recorded in the 117,800–119,000 zone. The total liquidation amount over the past 24 hours was $401 million. Of this, $326 million came from buy-side transactions and $74 million from sell-side transactions.
In summary, while there is no clear fundamental catalyst for recent sales, the decline in futures-driven selling pressure appears to be deepening the downturn. Overall, the medium-term outlook for the market remains positive. On the technical side, a minor descending channel is being tracked, and a break above the upper level of the channel could signal a new uptrend. In terms of liquidity data, the recent decline has completely cleared the buying levels, while a significant increase in selling levels stands out. In this context, for the price to recover, it may be necessary to regain the 114,000 level in the first stage, followed by closes above 115,000. However, if selling pressure persists, the 111,400 level will be monitored, and if this level is lost, the 110,000 level will emerge as a new support area.
Support levels: 111,400 – 110,000 – 108,000
Resistance levels: 112,600 – 114,000 – 115,000
ETH/USDT
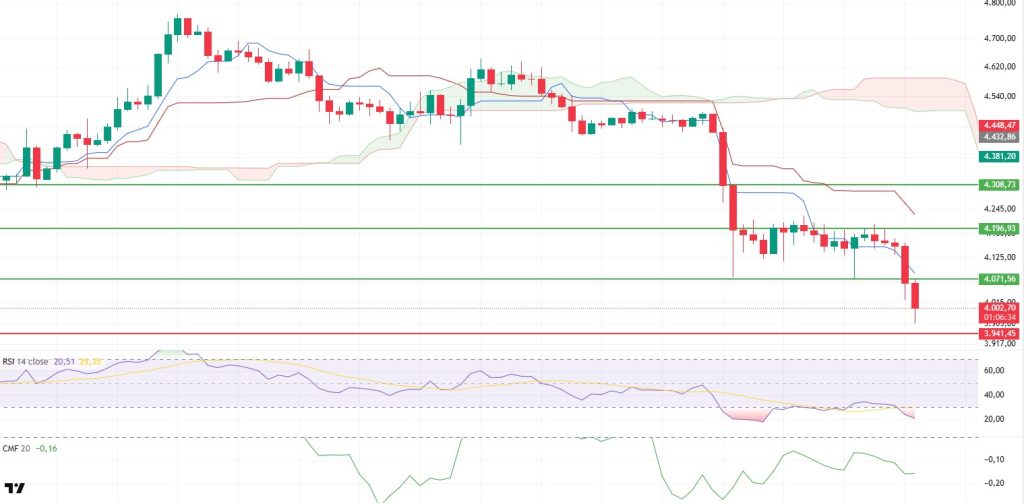
After facing strong resistance at $4,196 yesterday, the ETH price encountered a sharp sell-off. The price retreated to the $4,071 support level in the morning hours and, with the downward break of this level, fell below the psychologically important $4,000 threshold. This movement signals a deterioration in the short-term market structure and confirms that selling pressure has come into play strongly.
Looking at momentum indicators, the Relative Strength Index (RSI) has fallen back into oversold territory, indicating that selling has intensified significantly and the market is under extreme pressure. While the RSI being at these levels technically sets the stage for a rebound in buying activity in the near future, the current positioning highlights the market’s weakness.
Looking at liquidity flow, the Chaikin Money Flow (CMF) indicator remaining stable despite the price decline stands out as a noteworthy factor. This indicates that money inflows into the market have not completely dried up and that certain investor groups are maintaining their long positions. On the other hand, the Cumulative Volume Delta (CVD) indicator reveals that sales are predominantly originating from the futures market. This scenario shows that panic selling in leveraged markets is amplifying the impact on prices, but there is not a similarly strong outflow on the spot side.
Critical support and resistance levels stand out in the short-term outlook. If the price continues to remain below $4,000, it could pave the way for the decline to deepen towards the $3,960 support level. Failure to hold this level could increase selling pressure and bring the possibility of a pullback to the $3,850 range. Conversely, a retest above the $4,070 level would signal a weakening of the current negative scenario and strengthen the possibility of a short-term rebound towards the $4,196 resistance. The overall outlook suggests that short-term pressure is prevailing in the market and buyers have not yet taken control. However, both the RSI entering the oversold zone and the CMF remaining stable indicate that a search for equilibrium may begin in the medium term.
Top of Form
Below the Form
Support levels: 4,071 – 3,851 – 3,672
Resistance levels: 4,071 – 4,196 – 4,308
XRP/USDT
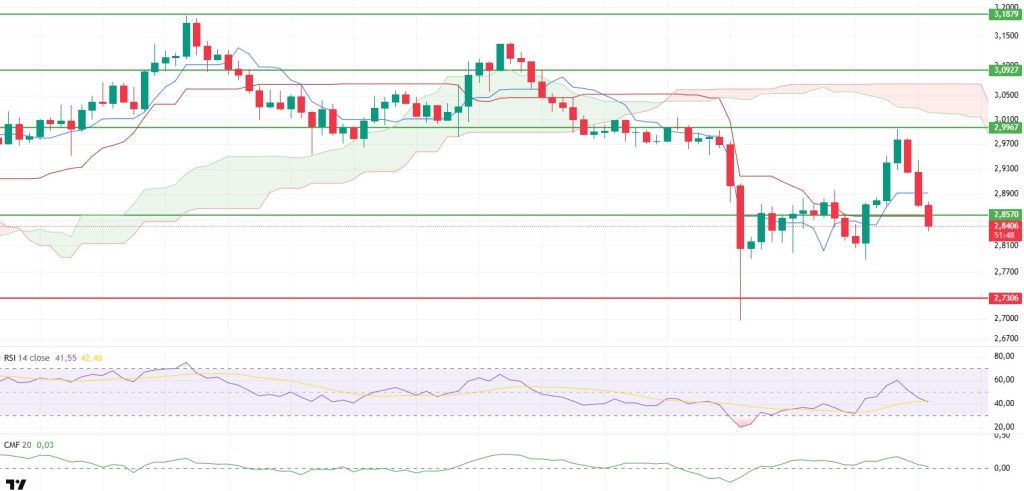
The XRP price rose strongly as expected yesterday, reaching the main resistance level of $2.99. However, intense selling pressure encountered in this region caused the price to retreat to the $2.85 level in the morning hours. This movement indicates that buyers have lost strength in the short term and that the market is at a critical threshold.
Technical indicators also confirm this weakening. The Relative Strength Index (RSI) is pulling back, signaling a loss of momentum and revealing that the market is gradually losing its buying power. The Chaikin Money Flow (CMF) indicator approaching the zero line indicates that liquidity is starting to flow out of the market and that buyers’ appetite is waning.
In the short-term outlook, the $2.85 level stands out as a critical support. If the price remains below this level, selling could gain momentum and steeper declines could come into play. The $2.79 and $2.73 levels, in particular, stand out as important support zones to watch for downward movements. On the other hand, if the price breaks above the $2.99 resistance again, it could eliminate the current negative outlook, allowing buyers to regain strength and paving the way for a rise towards the $3.08 level. Overall, XRP is entering a decision phase in the short term. The $2.85 support and $2.99 resistance levels stand out as two critical thresholds that will determine the direction of intraday price movements.
Support levels: 2.8570 – 2.7306 – 2.6513
Resistance levels: 2.9967 – 3.0927 – 3.1879
SOL/USDT
DeFi Development Corp increased the size of its current share buyback to $100 million.
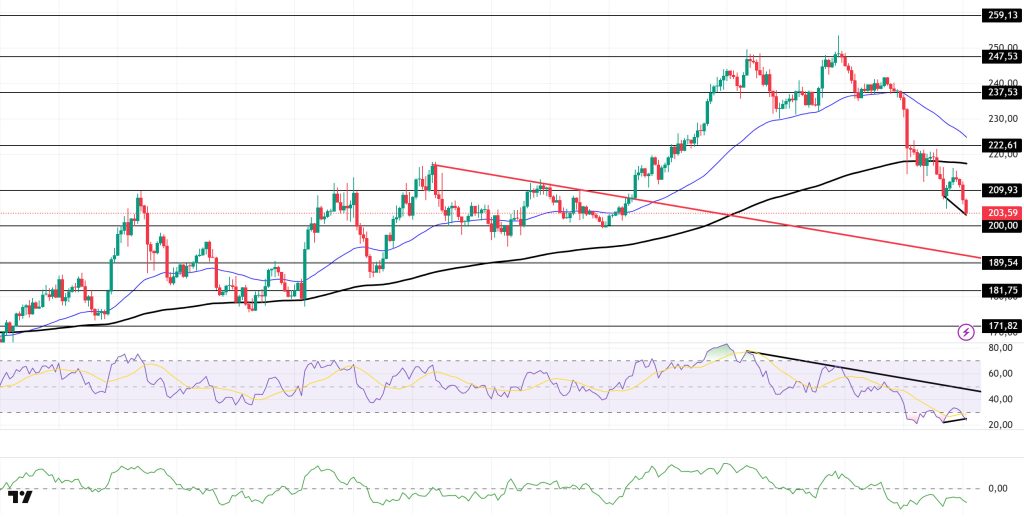
The SOL price deepened its decline. The asset remained in the upper region of the downtrend that began on August 29. Currently, the price has broken below the strong support level of $209.93. If the pullback continues, it may test the downtrend as support. If the price closes above the 200 EMA, the $222.61 level can be monitored.
On the 4-hour chart, it continued to trade above the 50 EMA (Exponential Moving Average – Blue Line) and 200 EMA (Black Line). This indicates that the medium-term upward trend may continue. At the same time, the price being below both moving averages shows us that the market is in a downward trend in the short term. The Chaikin Money Flow (CMF-20) remained in negative territory. However, an increase in money inflows could push the CMF into positive territory. The Relative Strength Index (RSI-14) remained in oversold territory. This could lead to minor corrections. At the same time, it continued to remain below the downward trend that began on September 14, indicating that selling pressure continues. However, there is upward divergence. If there is an upturn due to macroeconomic data or positive news related to the Solana ecosystem, the $222.61 level stands out as a strong resistance point. If this level is broken upward, the rise is expected to continue. If pullbacks occur due to developments in the opposite direction or profit-taking, the $200.00 level may be tested. A decline to these support levels could increase buying momentum, presenting a potential upside opportunity.
Support levels: 200.00 – 189.54 – 181.75
Resistance levels: 209.93 – 222.61 – 237.53
DOGE/USDT
The director of the Dogecoin Foundation stated that it is time to create tools to take the usability of Dogecoin for traders to the next level.
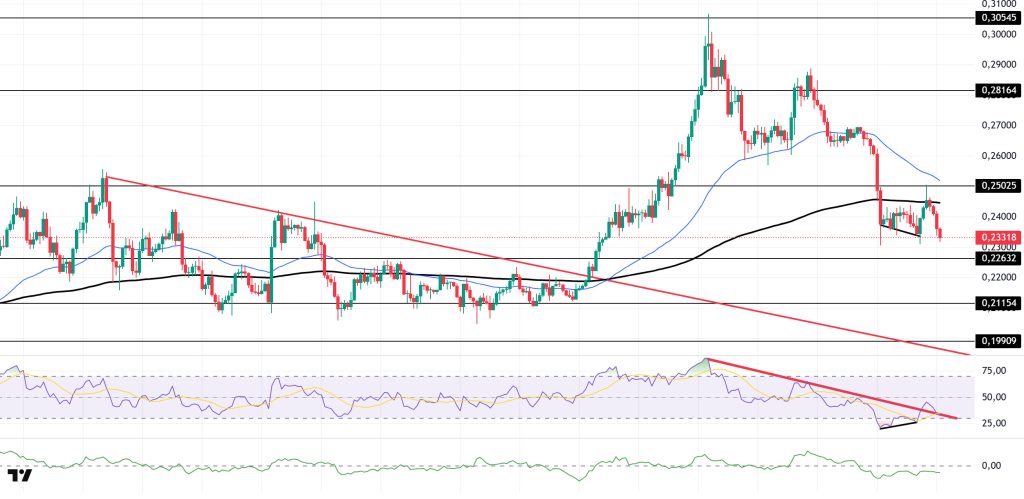
The DOGE price continued its pullback. The asset remained above the downward trend that began on August 14. Testing the strong support level of $0.25025 as resistance, the price failed to break through and pulled back, moving below the 200 EMA (Exponential Moving Average – Black Line) moving average. Currently preparing to test the $0.22632 level as support, the price may test the downward trend as support in the event of candle closes below this level. If rallies begin, it may track the $0.25025 level.
On the 4-hour chart, the 50 EMA (Exponential Moving Average – Blue Line) remained above the 200 EMA (Black Line). This indicates that the medium-term upward trend continues. However, the price being below both moving averages indicates a short-term downward trend. The Chaikin Money Flow (CMF-20) remained in negative territory. Additionally, a decrease in money inflows could push the CMF deeper into negative territory. The Relative Strength Index (RSI-14) rose from the oversold zone to the middle of the negative zone. At the same time, it is currently testing the support level of the downtrend that began on September 13. A downward break could deepen the decline. However, positive divergence could strengthen the upward movement. In the event of an upturn driven by political developments, macroeconomic data, or positive news flow in the DOGE ecosystem, the $0.28164 level stands out as a strong resistance zone. Conversely, in the event of negative news flow, the $0.21154 level could be triggered. A decline to these levels could increase momentum and initiate a new wave of growth.
Support levels: $0.22632 – $0.21154 – $0.19909
Resistance levels: 0.25025 – 0.28164 – 0.30545
Legal Notice
The investment information, comments, and recommendations contained herein do not constitute investment advice. Investment advisory services are provided individually by authorized institutions taking into account the risk and return preferences of individuals. The comments and recommendations contained herein are of a general nature. These recommendations may not be suitable for your financial situation and risk and return preferences. Therefore, making an investment decision based solely on the information contained herein may not produce results in line with your expectations.


