
Teknik Analiz
BTC/USDT
Piyasaların odağında ABD'de açıklanan enflasyon verileri vardı. Temmuz ayında ABD'de çekirdek TÜFE yıllık bazda %3,1'e yükselerek son beş ayın en yüksek seviyesine ulaştı ve %3,0 olan piyasa beklentisini aştı. Aylık bazda ise %0,2 artarak %0,3'lük beklentinin altında kaldı. ABD borsaları gün boyunca izlenecek ve vadeli trading olumlu seyredecek.
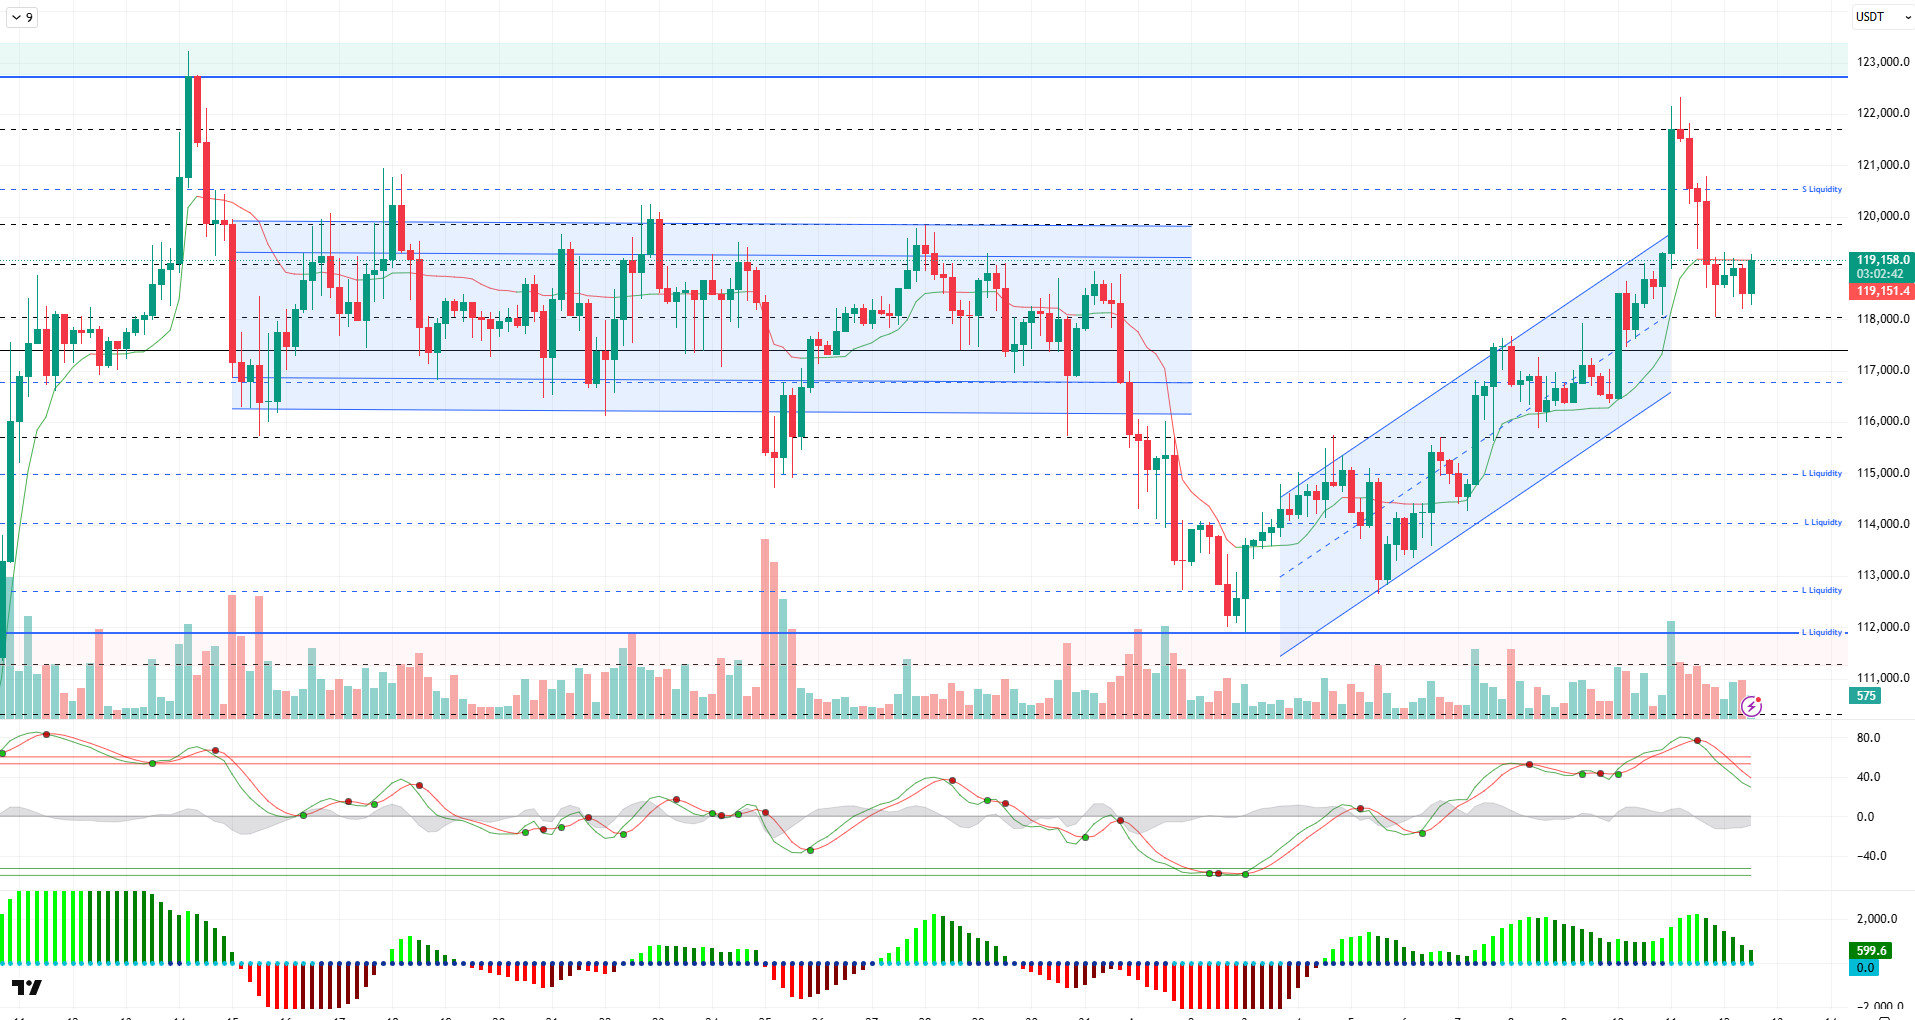
Teknik tabloya bakıldığında, bir önceki analize kıyasla gün içinde hafif bearish yaşayan BTC, 118.000 seviyesine kadar gerilemişti. Toparlanan fiyat, yazının yazıldığı sırada 119.000 seviyesine doğru ilerlemeye devam ediyor.
Teknik göstergeler Dalga Eğilimi osilatörünün (WT) aşırı alım bölgesine yakın hareket ettiğini gösteriyor ve bu da son gelişmelerin ardından yukarı doğru bir dönüşe işaret edebilir. Squeeze Momentum (SM) göstergesi pozitif momentumun zayıfladığını gösterirken, Kaufman hareketli ortalaması şu anda fiyatın hemen üzerindeki 119.150 seviyesinde direnç görevi görüyor.
Likidite verilerine bakıldığında, 115.000 seviyesinden başlayan yoğun alım pozisyonlarının önemli bir kısmı 118.000 civarında tasfiye edilirken, en yüksek birikim 115.000 seviyesinde açık kalmaya devam ediyor. Satış pozisyonları ise kısa vadede 121.000 ve 123.000 seviyelerinde birikmiş durumda.
Özetle, temel gelişmeler kısmında kurumsal alımlar olumlu sinyaller göndermeye devam ederken, Trump cephesinde sessizlik hakim. Enflasyon verisinin ardından Eylül ayında faiz indirimi beklentileri %90 seviyesine yükseldi. Teknik yapı doygunluk noktasında yeniden yükselmek için uygun zemin ararken likidite verileri 115.000'i önemli birikim bölgesi olarak göstermeye devam ediyor. Bu bağlamda teknik yapının temel gelişmelere eşlik etmesi durumunda 120.000 seviyesi ATH öncesinde direnç olarak karşımıza çıkacak ve bu seviyenin üzerinde kapanış momentum artışını tetikleyebilecektir. Olası satış baskısı durumunda ise 118.000 seviyesi destek alanı olarak izlenecek, bu seviyenin altına inilmesi 117.500 seviyesini, ardından 115.000 likidite ve referans alanını hedefleyecektir.
Destek seviyeleri: 118.000 - 117.500 - 115.000
Dirençler: 120,000 - 121,500 - 123,000
ETH/USDT
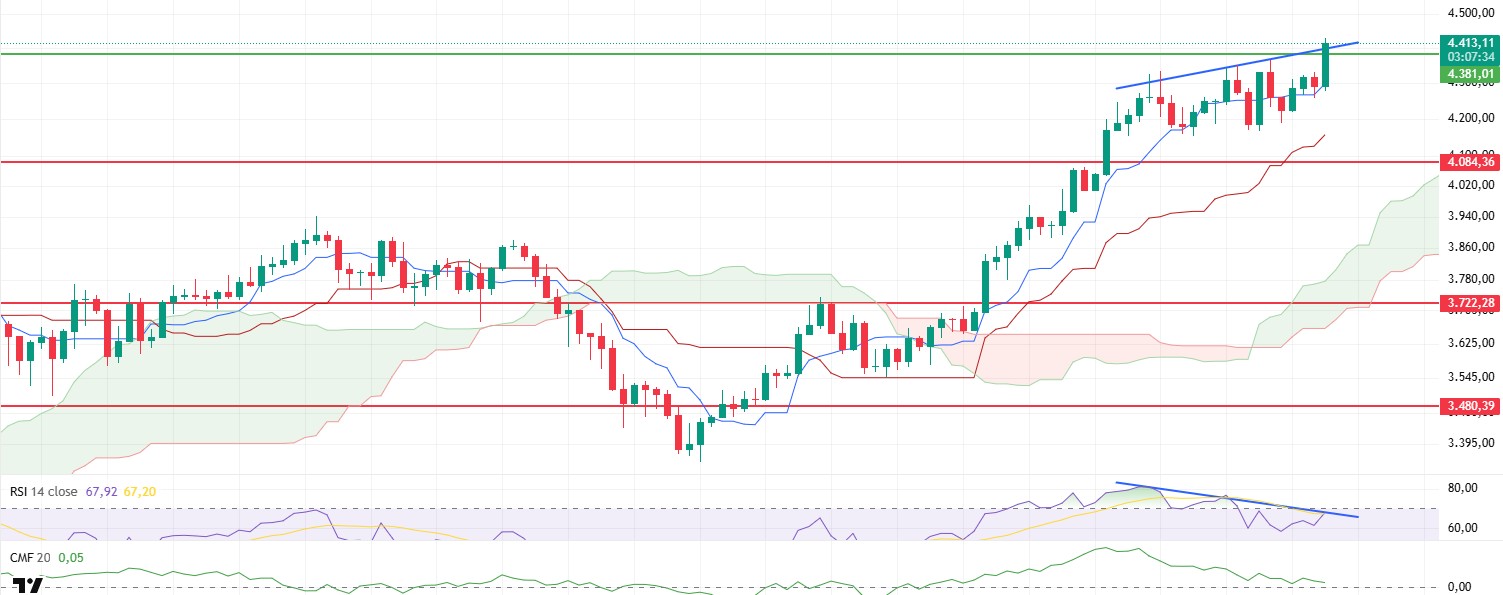
Ethereum, ABD'den gelen enflasyon verilerinin piyasa beklentilerinden iyi gelmesiyle gün içinde güçlü bir yukarı yönlü ivme kazanarak kritik direnç seviyesi olan 4.381'in üzerine çıktı. Bu seviyenin kırılmasıyla birlikte özellikle vadeli trading alım talebi hızla arttı ve trading hacminde gözle görülür bir artış yaşandı.
Teknik açıdan Chaikin Para Akışı (CMF) göstergesi sıfır çizgisine doğru gerilemeye devam ediyor. Bu hareket, piyasadan kısmi likidite çıkışlarının devam ettiğini ve kısa vadeli yatırımcıların kâr realizasyonuna doğru ilerlediğini gösteriyor. Yükselişe rağmen CMF'deki zayıflık, momentumu sağlayan sermayenin bir kısmının piyasadan çekildiğine işaret ediyor.
Ichimoku analizine bakıldığında, fiyatın Tenkan seviyesinden uzaklaşması ve yukarı doğru hareket etmesi, kısa vadede alıcıların kontrolde olduğunu gösteriyor. Kumo bulutunun yukarı yönlü eğimi de genel trendin olumlu yapısını destekliyor. Ancak bu olumlu görünüm, momentum göstergelerindeki zayıflıkla birleştiğinde dikkatle değerlendirilmesi gereken bir tablo ortaya koyuyor.
RSI aşırı alım bölgesinin üst sınırına yaklaşıyor. Daha da dikkat çekici olan, fiyat yeni zirvelere ulaşırken RSI'ın aynı oranda güçlenmemesidir. Bu negatif sapma, kısa vadede bir düzeltme riskinin hala masada olduğuna dair önemli bir uyarıdır.
Fiyat günün geri kalanında 4.381'in üzerinde kapanırsa, yükseliş trendinin artan bir ivmeyle devam etmesi muhtemeldir. Ancak, bu seviyenin altında kapanış, CMF ve RSI'daki zayıflıkla birleştiğinde, bir geri çekilme olasılığını artırır. Böyle bir senaryoda Tenkan ve ardından Kumo bulutunun alt bandı önemli destek seviyeleri olarak ortaya çıkıyor.
Destek seviyeleri: 4,084 - 3,722 - 3,646
Direnç seviyeleri: 4,381 - 4,550 - 4,857
XRP/USDT
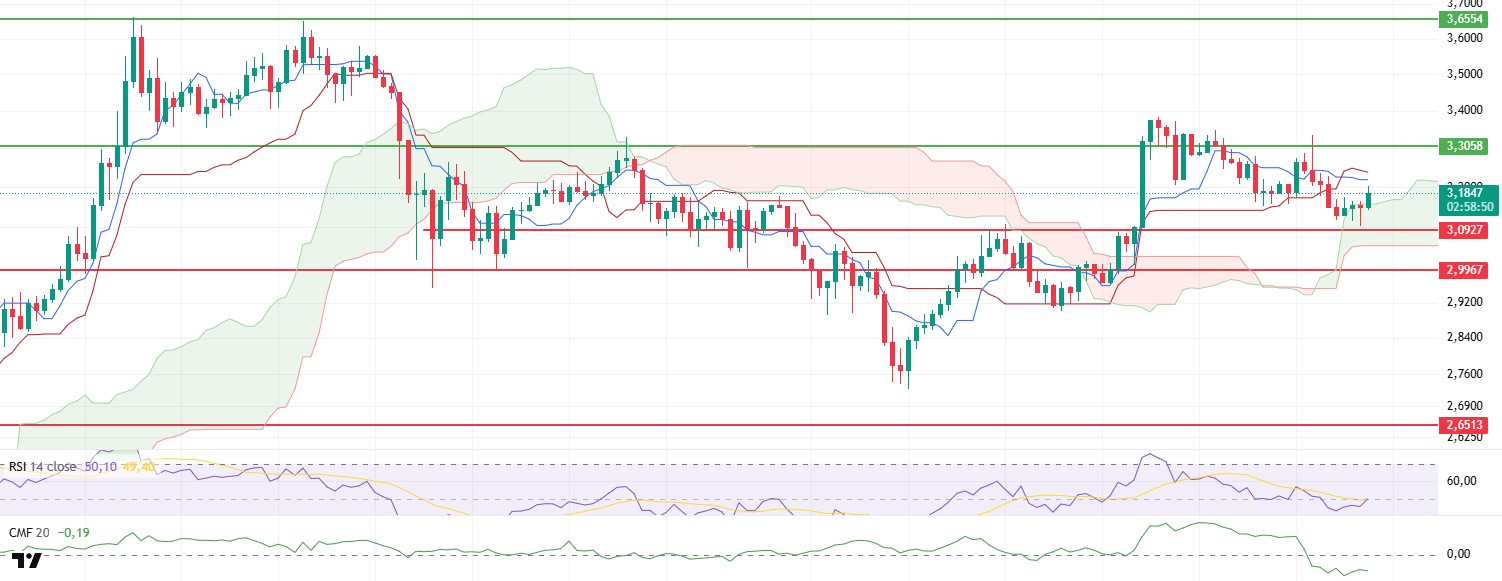
XRP gün içinde 3,09$'a kadar düştü ancak beklenenden daha iyi gelen ABD enflasyon verilerinin açıklanmasının ardından Kumo bulut seviyesinin üzerine çıktı. Bu fiyat hareketi, piyasanın kısa süreli bir satış baskısının ardından alıcı ağırlıklı bir yapıya geri döndüğünü gösteriyor.
Chaikin Para Akışı (CMF) göstergesi fiyat artışına rağmen negatif bölgede kalmaya devam ediyor. Bu durum likidite çıkışlarının devam ettiğine ve sermaye girişlerinin trading hacmi açısından sınırlı kaldığına işaret ediyor. CMF'nin aşağı yönlü eğilimi mevcut fiyat hareketi ile uyumsuzluk yaratarak alım-satım dengesi açısından nötr-negatif bir görünüm arz ediyor.
Ichimoku göstergesi incelendiğinde, fiyatın kumo bulutunun üzerinde olması genel trend yapısının pozitif kaldığını gösteriyor. Ancak fiyatın hem Kijun hem de Tenkan seviyelerinin altında olması kısa vadede yukarı yönlü momentumu sınırlayan bir faktör olarak öne çıkıyor. Tenkan'ın Kijun'un altından geçmesiyle oluşan satış sinyali de kısa vadeli görünümde zayıflamaya işaret ediyor.
Günlük kapanış perspektifinden bakıldığında, 3,22 dolar seviyesinin üzerindeki fiyat hareketleri kısa vadeli teknik yapının farklı bir senaryoya evrilmesinin önünü açabilirken, bu seviyenin altında kalınması 3,09 dolar destek seviyesinin yeniden test edilmesi riskini canlı tutuyor.
Destekler: 3.0927 - 2.9967 - 2.7355
Direnç seviyeleri: 3,3058 - 3,6554 - 4,0055
SOL/USDT
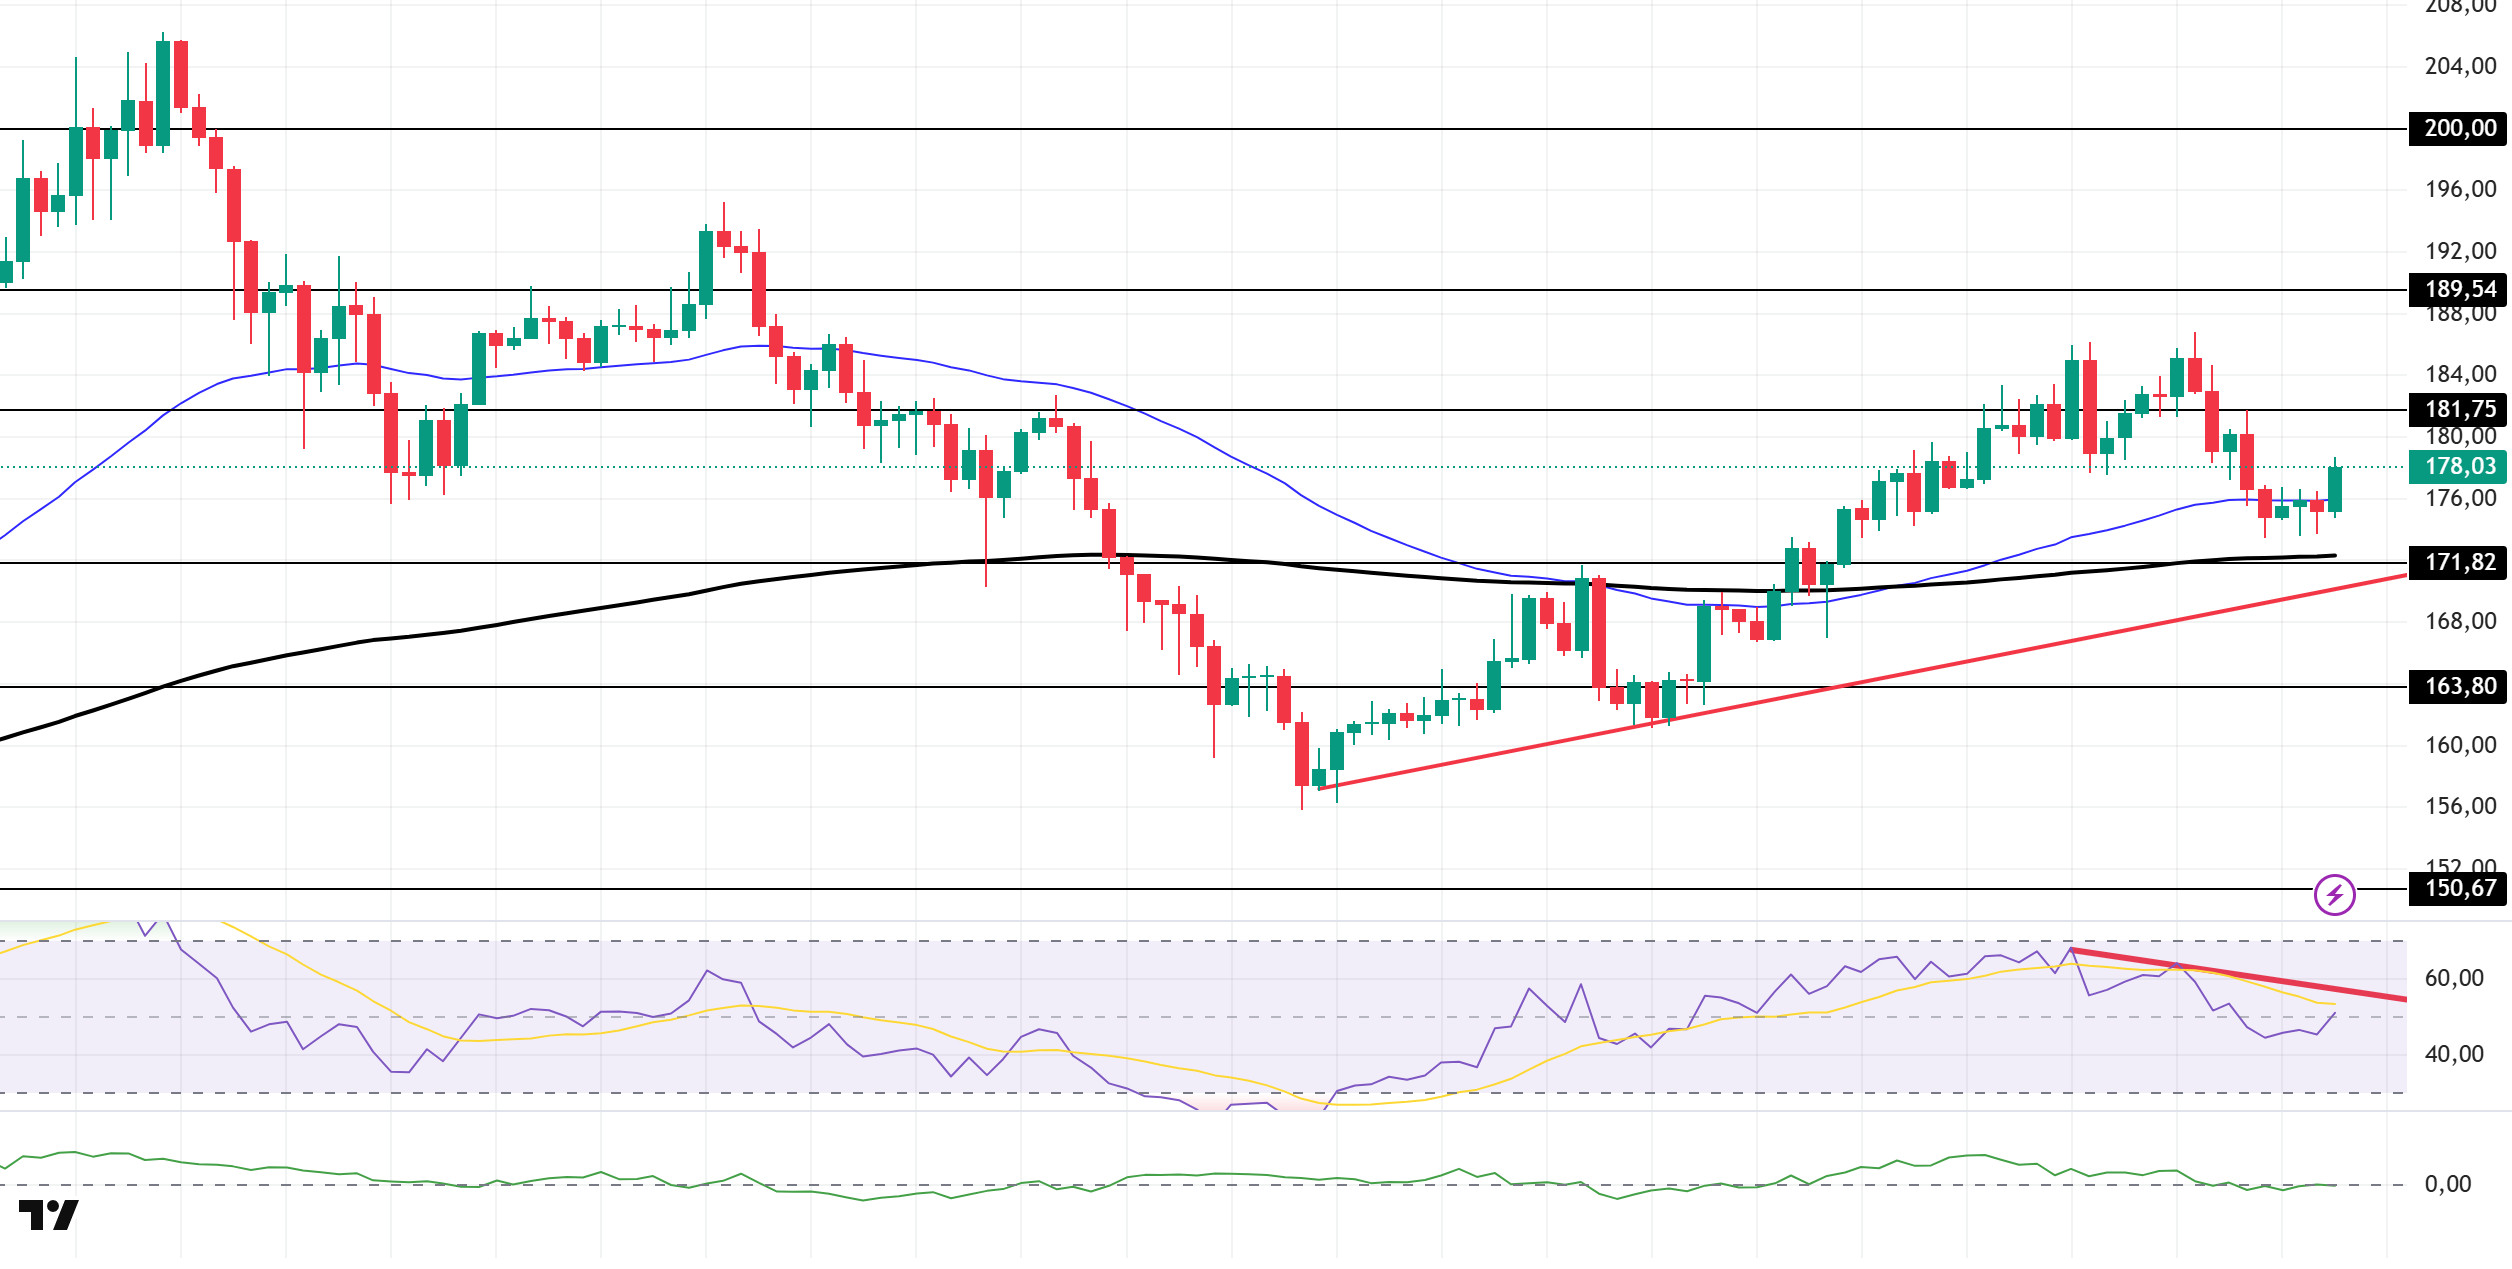
SOL fiyatı gün boyunca yatay seyretti. Varlık, 2 Ağustos'ta başlayan yükseliş trend çizgisinin üzerinde kalmaya devam etti. 181,75 $ ana seviyesinin altında kalan fiyat, şu anda direnç olarak 50 EMA (Mavi Çizgi) hareketli ortalamasını test ediyor. Düşüş trendi devam ederse 171,82 dolar seviyesini test edebilir. Yukarı yönde ise 181,75 dolar seviyesi izlenmeye değer.
4 saatlik grafikte, 50 EMA (Mavi Çizgi) 200 EMA'nın (Siyah Çizgi) üzerinde kalmaktadır. Bu da yükseliş eğiliminin orta vadede devam edebileceğini gösteriyor. Aynı zamanda, fiyatın iki hareketli ortalama arasında olması, piyasanın şu anda bir karar aşamasında olduğunu gösteriyor. Chaikin Para Akışı (CMF-20) nötr bir seviyede. Ancak, para girişlerindeki bir artış CMF'yi pozitif bölgeye itebilir. Göreceli Güç Endeksi (RSI-14) 10 Ağustos'ta başlayan düşüş eğiliminin altında kalmaya devam ediyor. Bu durum satış baskısının devam ettiğine işaret ediyor. Makroekonomik veriler veya Solana ekosistemiyle ilgili olumlu haberler nedeniyle yukarı yönlü bir hareket olması durumunda, $181,75 seviyesi güçlü bir direnç noktası olarak ortaya çıkıyor. Bu seviyenin yukarı yönde kırılması halinde yükseliş eğiliminin devam etmesi bekleniyor. Olumsuz gelişmeler ya da kâr alımı nedeniyle bir geri çekilme yaşanması durumunda ise 171,82 dolar seviyesi test edilebilir. Bu destek seviyelerine doğru bir gerileme, alım momentumunda bir artış görerek yukarı yönlü bir hareket için potansiyel bir fırsat sunabilir.
Destek seviyeleri: 171,82 - 163,80 - 150,67
Direnç Seviyeleri: 181,75 - 189,54 - 200,00
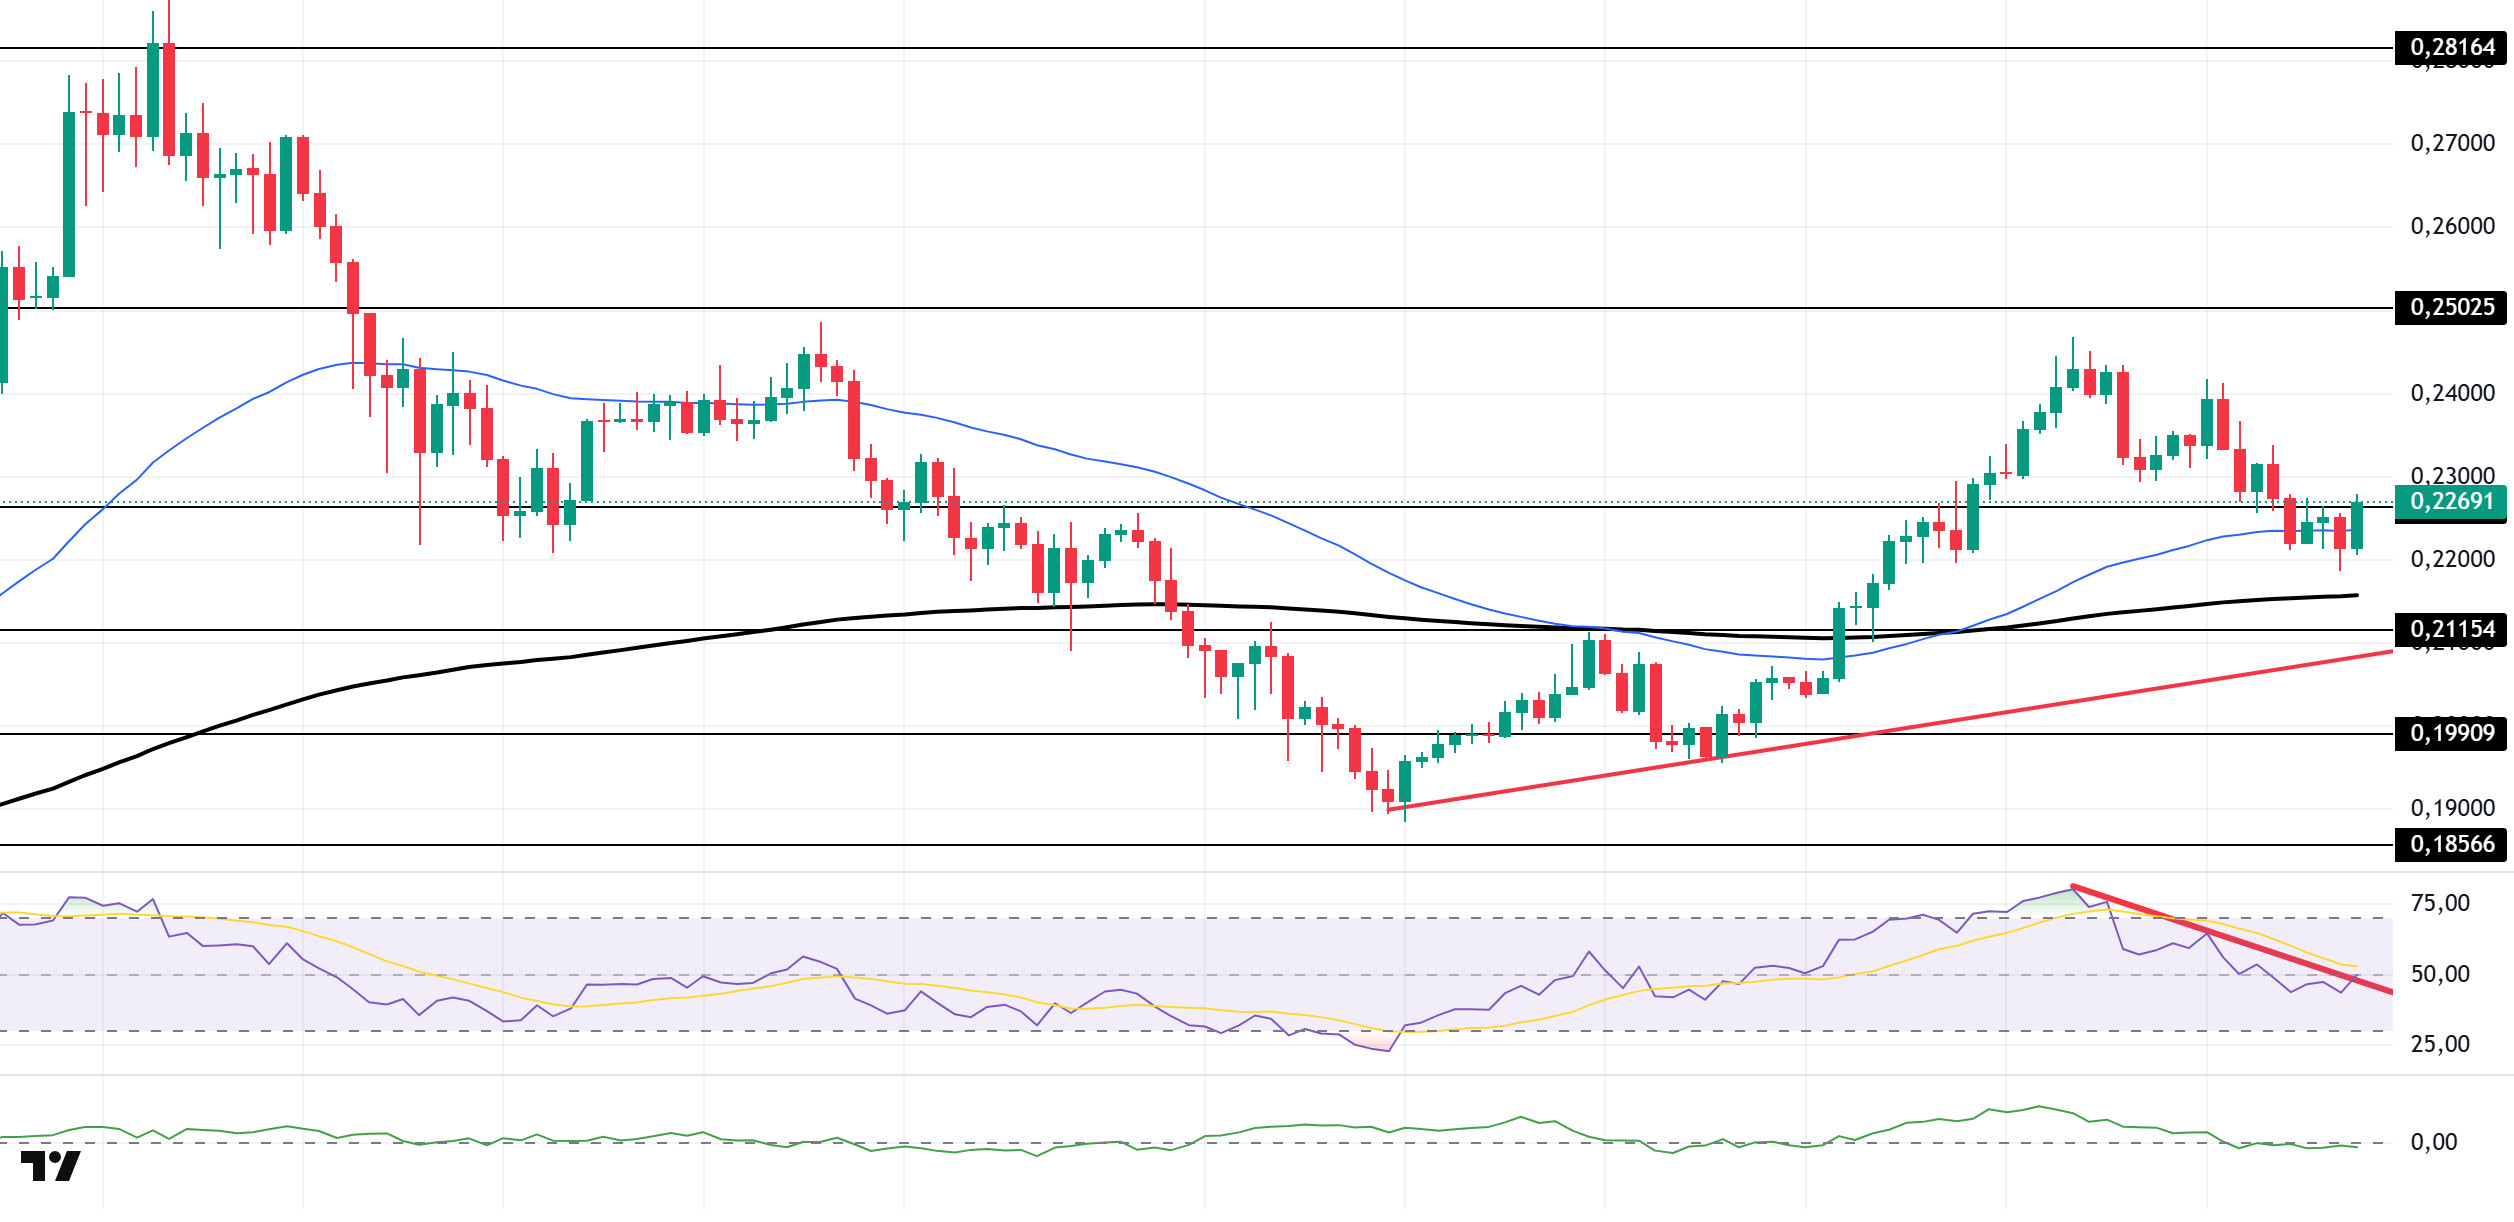
DOGE/USDT
DOGE fiyatı gün boyunca yatay seyretti. Varlık, 2 Ağustos'ta başlayan yükseliş trendinin üzerinde trade görmeye devam etti. Ancak, fiyat 0,22632 $ 'lık güçlü destek seviyesinin altına düştü ve düşüşünü sürdürdü. Şu an itibariyle, bu seviyeyi ve 50 EMA (Mavi Çizgi) hareketli ortalamasını direnç olarak test ediyor. Fiyat 0,22632 $ 'ın üzerinde kapanırsa, 0,25025 $ seviyesi izlenebilir.
4 saatlik grafikte, 50 EMA (Mavi Çizgi) 200 EMA'nın (Siyah Çizgi) üzerinde kalmaktadır. Bu, varlığın orta vadede yükseliş eğiliminde olduğunu gösterir. Fiyatın iki hareketli ortalama arasında olması da varlığın kısa vadede bir karar verme aşamasında olduğunu gösterir. Chaikin Para Akışı (CMF-20) negatif bölgede kalmaya devam ediyor. Ek olarak, negatif nakit girişleri CMF'yi negatif bölgeye daha da itebilir. Göreceli Güç Endeksi (RSI-14) nötr bir seviyede bulunuyor. Bu arada, 9 Ağustos'ta başlayan düşüş trendinin altına inmeye başlayan gösterge şu anda bu trendi direnç olarak test ediyor. Bu seviyenin üzerine çıkılması bir yükseliş trendinin başlangıcına işaret edebilir. Siyasi gelişmeler, makroekonomik veriler ya da DOGE ekosistemi içindeki olumlu haber akışı kaynaklı yukarı yönlü bir hareket durumunda 0,25025 dolar seviyesi güçlü bir direnç bölgesi olarak karşımıza çıkıyor. Tersi senaryoda ya da olumsuz haber akışı durumunda ise 0,21154 dolar seviyesi tetiklenebilir. Bu seviyelere doğru bir düşüş momentumu artırabilir ve potansiyel olarak yeni bir yükseliş dalgası başlatabilir.
Destek seviyeleri: 0,21154 - 0,19909 - 0,18566
Dirençler: 0.22632 - 0.25025 - 0.28164
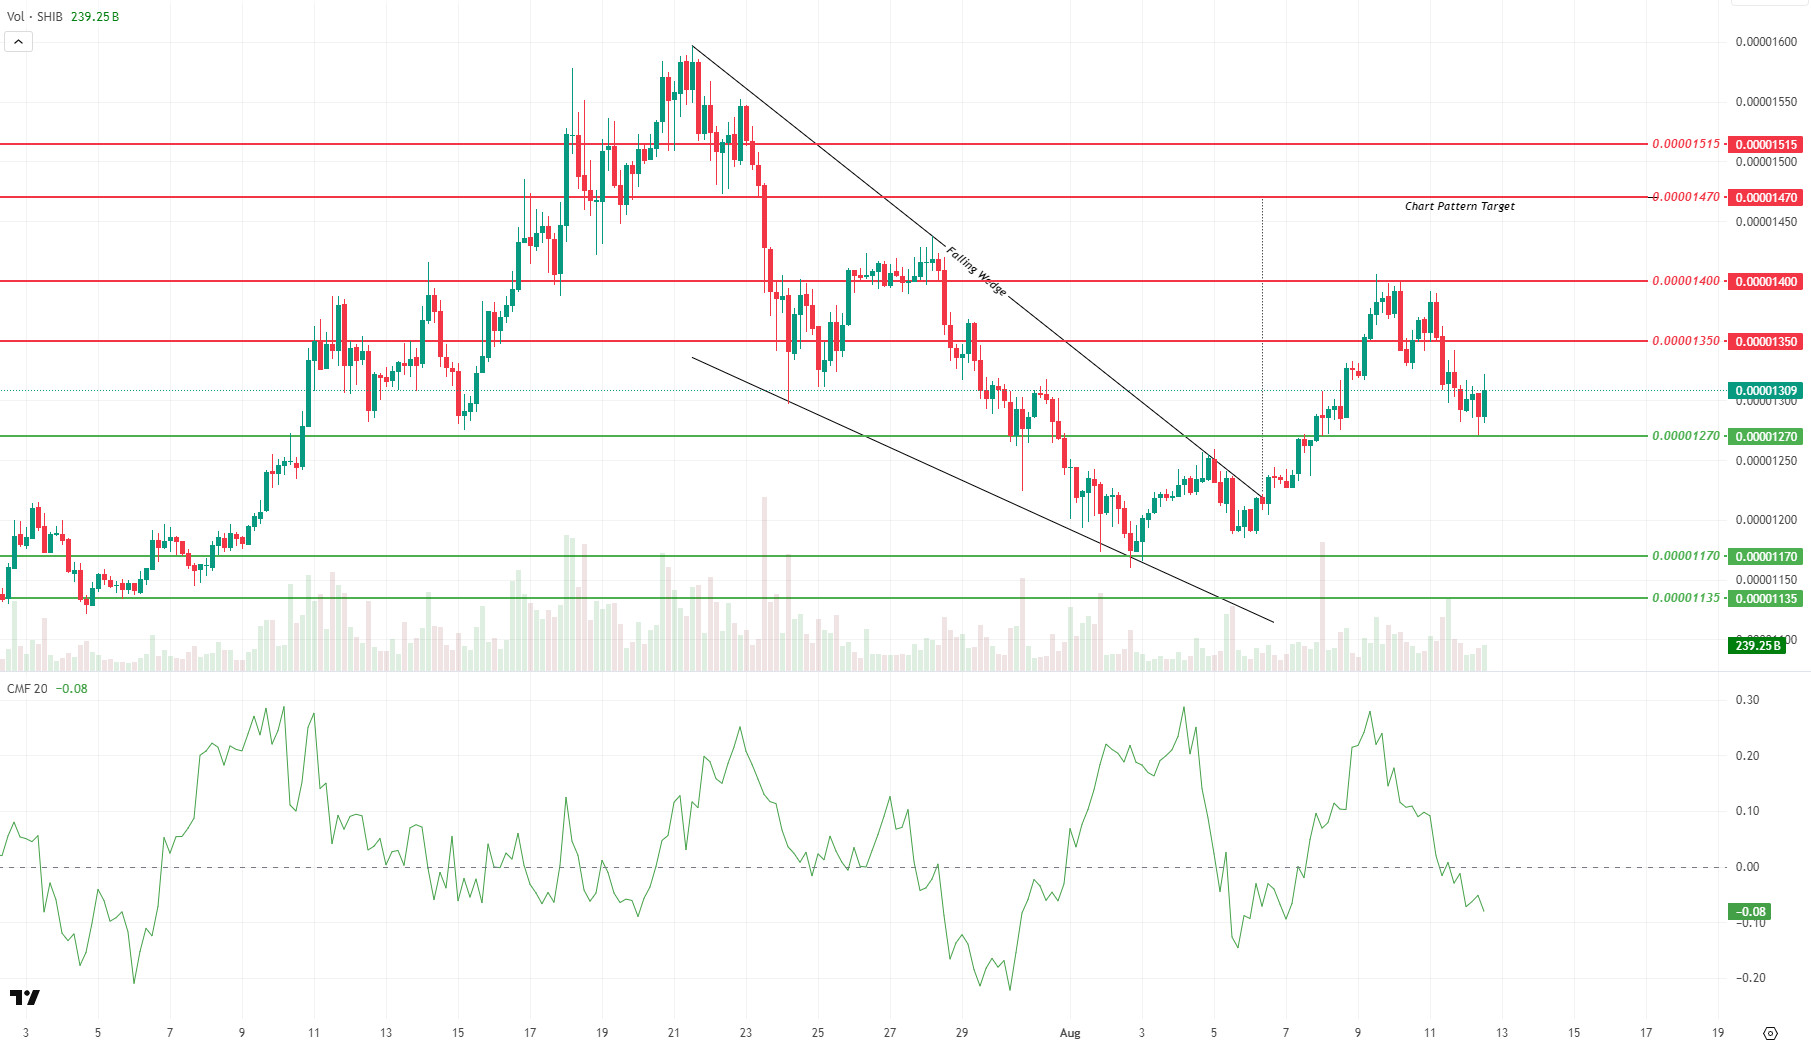
SHIB/USDT
ABD enflasyon verilerinin ardından SHIB fiyatı kabaca %2'lik bir toparlanma kaydetti. Gün içi geri çekilmeler sırasında 0,00001270$ seviyesi test edildi ve alım aktivitesi nedeniyle fiyat bu noktadan yukarı doğru toparlandı. Bu seviyenin gün içinde tutulması, alıcıların kısa vadede hala aktif olduğunu gösteriyor. Toparlanmaya rağmen fiyat 0.00001320-0.00001350 dolar aralığında sınırlı kaldı ve bu bölgenin üzerinde sürdürülebilirlik henüz sağlanamadı.
Yukarı yönlü hareketin sınırlı kalmasında toparlanma sürecinde trading hacminin beklenen ölçüde artmaması etkili oldu. Günlük hacim verileri alıcıların hareketin devamı konusunda temkinli olduğuna işaret ediyor. Chaikin Para Akışı (CMF) göstergesinin -0,08 seviyesinde ve negatif bölgede olması sermaye akımlarının ağırlıklı olarak satış yönünde olduğunu teyit ediyor.
Kısa vadede 0,00001350 dolar seviyesi ilk ara direnç seviyesi olarak öne çıkıyor. Bu seviyenin üzerinde hacim destekli kapanışlar görülürse, 0,00001390-0,00001400 dolar aralığına doğru bir hareket ortaya çıkabilir. Bu bandın kırılması halinde ise 0,00001470 dolar seviyesindeki formasyon hedefi yeniden gündeme gelecektir.
Aşağıda, 0,00001270 dolar seviyesi kritik bir destek olarak hareket etmeye devam ediyor. Bu seviyenin altındaki kapanışlar satış baskısını artırarak 0,00001170 ve 0,00001135 dolar destek bölgelerinin test edilmesinin önünü açabilir. Mevcut teknik yapı, kısa vadede yönü belirlemek için 0,00001350 dolar seviyesinin üzerinde bir fiyata ya da 0,00001270 dolar seviyesinin altında net bir kırılmaya ihtiyaç olduğunu gösteriyor. Temmuz 21'den bu yana oluşan Falling Wedge formasyonunun 6 Ağustos'ta kırılmasıyla başlayan yükseliş trendi, teknik görünümün orta vadeli temelini oluşturmaya devam ediyor.
Destek seviyeleri: 0.00001270 - 0.00001170 - 0.00001135
Direnç seviyeleri: 0.00001350 - 0.00001400 - 0.00001470
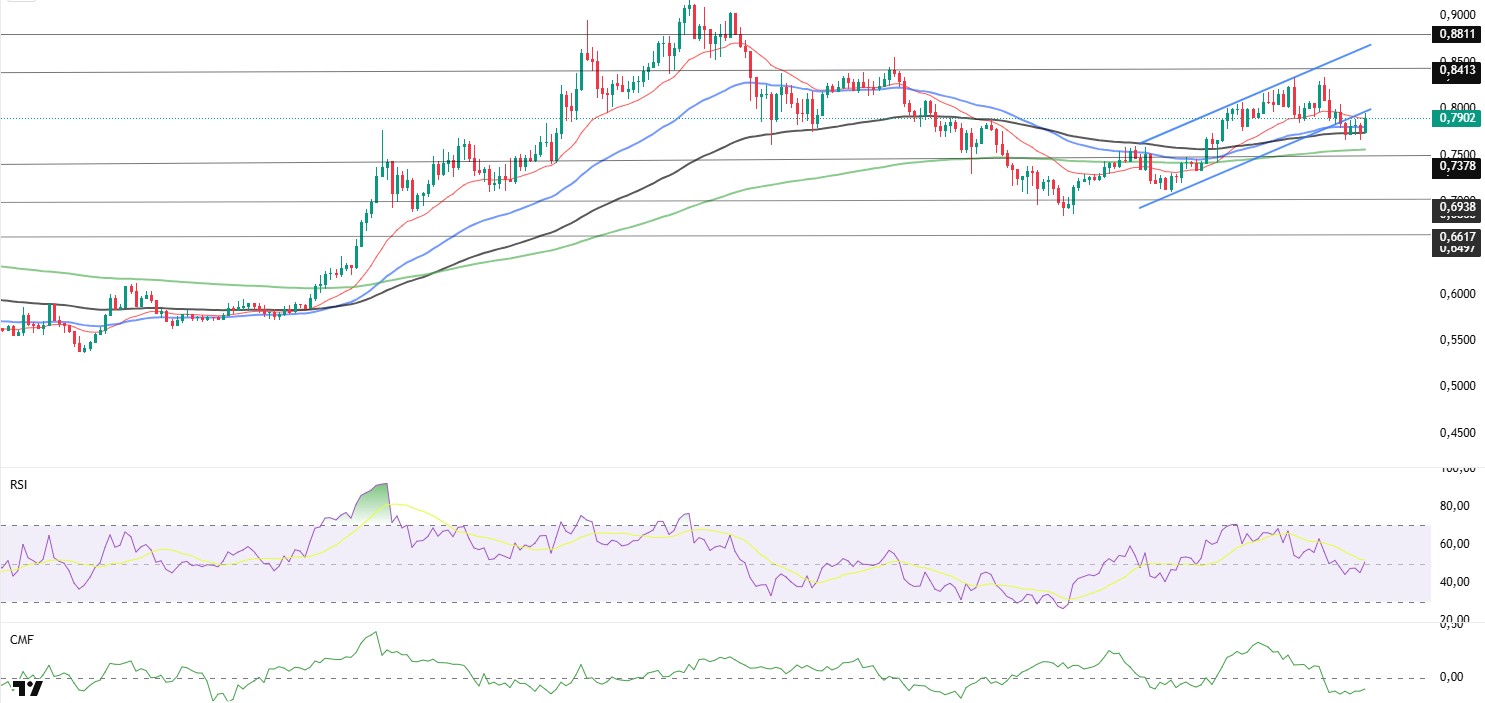
ADA/USDT
ADA gün içinde yukarı yönlü hareketini sürdürerek makroekonomik gelişmeler doğrultusunda EMA 100 (Siyah Çizgi) 0,7663 seviyesinde sabit kaldı. Piyasanın odağında ABD enflasyon verilerinin açıklanması vardı. Aylık TÜFE verisinin beklentilerin altında gelmesi, faiz indirimi olasılığını güçlendirdi ve kripto piyasalarında kazançları artırdı. ABD borsalarının gün boyunca yükselmeye devam etmesi halinde ADA'nın yeniden yukarı yönlü kanal bandına girmesi bekleniyor.
Fiyat, 4 saatlik grafikte 50 ve 100 günlük Üstel Hareketli Ortalama (EMA-Mavi Çizgi) ve (EMA-Siyah Çizgi) üzerinde kapanma isteği göstermeye devam ediyor. Fiyat gün içinde yükselir ve 20 günlük EMA'nın (Kırmızı Çizgi) üzerine çıkarsa, yükselen kanal bandına yeniden girebilir ve 0,8413'teki direnç seviyesi izlenecek önemli bir seviye olarak ortaya çıkabilir. Bu durum, yükseliş eğiliminin orta vadede devam edebileceğine işaret edebilir. Volatilitenin daralması, piyasanın kısa vadede temkinli ve bekle-gör modunda olduğunu teyit ediyor. Fiyatın gün içinde tüm hareketli ortalamaların altına düşmesi, düşüş eğiliminin devam edebileceğine işaret edebilir. Göreceli Güç Endeksi (RSI-14) 51 seviyesine düşerek Chaikin Para Akışı (CMF-20) ile birlikte aşağı yönlü bir sinyal verdi. Sermaye girişlerindeki azalma CMF'yi negatif bölgede tutabilir ve satış baskısının devam edebileceğine işaret edebilir.
Olumlu makroekonomik veriler veya Cardano ekosistemiyle ilgili olumlu haberlerin etkisiyle yukarı yönlü bir hareket olması durumunda, 0,8811$ seviyesi güçlü bir direnç noktası olarak ortaya çıkıyor. Bu seviyenin yukarı yönlü kırılması halinde, daha fazla yukarı yönlü hareket beklenmektedir. Olumsuz gelişmeler veya kâr elde etme durumunda, 0,7378 dolar seviyesini test eden bir geri çekilme meydana gelebilir. Bu destek seviyelerine doğru bir gerileme, alım momentumunda bir artışa neden olabilir ve potansiyel olarak yukarı yönlü bir hareket için fırsat sunabilir.
Destekler 0,7378 - 0,6938 - 0,6617
Direnç seviyeleri 0,8413 - 0,8811 - 0,9038
Yasal Uyarı
Burada yer alan yatırım bilgi, yorum ve tavsiyeleri yatırım danışmanlığı kapsamında değildir. Yatırım danışmanlığı hizmetleri, kişilerin risk ve getiri tercihleri dikkate alınarak yetkili kuruluşlar tarafından bireysel olarak verilmektedir. Burada yer alan yorum ve tavsiyeler genel niteliktedir. Bu tavsiyeler mali durumunuz ile risk ve getiri tercihlerinize uygun olmayabilir. Bu nedenle, sadece burada yer alan bilgilere dayanarak yatırım kararı vermeniz beklentileriniz doğrultusunda sonuç vermeyebilir.