
Technical Analysis
BTC/USDT
While the economic and political agenda in the US remained busy, Trump’s messages regarding new steps in trade with China, support for farmers, and the inflation outlook stood out; at the same time, it was reported that Nvidia’s export of certain artificial intelligence chips to China had been approved under certain conditions. On the Fed front, the probability of a December rate cut rose above 87%, while it was announced that the October PPI release had been postponed to January 2026 due to data delays. Hassett’s comments on monetary policy drew attention, while the Supreme Court continued to evaluate its approach to Trump’s attempts to expand his authority. On the global front, it was announced that progress in Russia-Ukraine peace talks remained limited and that Japan clarified its restrictions on crypto ETF derivatives.
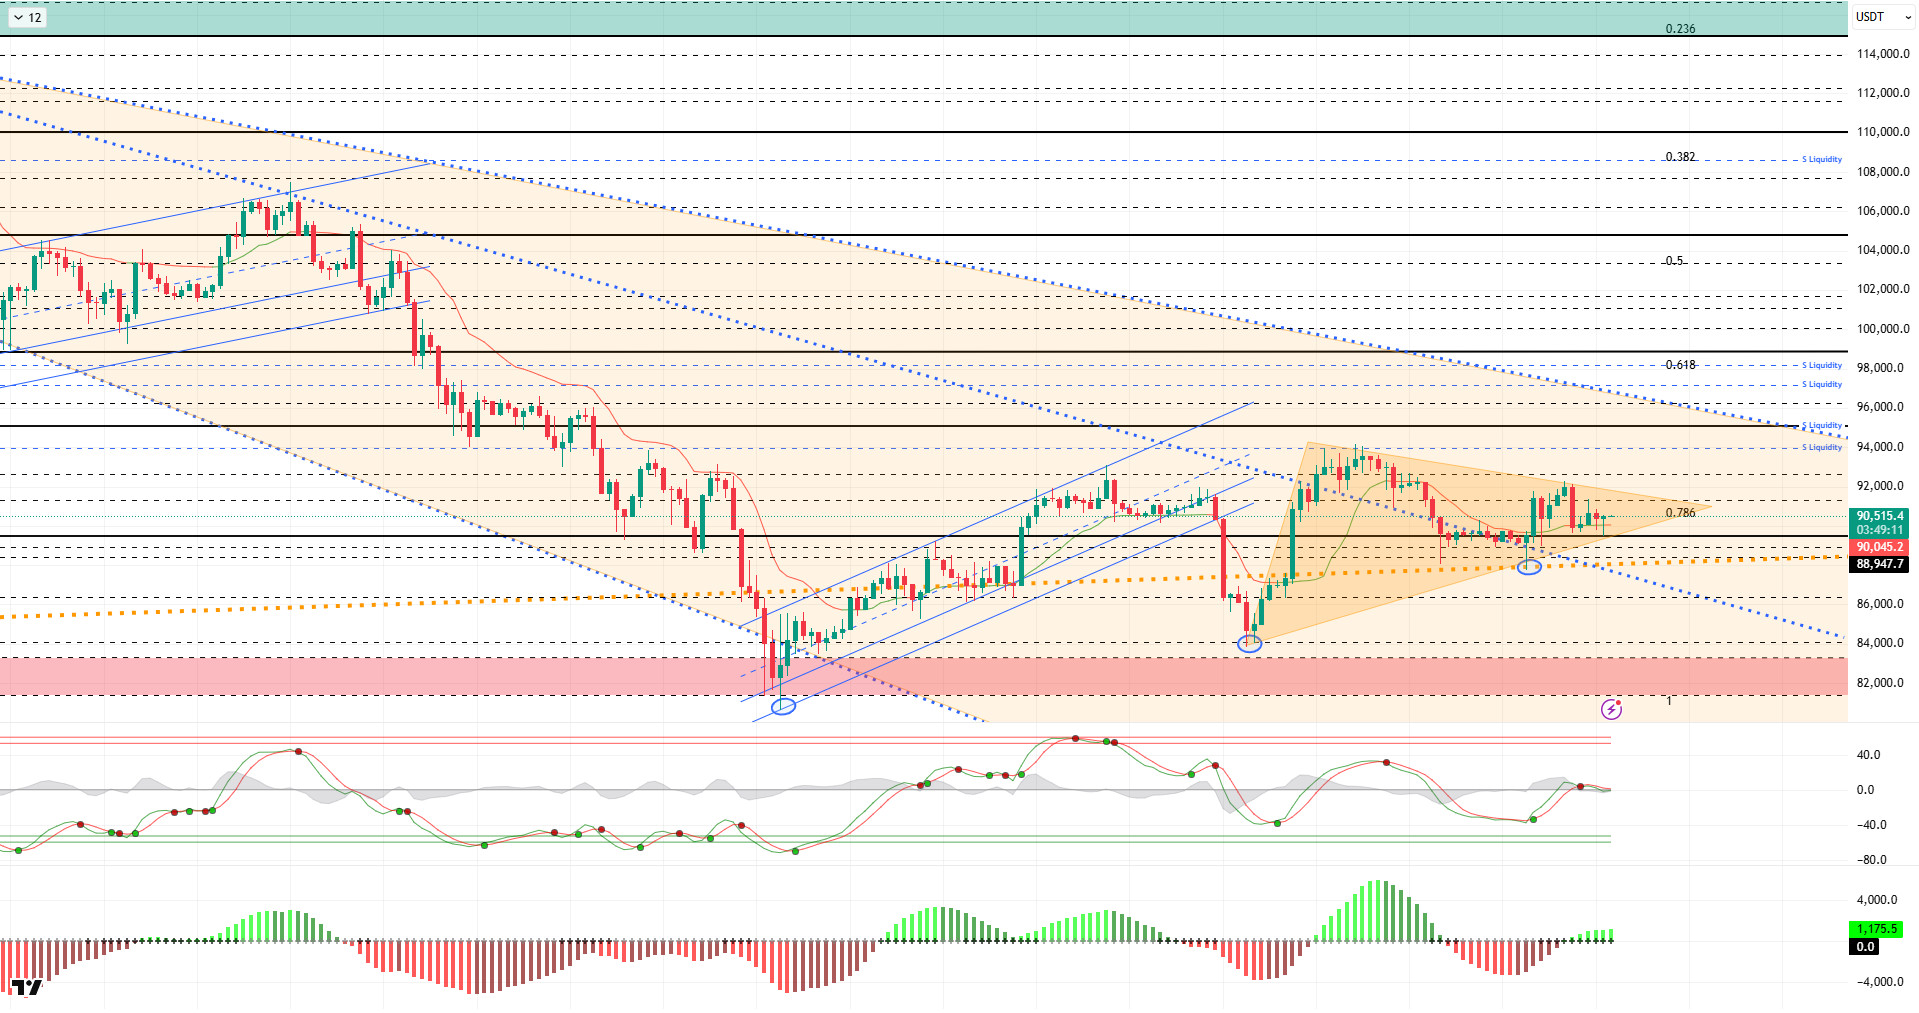
From a technical perspective, BTC continues to hold above the second descending trend line within the orange band. Although it occasionally tests the 90,000 level and lower bands that we monitor as a reference, the price manages to rise above this level each time. The price structure, which forms higher lows and lower highs, points to a clear symmetrical triangle squeeze in BTC. The direction of this squeeze’s breakout will be critical for the continuation of the trend. Monitoring breakout levels, especially with a high-volume breakout, is of great importance for confirming the direction.
Technical indicators show the Wave Trend (WT) oscillator in an indecisive state around the channel’s middle band, while the histogram on the Squeeze Momentum (SM) indicator has returned to positive territory. The Kaufman Moving Average (KAMA) is currently just below the price level at $90,000.
According to liquidation data, the recent decline resulted in liquidation of accumulated trades in the 90,000–88,000 range. Sell-side transactions are intensifying in the short term at the 92,000 – 94,500 level, while in the monthly view, they continue to maintain their intensity within the 97,000 – 98,000 band.
In summary, while Trump’s new steps in relations with China remain on the global agenda, the markets’ main focus has shifted to tomorrow’s Fed interest rate decision and Powell’s message regarding forward-looking projections. On the technical side, BTC, which tested the bottom of the downtrend that began after the ATH, continues to search for direction, forming a symmetrical triangle pattern stuck above the 90,000 level. Liquidity data shows that target zones are regaining importance and the market is finding equilibrium.After this stage, 90,000 has become a critical point again for the price to maintain its momentum. Closings and pricing above this level are an important indicator for regaining momentum. In this context, 95,000 stands out as the next target area, and if it is passed, liquidity areas will be tracked again. In the event of potential selling pressure, 90,000 re-emerges as a reference area; if broken, the 87,500 level, where the major uptrend passed, will be monitored.
Supports: 90,000 – 89,000 – 87,800
Resistances: 91,400 – 92,600 – 94,000
ETH/USDT
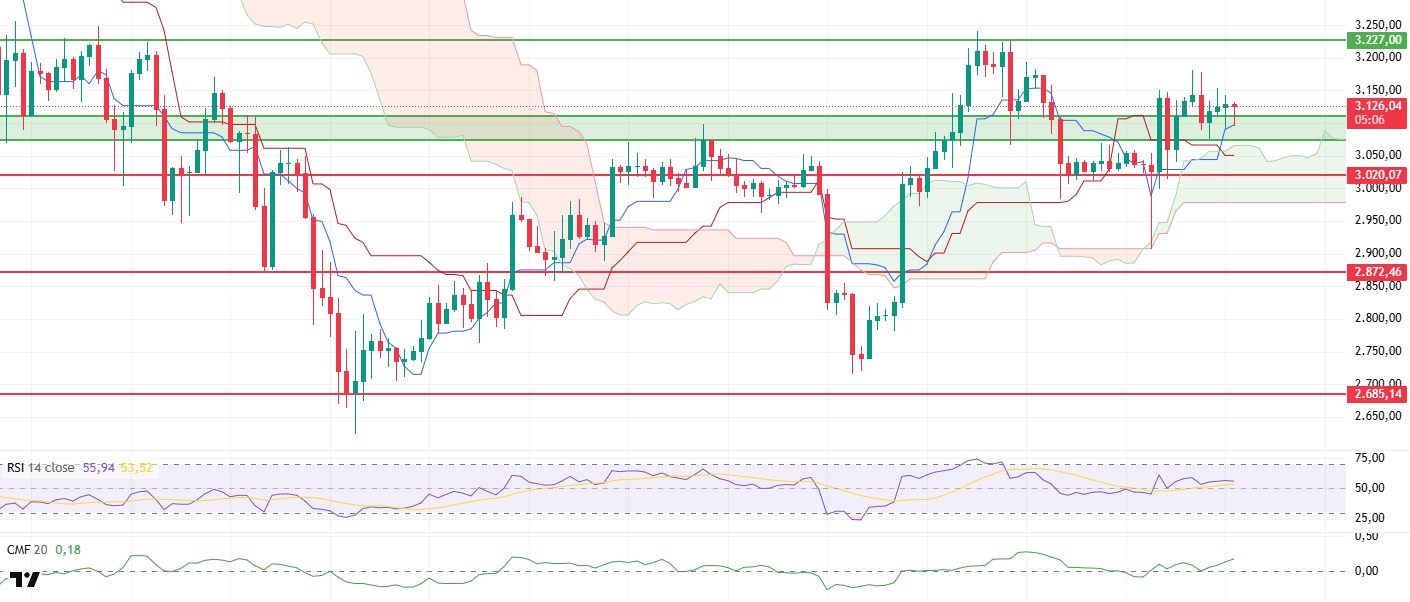
The Ethereum price touched the $3,070 support level during yesterday evening’s pullback, but as sellers failed to break this level, buyers regained strength in the morning hours and the price recovered towards the $3,125 level. Despite short-term pressure, the price managed to hold above critical support levels, indicating that buyers have not withdrawn from the market and that the bullish scenario remains valid.
The strong liquidity outlook is maintained. Chaikin Money Flow (CMF) continues its positive trend, indicating that capital inflows into the market are sustained. It can be said that the necessary liquidity for testing resistance levels remains intact.
On the momentum side, the Relative Strength Index (RSI) continues its upward trend, confirming that buyers still hold the upper hand. Moving away from the overbought zone creates room for the price to regain momentum.
The technical structure remains positive on the Ichimoku side. The price is trading above the cloud, and the Tenkan and Kijun lines continue to support the price. This technical positioning indicates that the uptrend remains intact.
The observed decline in the funding rate is also significant. The decrease in the cost of short-term long positions creates a healthy foundation that increases the likelihood of the price testing resistance levels. The reduction in overheating suggests that the movement could progress in a more sustainable manner.
The outlook for Ethereum remains strong. During the day, it may target the $3,150 level again, followed by a move towards the $3,227 resistance level. If this level is breached, the uptrend is likely to become more aggressive, expanding towards the $3,285–$3,350 range. In a downward scenario, $3,070 is still being monitored as the most important support point, and as long as it remains above this level, the positive trend appears to be maintained.
Below the Form
Supports: 3,070 – 3,020 – 2,872
Resistances: 3,227 – 3,436 – 3,672
XRP/USDT
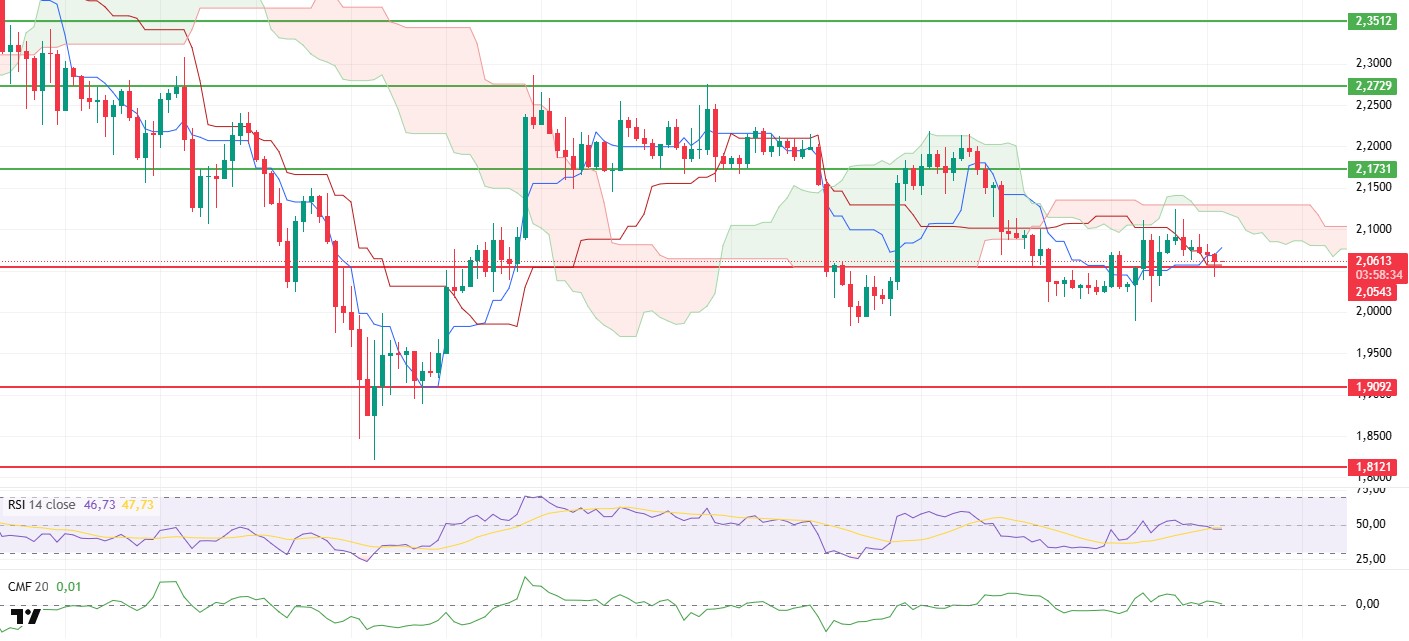
XRP fell below the $2.05 support level yesterday evening amid selling pressure, but buyers stepped in as sellers failed to follow through, and the price rebounded towards the $2.06 level. However, the weak movement indicates that there has been no clear change in market direction.
Chaikin Money Flow (CMF) continues to remain in positive territory, indicating that capital continues to enter the market even at low levels. While this stance on the liquidity side shows that buyers are not completely out of the picture, it is not enough on its own to push prices higher.
Weakness has become apparent on the momentum side. The Relative Strength Index (RSI) has fallen below the 50 level, returning to seller-dominated territory and revealing that efforts to gain strength have yet to bear fruit. The RSI’s current position indicates that upward movements may remain limited in the short term.
The Ichimoku cloud continues to exert downward pressure. The price trading below both the Tenkan and Kijun levels and the cloud structure moving away clearly indicate that negative pressure still dominates the short-term trend. Pricing below the cloud signals that the search for direction continues to favor sellers.
The price is currently in a critical equilibrium range. If the $2.05 level holds, short-term rebound rallies could push the price back toward the $2.10 region. However, if the price closes below $2.05, the selling pressure could intensify, increasing the likelihood of a pullback toward the $1.98–$1.95 support band. The direction of XRP appears to be entirely dependent on the outcome of the battle around this critical support level. For buyers to gather strength from their current weak position, liquidity support must continue, and the price must rise above at least the Tenkan level.
Supports: 2.0543 – 1.9092 – 1.8121
Resistances: 2.1731 – 2.2729 – 2.3512
SOL/USDT
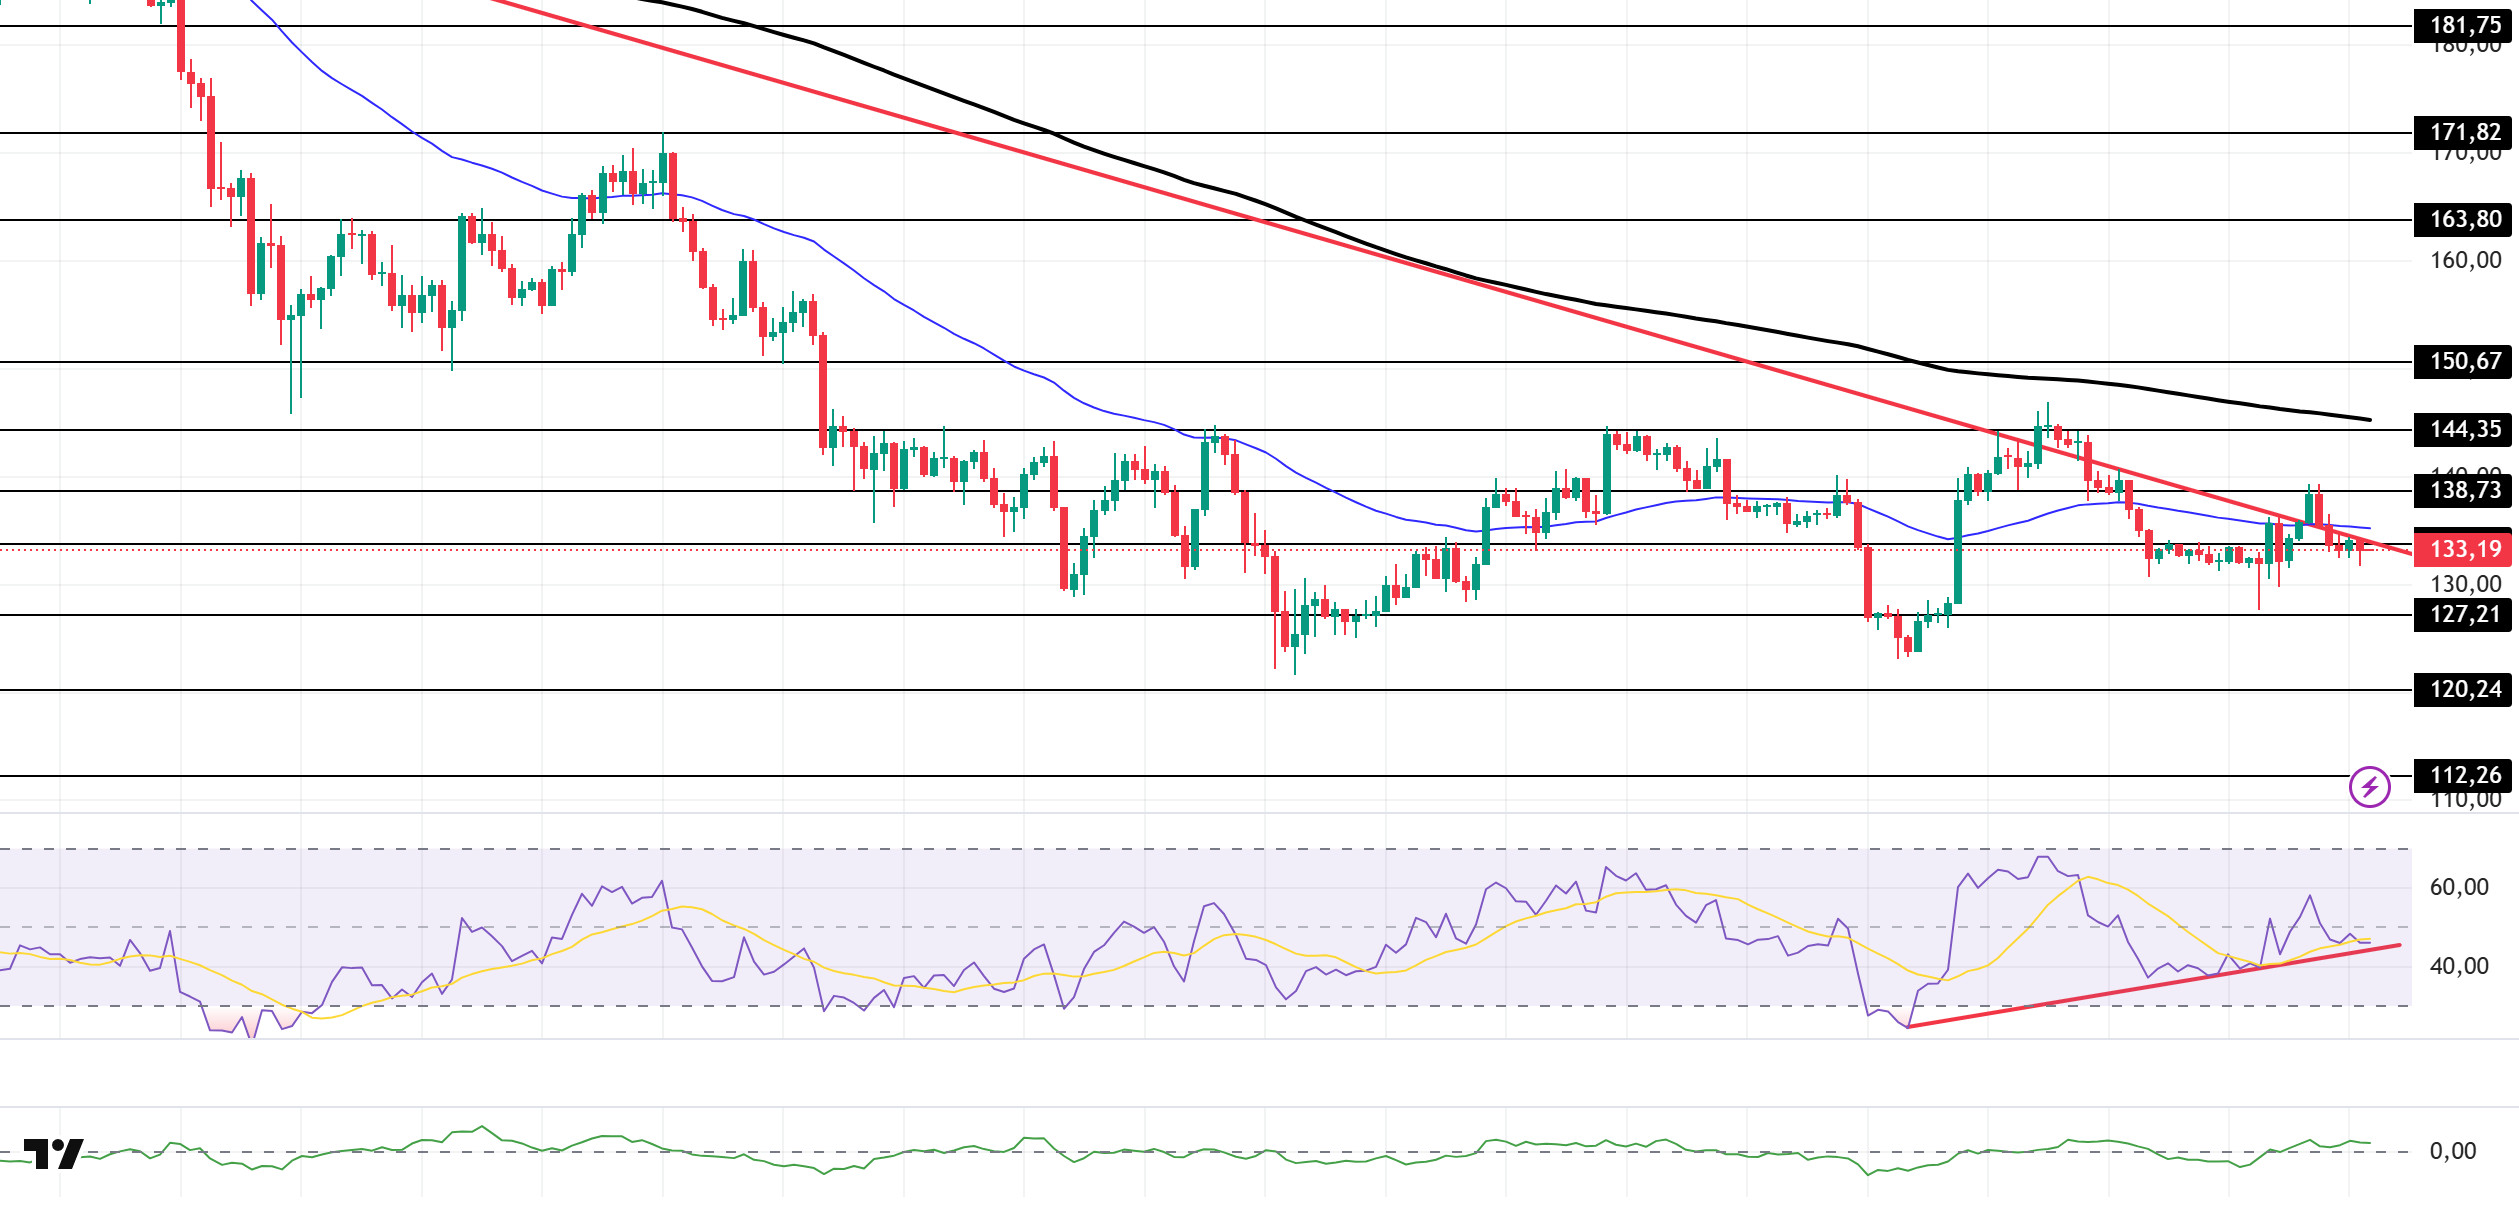
The SOL price experienced a pullback. The asset moved into the lower region of the downtrend that began on October 6. Experiencing a pullback from the strong resistance level of $138.73, the asset broke below the downtrend and the 50 EMA (Blue Line) moving average. Currently trading below the $133.74 level, the price could test the 200 EMA (Black Line) moving average if rallies begin. If the pullback continues, the $127.21 level could be triggered.
On the 4-hour chart, it remained below the 50 EMA (Exponential Moving Average – Blue Line) and 200 EMA (Black Line). This indicates a possible downtrend in the medium term. At the same time, the price being below both moving averages signals a downward trend for the asset in the short term. The Chaikin Money Flow (CMF-20) remained at a positive level. However, balanced cash inflows and outflows may keep the CMF in positive territory. The Relative Strength Index (RSI-14) fell from the middle of the positive zone to the middle of the negative zone. At the same time, it is currently testing the upward trend that began on December 1 as support. A downward break could increase selling pressure. If there is an uptrend due to macroeconomic data or positive news related to the Solana ecosystem, the $150.67 level stands out as a strong resistance point. If this level is broken upwards, the uptrend is expected to continue. In case of pullbacks due to developments in the opposite direction or profit-taking, the $120.24 level may be tested. A decline to these support levels could increase buying momentum, presenting a potential upside opportunity.
Supports: 127.21 – 120.24 – 112.26
Resistances: 133.74 – 138.73 – 144.35
DOGE/USDT
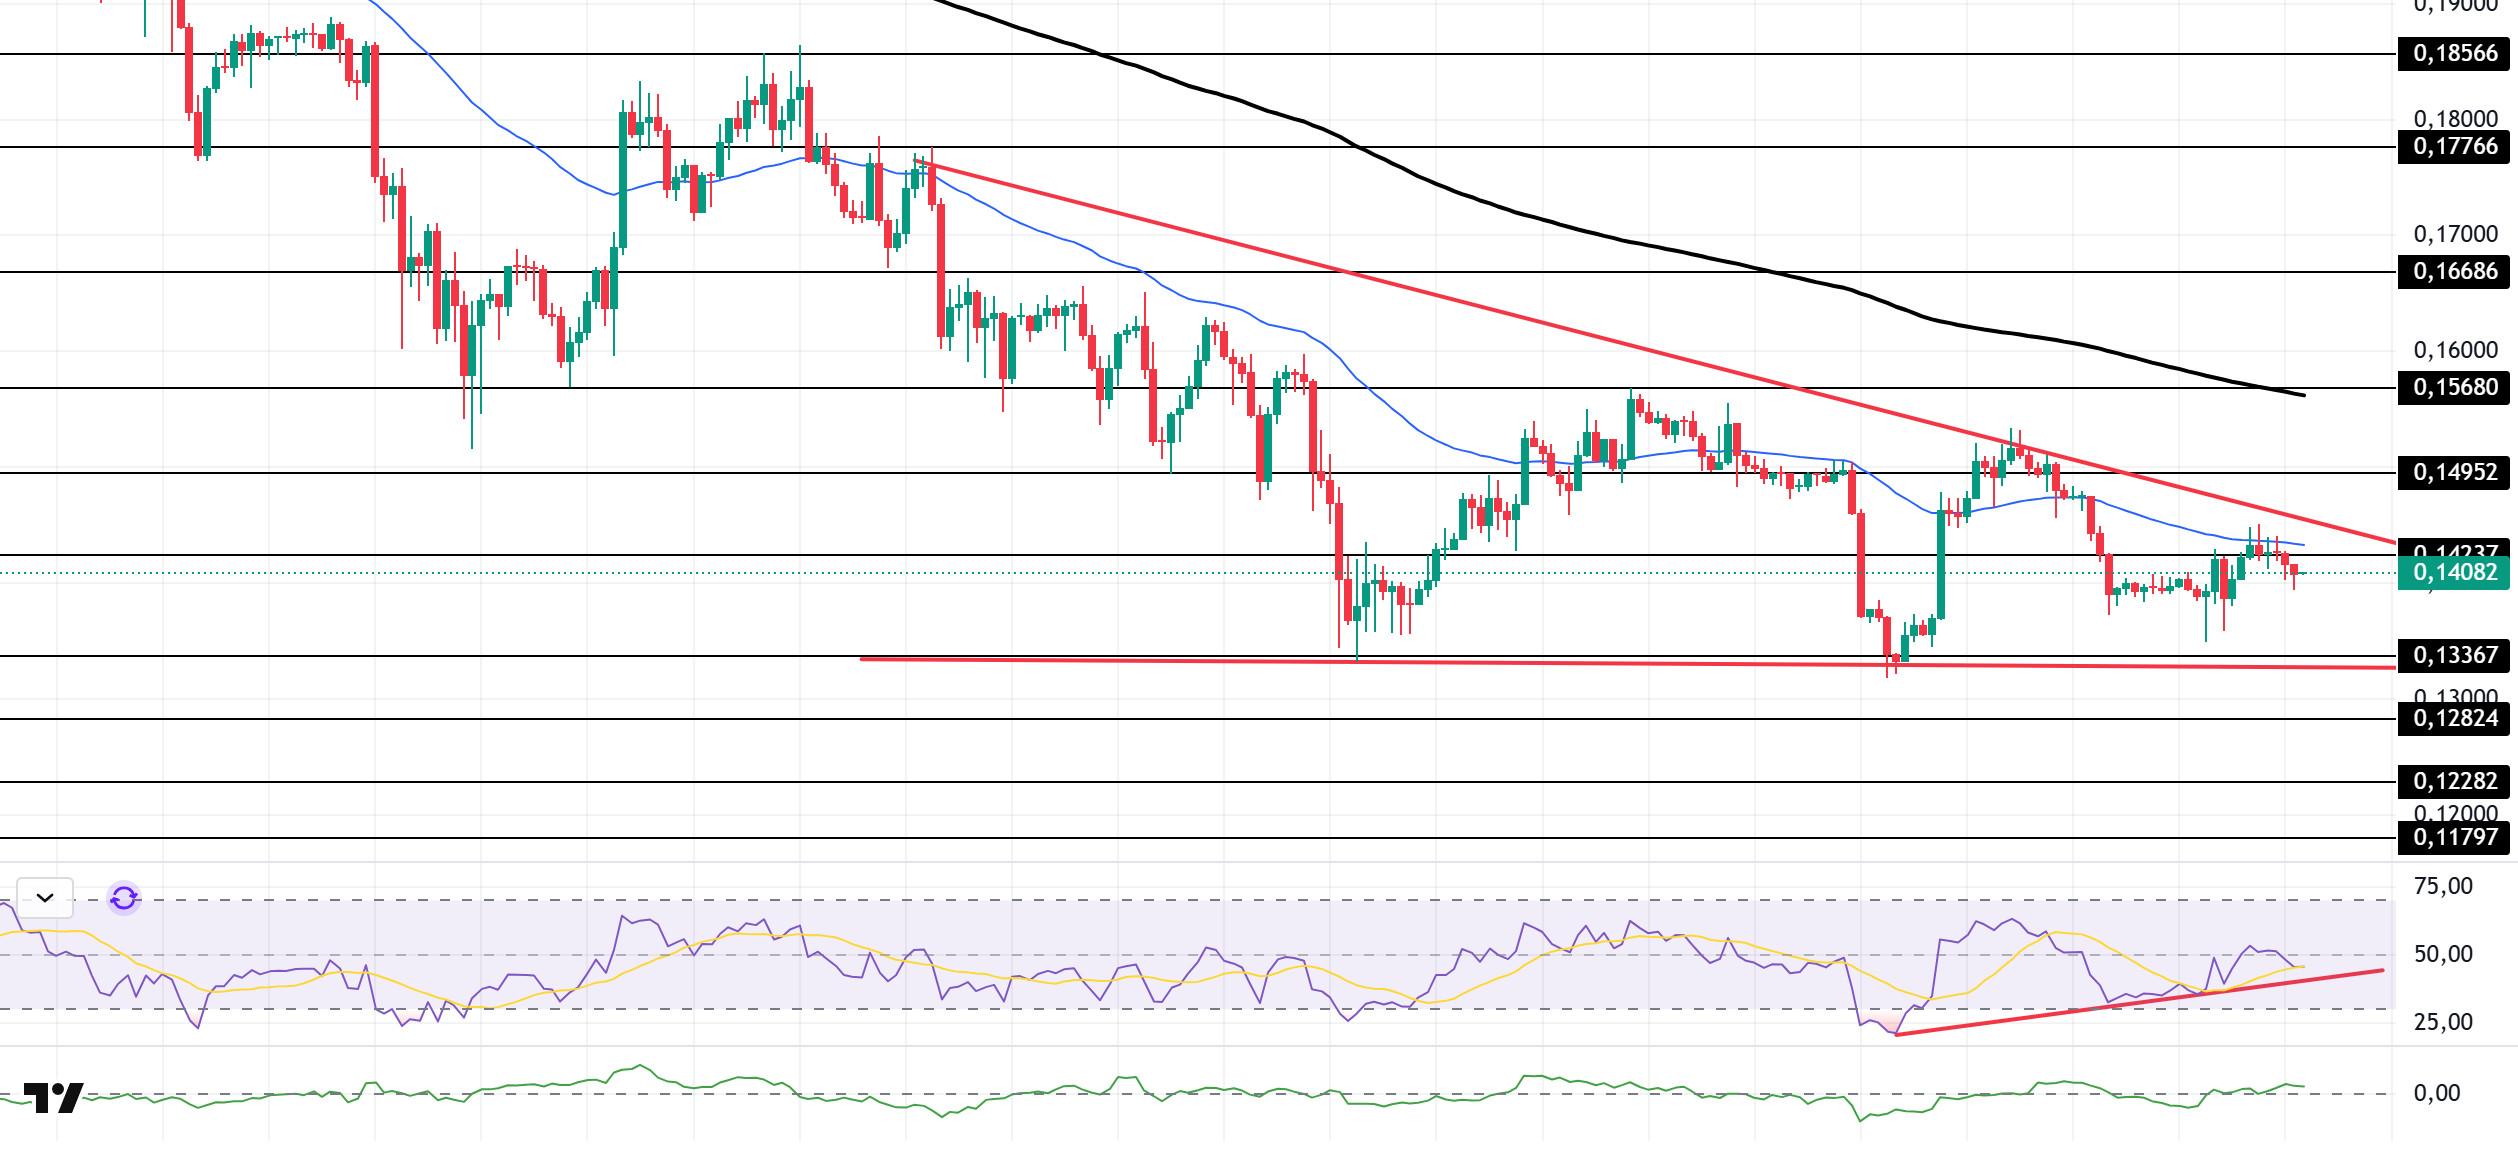
The DOGE price lost value. The asset continued to be within the descending triangle formation that began on November 13. The price, which tested the 50 EMA (Blue Line) moving average as resistance, failed to break through and experienced a pullback. Currently trading below the $0.14237 level, the price may test the base level of the descending triangle pattern if the pullback continues. If an uptrend begins, the ceiling level of the descending triangle pattern should be monitored.
On the 4-hour chart, the 50 EMA (Exponential Moving Average – Blue Line) remained below the 200 EMA (Black Line). This indicates that the downtrend may continue in the medium term. The price being below both moving averages indicates that the downward trend is likely to continue in the short term. The Chaikin Money Flow (CMF-20) remained in positive territory. Additionally, the balance of money inflows and outflows may keep the CMF in positive territory. The Relative Strength Index (RSI-14) retreated from positive territory to the midpoint of negative territory. It is currently testing the upward trendline that began on December 1 as support. A move below the upward trendline could signal the formation of selling pressure. In the event of potential increases driven by political developments, macroeconomic data, or positive news flow within the DOGE ecosystem, the $0.15680 level stands out as a strong resistance zone. Conversely, in the event of negative news flow, the $0.13367 level could be triggered. A decline to these levels could increase momentum and initiate a new wave of growth.
Supports: 0.13367 – 0.12824 – 0.12282
Resistances: 0.14237 – 0.14952 – 0.15680
AVAX/USDT
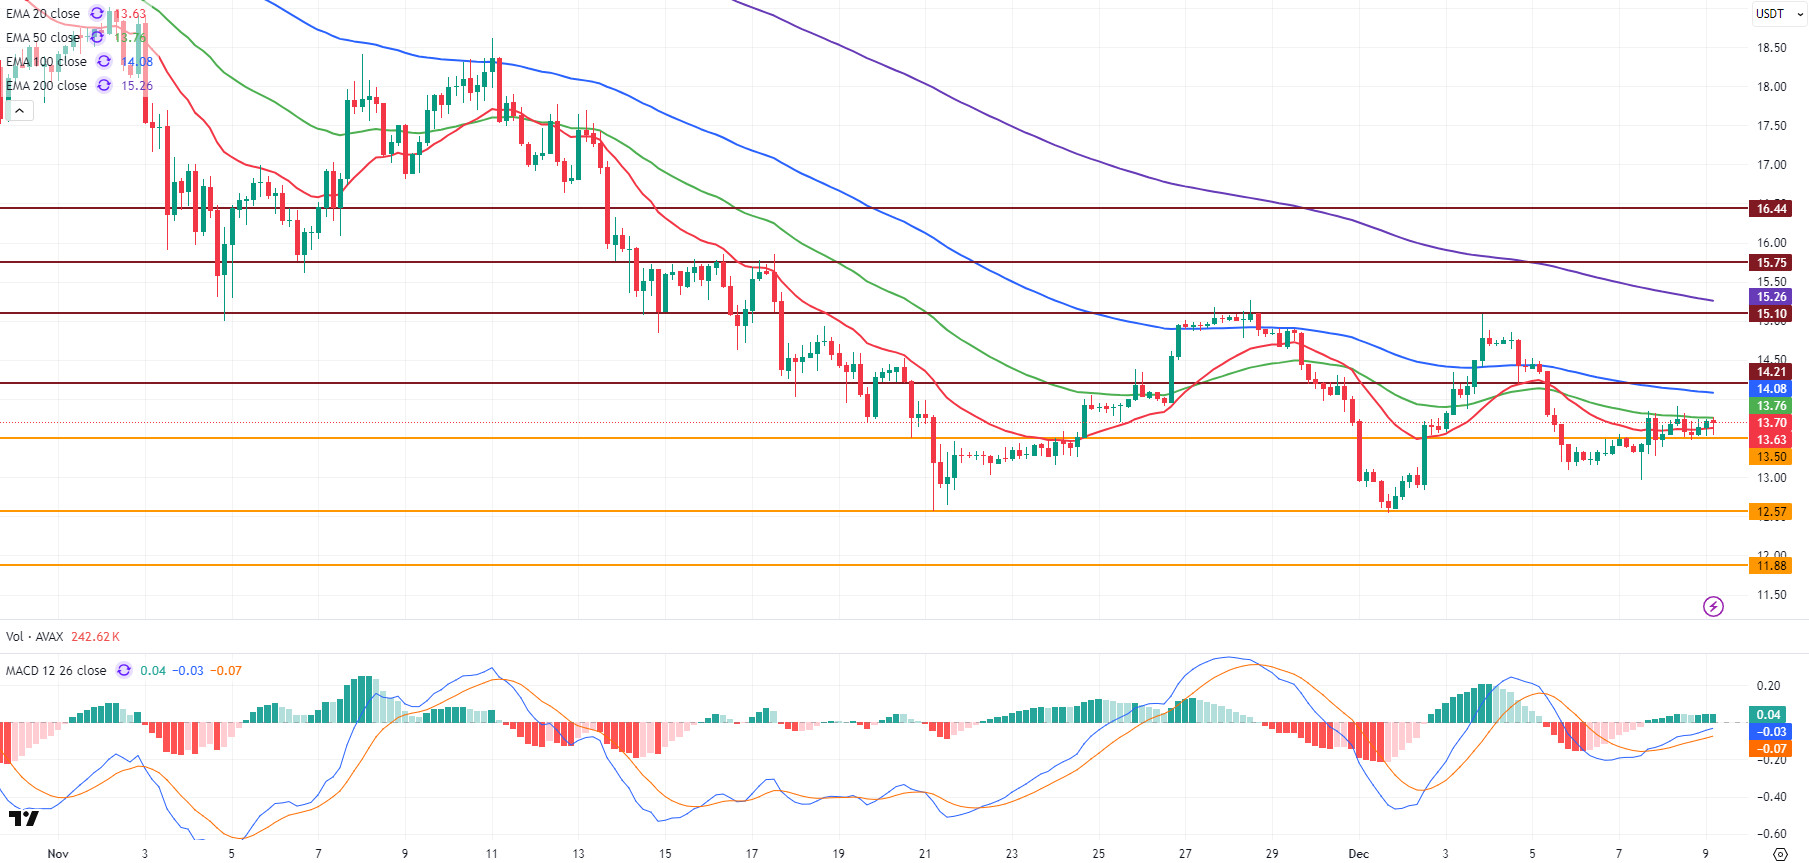
AVAX started the day at $13.49 yesterday and closed at $13.64 with a limited rise throughout the day, experiencing an approximate 1.1% increase in value. AVAX continues to trade within a low-momentum horizontal band, in line with the overall market. Due to weak momentum, it continues to struggle to find direction, stuck between the 20-period Exponential Moving Average (EMA20) and the 50-period Exponential Moving Average (EMA50) levels. The absence of major price-driving developments in the Avalanche ecosystem has caused AVAX to move in a more technically sensitive manner. Starting the new day at $13.64, AVAX continues to trade within a horizontal band, as it did yesterday.
On the 4-hour chart, the Moving Average Convergence/Divergence (MACD) line is above the signal line and trending upward. However, the fact that the MACD is still trading in negative territory indicates that the upward movement is not yet supported by strong momentum. AVAX continues to face selling pressure at resistance levels, and breakouts have not occurred due to weak momentum. Although AVAX surpassed EMA20 with yesterday’s rise, it failed to break through the EMA50 level despite testing it multiple times. Unless it can maintain stability above this level, it may continue to trade within a horizontal band. For the rise to gain technical strength, it is crucial to break through EMA50 first, followed by EMA100.
From a technical perspective, the EMA50 and then the EMA100 and the $14.21 resistance level stand out as the first important resistance zone for AVAX’s rise. If these levels are broken with high volume, AVAX could strengthen the possibility of a short-term trend reversal and test the EMA200, $15.10, and $15.75 levels in the continuation of the uptrend. Conversely, in a bearish scenario, the first critical support levels are EMA20 and $13.50. If AVAX closes below these levels, selling pressure could increase, and if the decline gains momentum, it could retreat towards the $12.57 and $11.88 levels. Overall, the MACD still trading in negative territory and AVAX remaining below the EMA50 and EMA100 levels indicate weak upward momentum. Therefore, unless there is strong volume and a trend breakout, upward attempts are likely to be limited at resistance levels.
(EMA20: Red Line, EMA50: Green Line, EMA100: Blue Line, EMA200: Purple Line)
Supports: 13.50 – 12.57 – 11.88
Resistances: 14.21 – 15.10 – 15.75
LINK/USDT
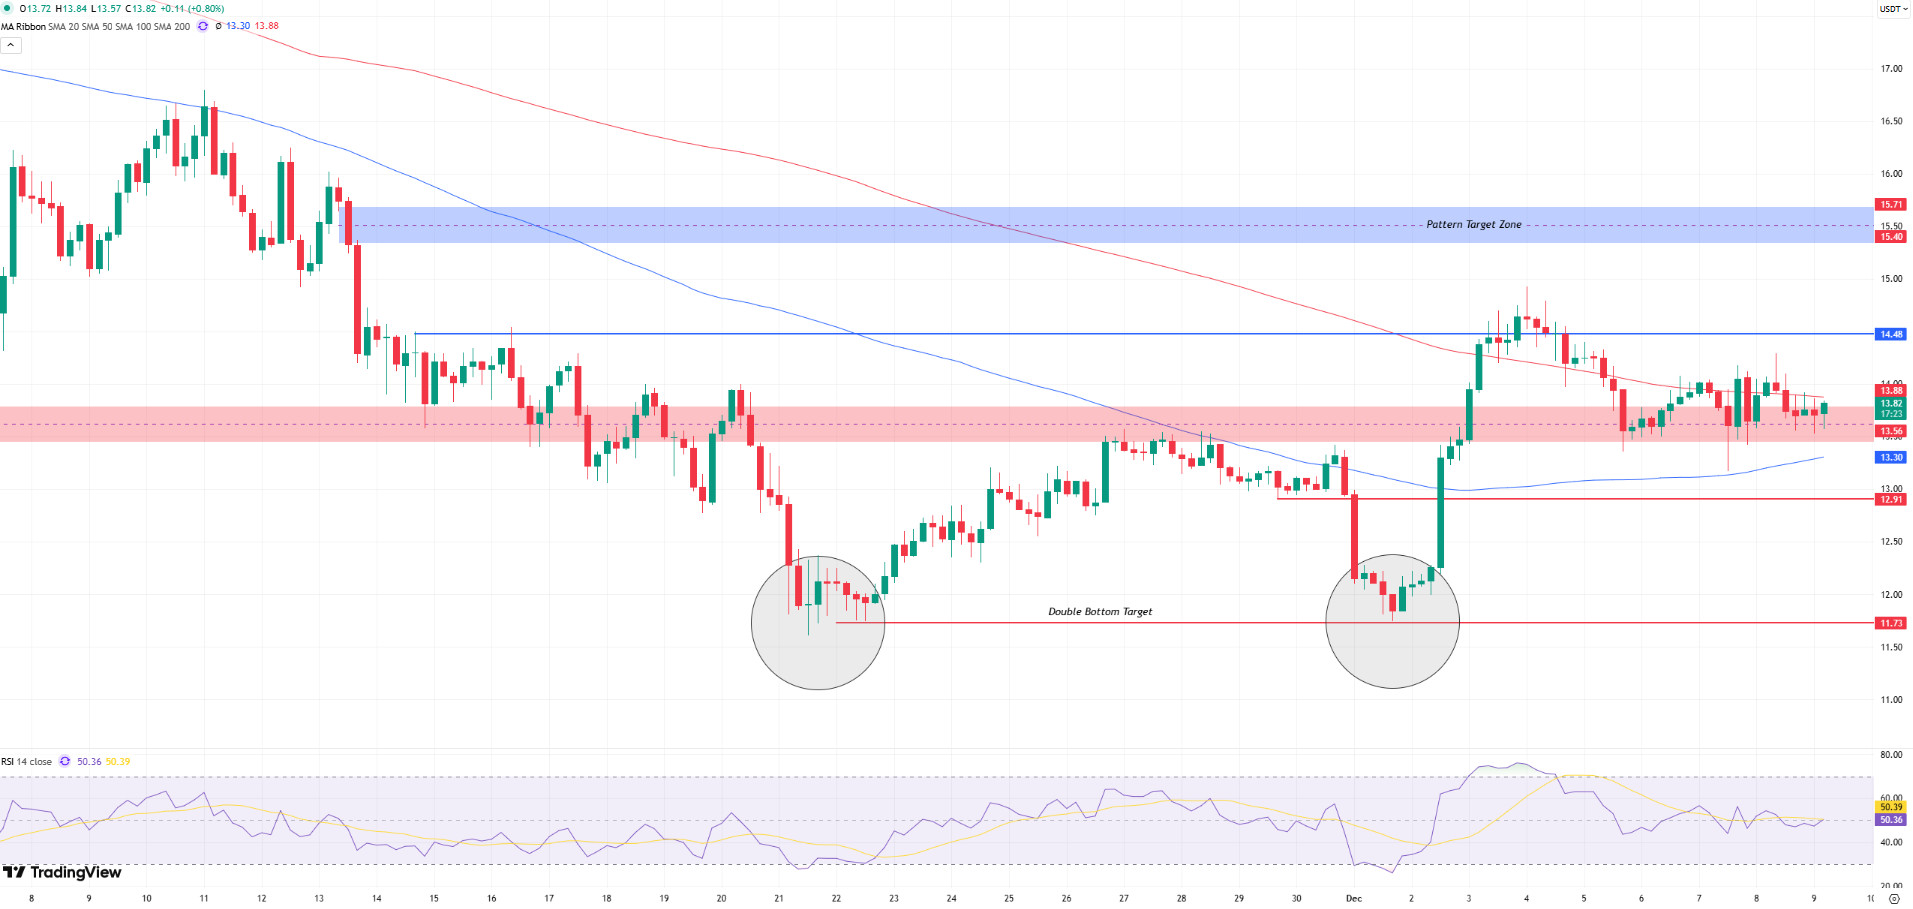
In yesterday’s analysis, we pointed out that the double bottom formation at the 11.70 level was a critical turning point for the trend and noted that the reaction from this area created a structural positivity in the price. In the current chart, we see that this positive structure is trying to hold on to the 13.56 – 13.88 support band. Although the price tested the 14.48 barrier in its recent attacks, it failed to sustain itself above this level, so the market is currently dominated by a consolidation-heavy decision-making process.
In the current price outlook, LINK continues to find buyers above 13.56, maintaining the short-term positive structure. This area is critical for bulls to avoid losing the trend entirely, as it serves both as a retest of the previous breakout and a strong liquidity zone. If 14.48 is retested, a close above this level would bring the 15.40 – 15.71 formation target zone back into technical focus. As this area has seen sharp sell-offs in the past, the uptrend may naturally encounter profit-taking here. Therefore, it is possible to say that movements towards this area will mostly test the strength of the trend’s continuation.
On the downside, the $13 region is the first line of defense. Losing this band could pull the price first to the $12.91 support, and then to the $11.70 region, which is the lower boundary of the double bottom formation. As we mentioned in our previous analysis, prices below 11.70 would completely undermine the structural positivity and could push the medium-term trend back into negative territory.
Although we see a short-term weakening in the Relative Strength Index (RSI), the current consolidation and positive technical structure make the possibility of an upward breakout much stronger. Closings above 14.48 could strengthen the trend again and initiate new momentum towards our target zone.
Supports: 13.56 – 12.91 – 11.73
Resistances: 14.48 – 15.40 – 15.71
Legal Notice
The investment information, comments, and recommendations contained herein do not constitute investment advice. Investment advisory services are provided individually by authorized institutions taking into account the risk and return preferences of individuals. The comments and recommendations contained herein are of a general nature. These recommendations may not be suitable for your financial situation and risk and return preferences. Therefore, making an investment decision based solely on the information contained herein may not produce results in line with your expectations.

