
Technical Analysis
BTC/USDT
Fed Governor Christopher Waller said a 25-basis-point rate cut could be appropriate, but that steps should be taken cautiously. This statement echoed the views of New York Fed President Williams, who highlighted the weakening labor market. The Russian Central Bank established a controlled bridge between traditional finance and digital assets by granting banks limited permission to conduct crypto transactions. Meanwhile, as discussions on the DeFi regulation draft stalled in the US Congress, Metaplanet paused its Bitcoin purchases. On the mining front, Cango continued operations with a weekly production of 135.6 BTC.
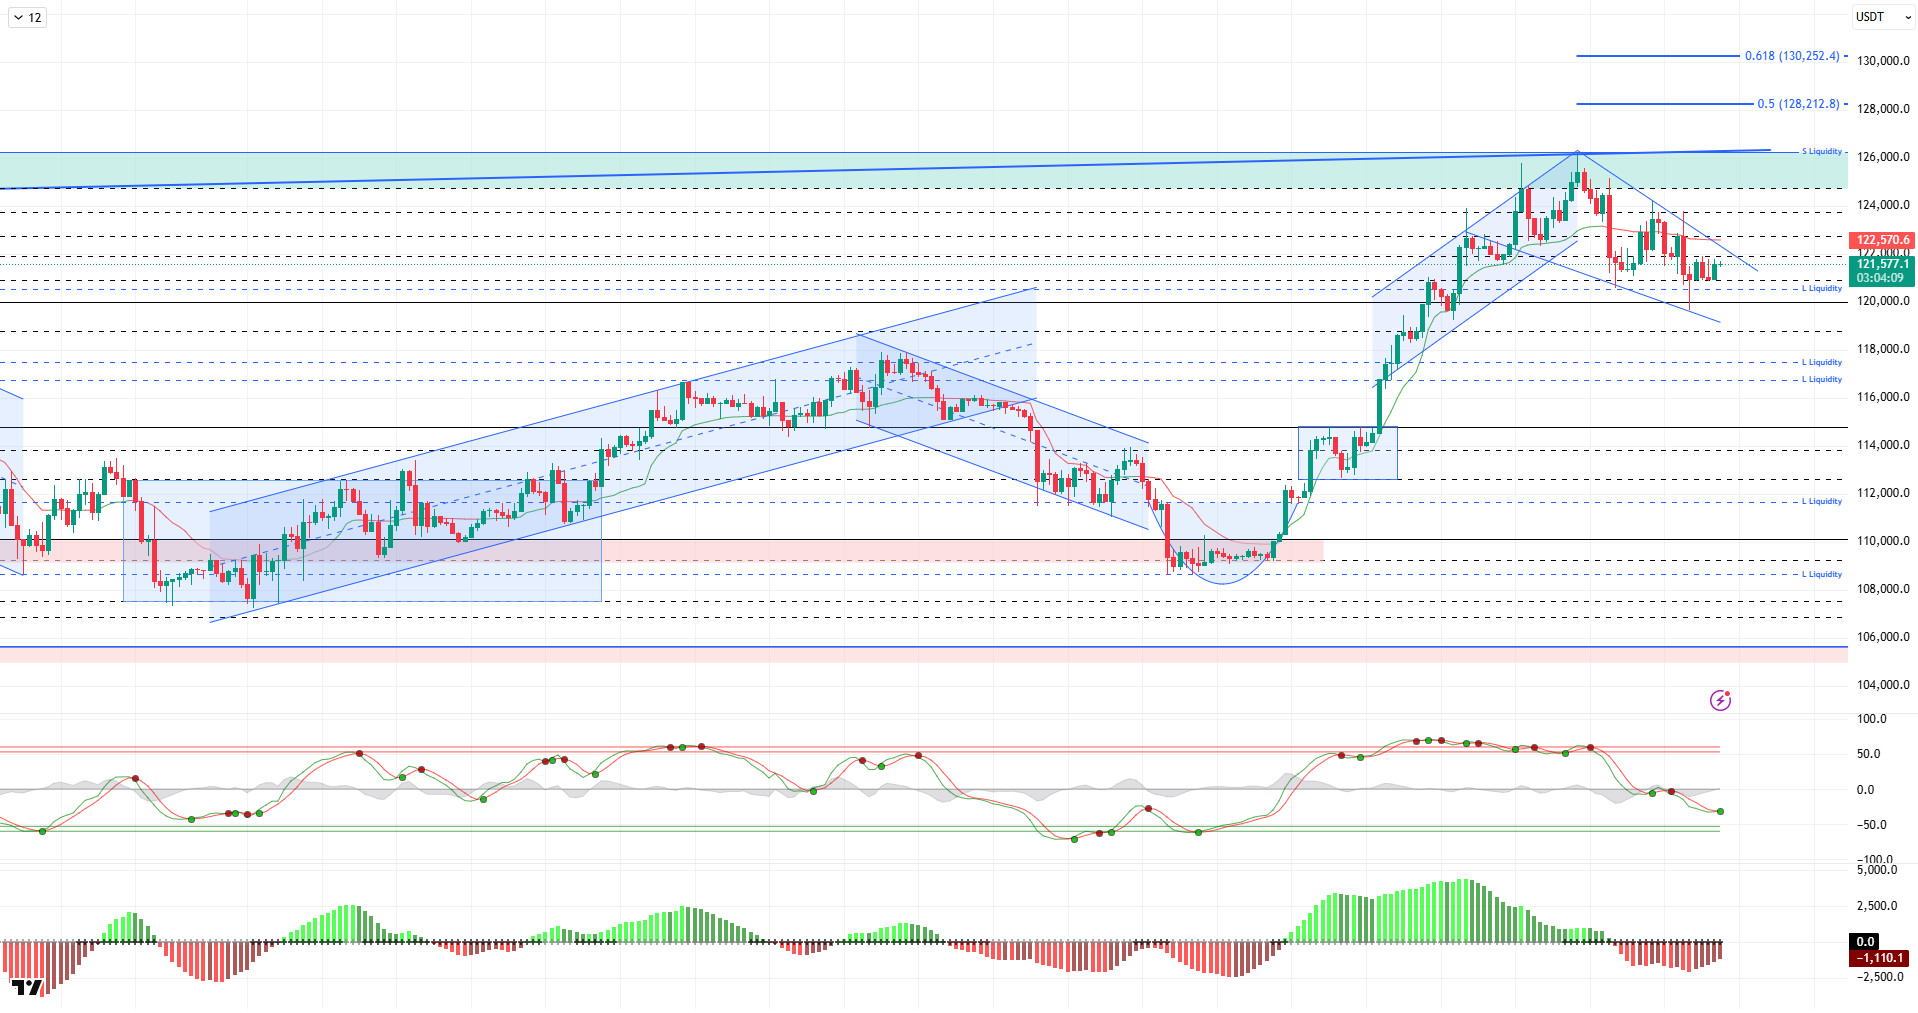
Looking at the technical picture, BTC broke its short-term uptrend after correcting following its second peak attempt at 126,198. While volatility increased in BTC, which formed a flag pattern close to its ATH level, it appears to be forcing futures positions to close. In the previous analysis, the price spiked to 123,800 levels and faced strong selling pressure, falling back to 119,500. The price, which rebounded from this level, continues to trade at 121,400 at the time of writing.
Technical indicators show that the Wave Trend (WT) oscillator has reversed its sell signal, which was just below the middle band of the channel, to a buy signal. The Squeeze Momentum (SM) indicator’s histogram remains in negative territory. The Kaufman moving average is currently trading above the price at the 122,500 level.
Looking at liquidation data, with the recent decline, heavy buy-side trades were liquidated at the 120,500 level, while the accumulation of illiquid buy orders below the 119,500 level was maintained. The selling level was liquidated around 122,000 in the short term, while in the long term, intense accumulation was maintained at the 126,400 level.
In summary, on the fundamental side, the rise in BTC is supported by institutional demand for ETFs, the impact of expectations of Fed interest rate cuts, correlation with gold, and cyclical movements in October. The technical outlook reached saturation point as the price tested the 126,198 ATH level, while liquidity data pushed the price into a correction. Although the 120,500 support level was lost in the short term as selling pressure intensified, the bullish structure of the price allowed it to rise above this level again. After this stage, the deepening selling pressure will again be monitored as the critical reference area at 120,500. A break below this level could direct the price towards liquidity areas and deepen the selling pressure. In the event of a continued rise, the 122,700 resistance area comes into view.
Supports: 120,500 – 118,800 – 117,400
Resistances: 122,700 – 123,800 – 124,700
ETH/USDT
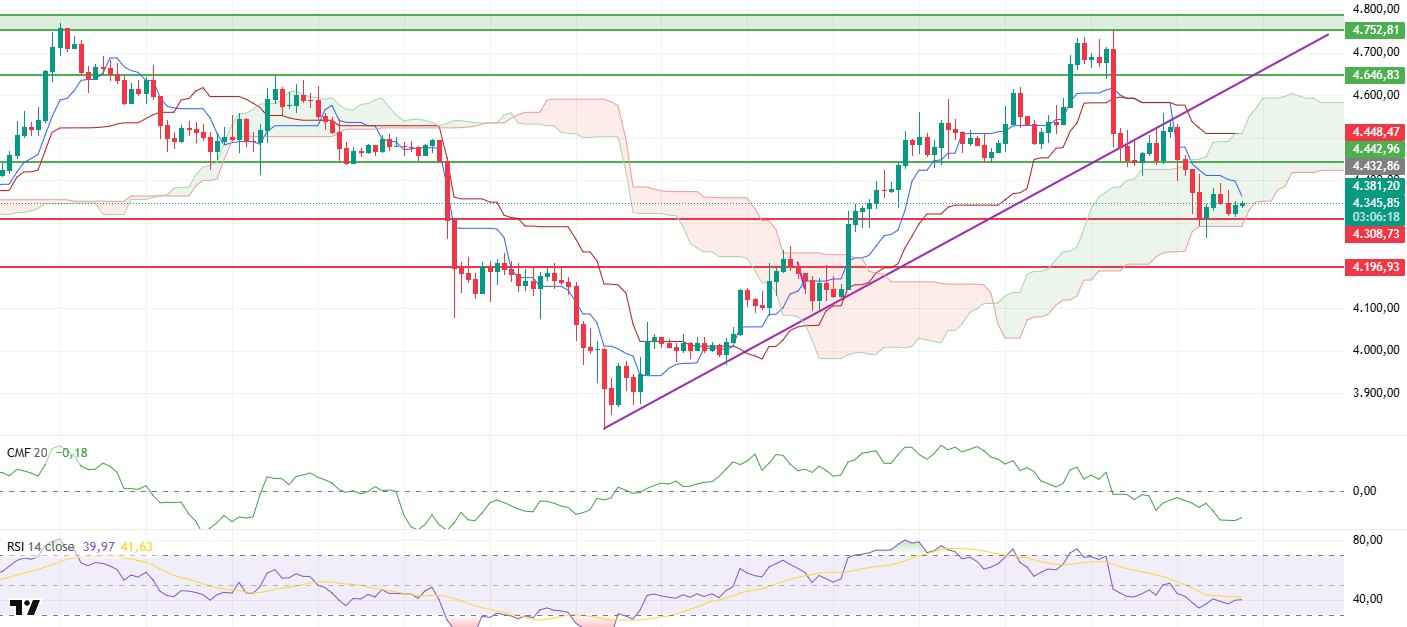
The ETH price retested the $4,308 support zone during the day but rebounded with buying at this level, rising to $4,340. Low volume throughout the day indicates weak market participation and shows that buyers are still cautious.
The Chaikin Money Flow (CMF) indicator remains in negative territory. This outlook, which indicates continued liquidity outflows, confirms that strong capital inflows have not yet kicked in. The CMF’s deepening in this area signals that the flow supporting sustained gains is still weak.
The Relative Strength Index (RSI) indicator is hovering around the 39 level and showing a downward horizontal trend. The RSI’s current position indicates that while buying momentum is limited, selling pressure remains effective in the market. For the price to gain strength in the short term, a clear recovery in momentum is needed.
The downward trend of the Tenkan and Kijun lines in the Ichimoku indicator continues. This pattern indicates that market risk persists in the short term. However, the fact that the price has not yet fallen below the kumo cloud suggests that the medium-term trend has not yet turned completely negative. This pullback can be interpreted as a correction within the overall upward trend.
The technical outlook highlighted in this morning’s analysis remains largely intact. The $4,308 level continues to be a critical support in the short term. Closing below this level could increase selling pressure and pull the price down to $4,196. Buyers may regain strength in this region, but a drop below $4,196 could bring the risk of a deeper correction to the fore. In an upward scenario, regaining the $4,442 level stands out as the most important step in restoring confidence in the market. If this level is exceeded, the $4,646 resistance becomes the new target, and if this resistance is broken, the price could potentially start a broadening move towards the $4,752 band.
Support Levels: 4,308 – 4,196 – 4,014
Resistances: 4,442 – 4,646 – 4,752
XRP/USDT
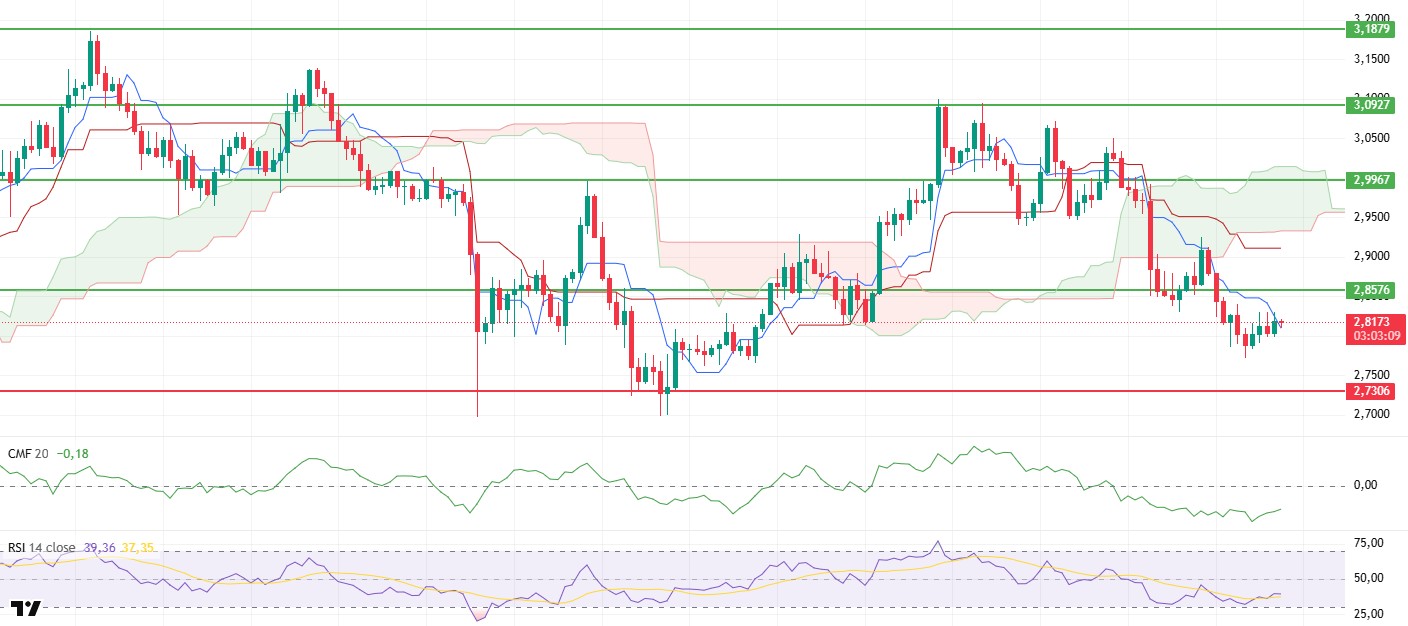
The XRP price moved sideways throughout the day and traded within a narrow range. There was no significant buying or selling pressure during the day, reflecting investors’ cautious stance. Weakness in volume indicates that the search for direction continues in the short term.
The Chaikin Money Flow (CMF) indicator remains in negative territory while showing a slight upward trend. This pattern confirms that capital outflows from the market continue and that upward attempts struggle to find strong liquidity support. The CMF’s persistence in this area signals that the selling side still holds control.
The Relative Strength Index (RSI) indicator is hovering near the oversold zone and maintaining a weak momentum outlook. Buyers’ reluctance to return to the market is limiting potential recovery attempts. The RSI’s current position makes it difficult for the price to reverse its direction upward in the short term.
According to the Ichimoku indicator, the price remaining below the kumo cloud indicates that the overall trend remains negative. The price trading below the Tenkan and Kijun lines supports the continuation of short-term selling pressure.
In the broader view, as long as the XRP price remains below the $2.8576 level, the risk of a pullback continuing down to the $2.73 region appears likely. Conversely, if the price regains the $2.8576 level, it would signal that the downward momentum is weakening and that a limited recovery process could begin in the short term.
Supports: $2.7306 – $2.6513 – $2.4730
Resistances: 2.8576 – 2.9967 – 3.0927
SOL/USDT
Grayscale filed a Solana ETF with a 0.35% commission.
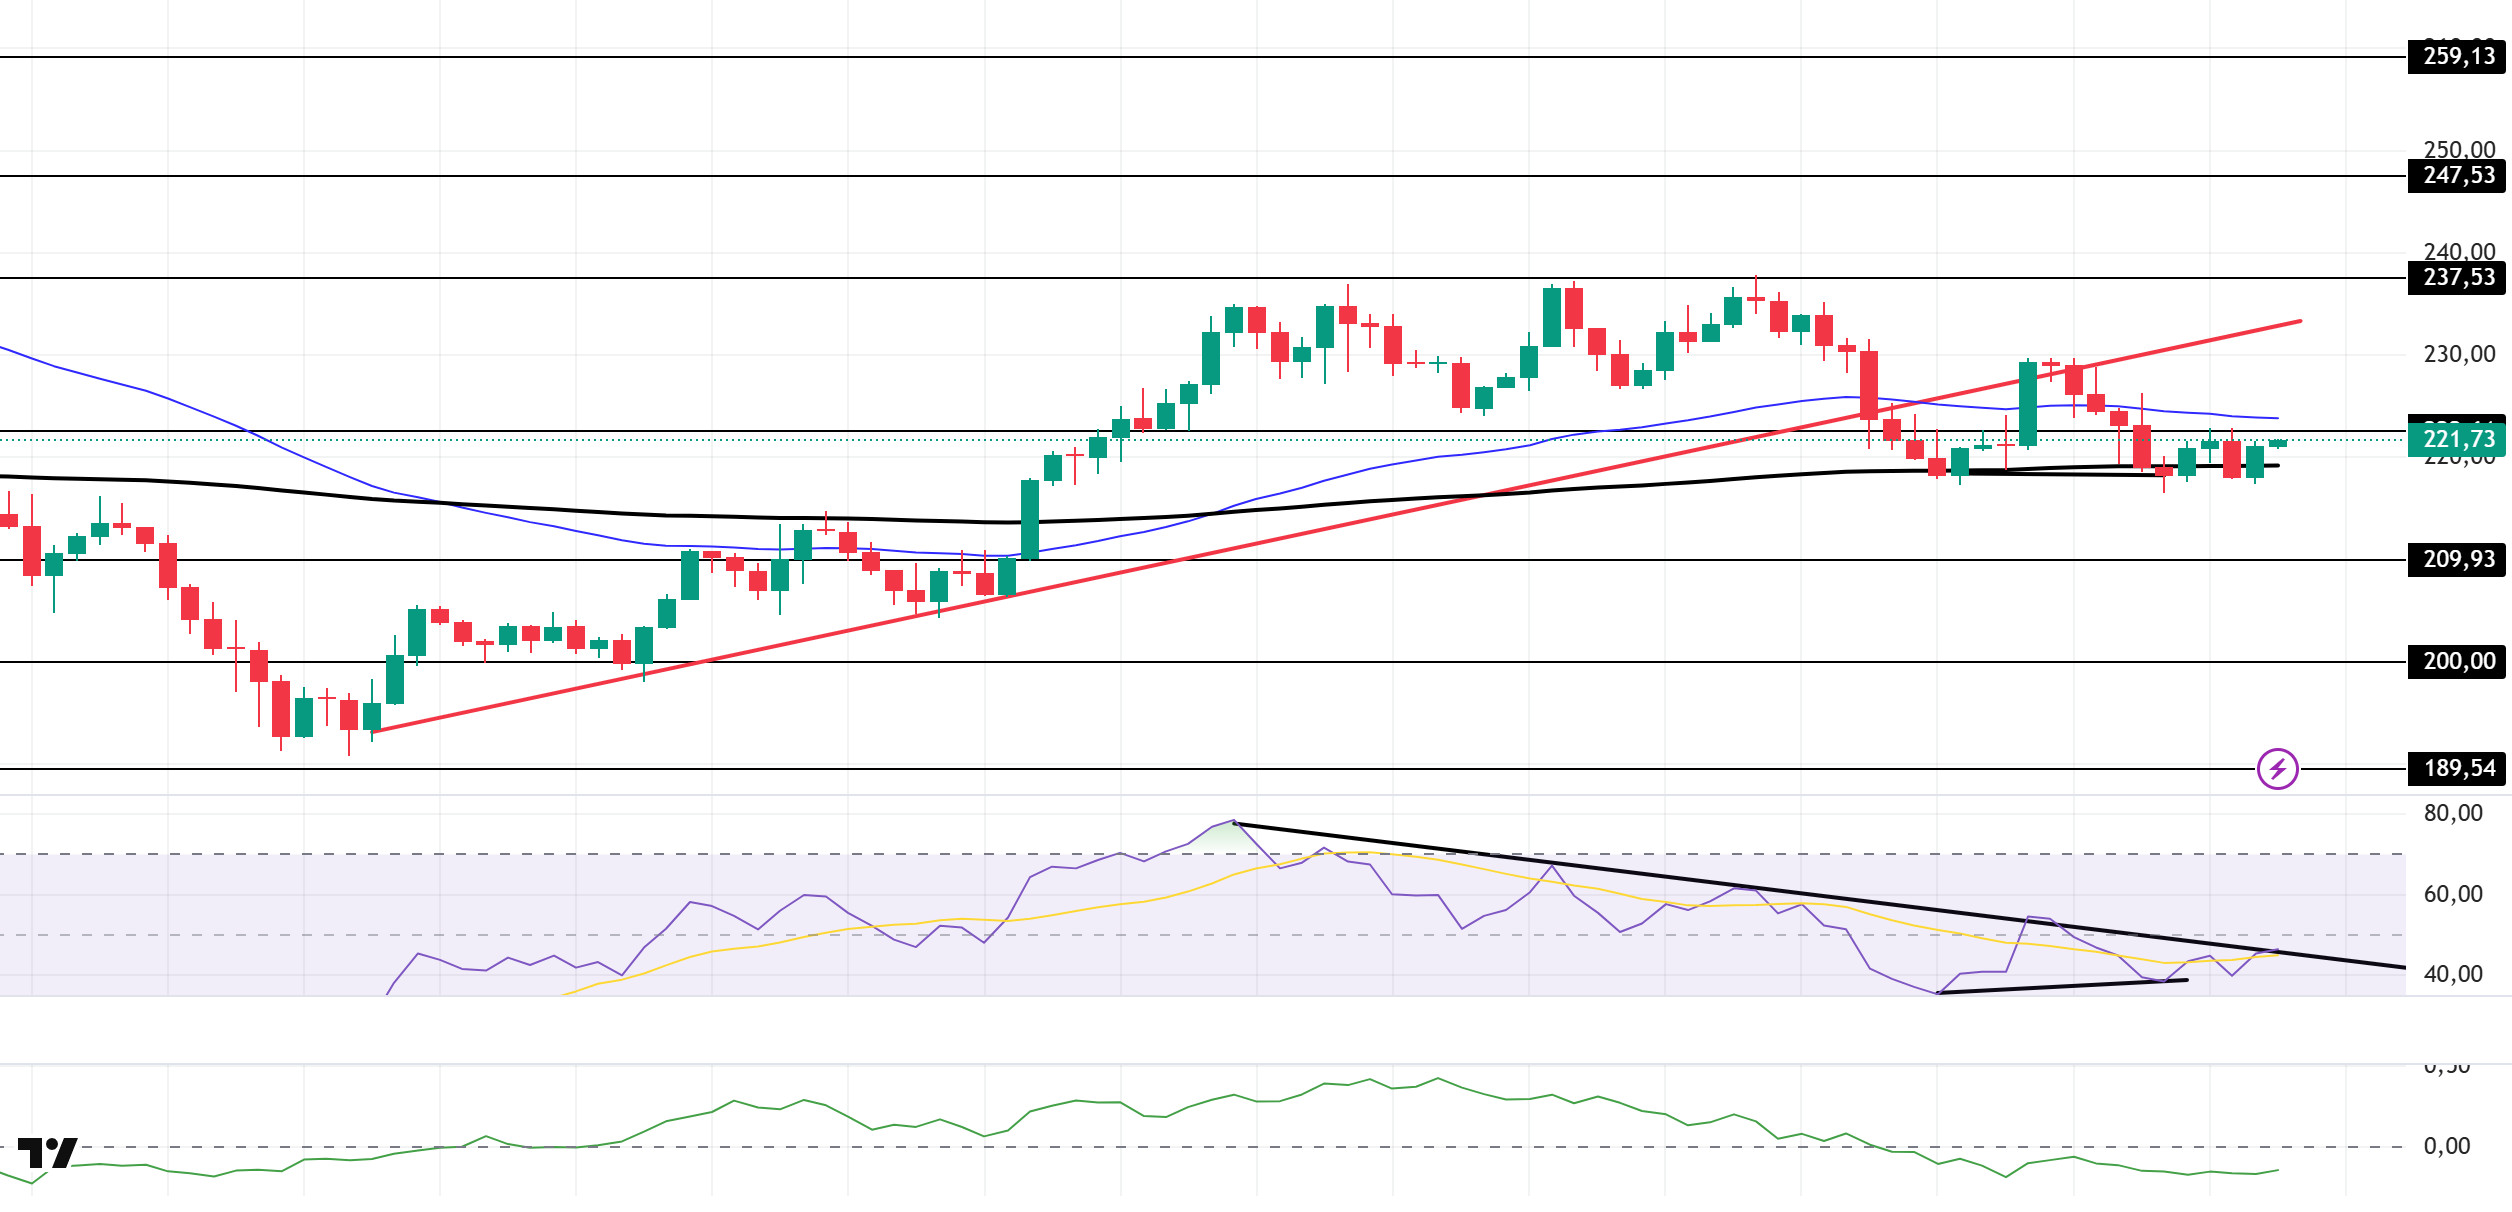
The SOL price traded sideways during the day. The asset continues to be in the lower region of the upward trend that began on September 26. This could increase selling pressure. The price, which continues to be in the lower region of the 50 EMA (Blue Line) moving average, showed a slight increase, supported by the 200 EMA (Black Line) moving average, which is currently a strong support level. If the upward movement continues, it could test the $237.53 level and the upward trend as resistance. If a pullback begins, the $209.93 level could be monitored.
The price remained above the 50 EMA (Exponential Moving Average – Blue Line) and 200 EMA (Black Line) on the 4-hour chart. This indicates a potential upward trend in the medium term. At the same time, the price being between the two moving averages shows us that the asset is in a decision phase in the short term. The Chaikin Money Flow (CMF-20) remained in negative territory. However, an increase in money inflows could push the CMF into deeper positive territory. The Relative Strength Index (RSI-14) is currently testing the resistance level that began on October 2 and remains in negative territory. A breakout could lead to buying pressure. At the same time, there is a positive divergence. If there is an uptrend due to macroeconomic data or positive news related to the Solana ecosystem, the $237.53 level stands out as a strong resistance point. If this level is broken upwards, the uptrend is expected to continue. In case of pullbacks due to developments in the opposite direction or profit-taking, the $209.93 level may be tested. If it falls back to these support levels, an increase in buying momentum may present a potential upside opportunity.
Supports: 209.93 – 200.00 – 189.54
Resistances: 222.61 – 237.53 – 247.53
DOGE/USDT
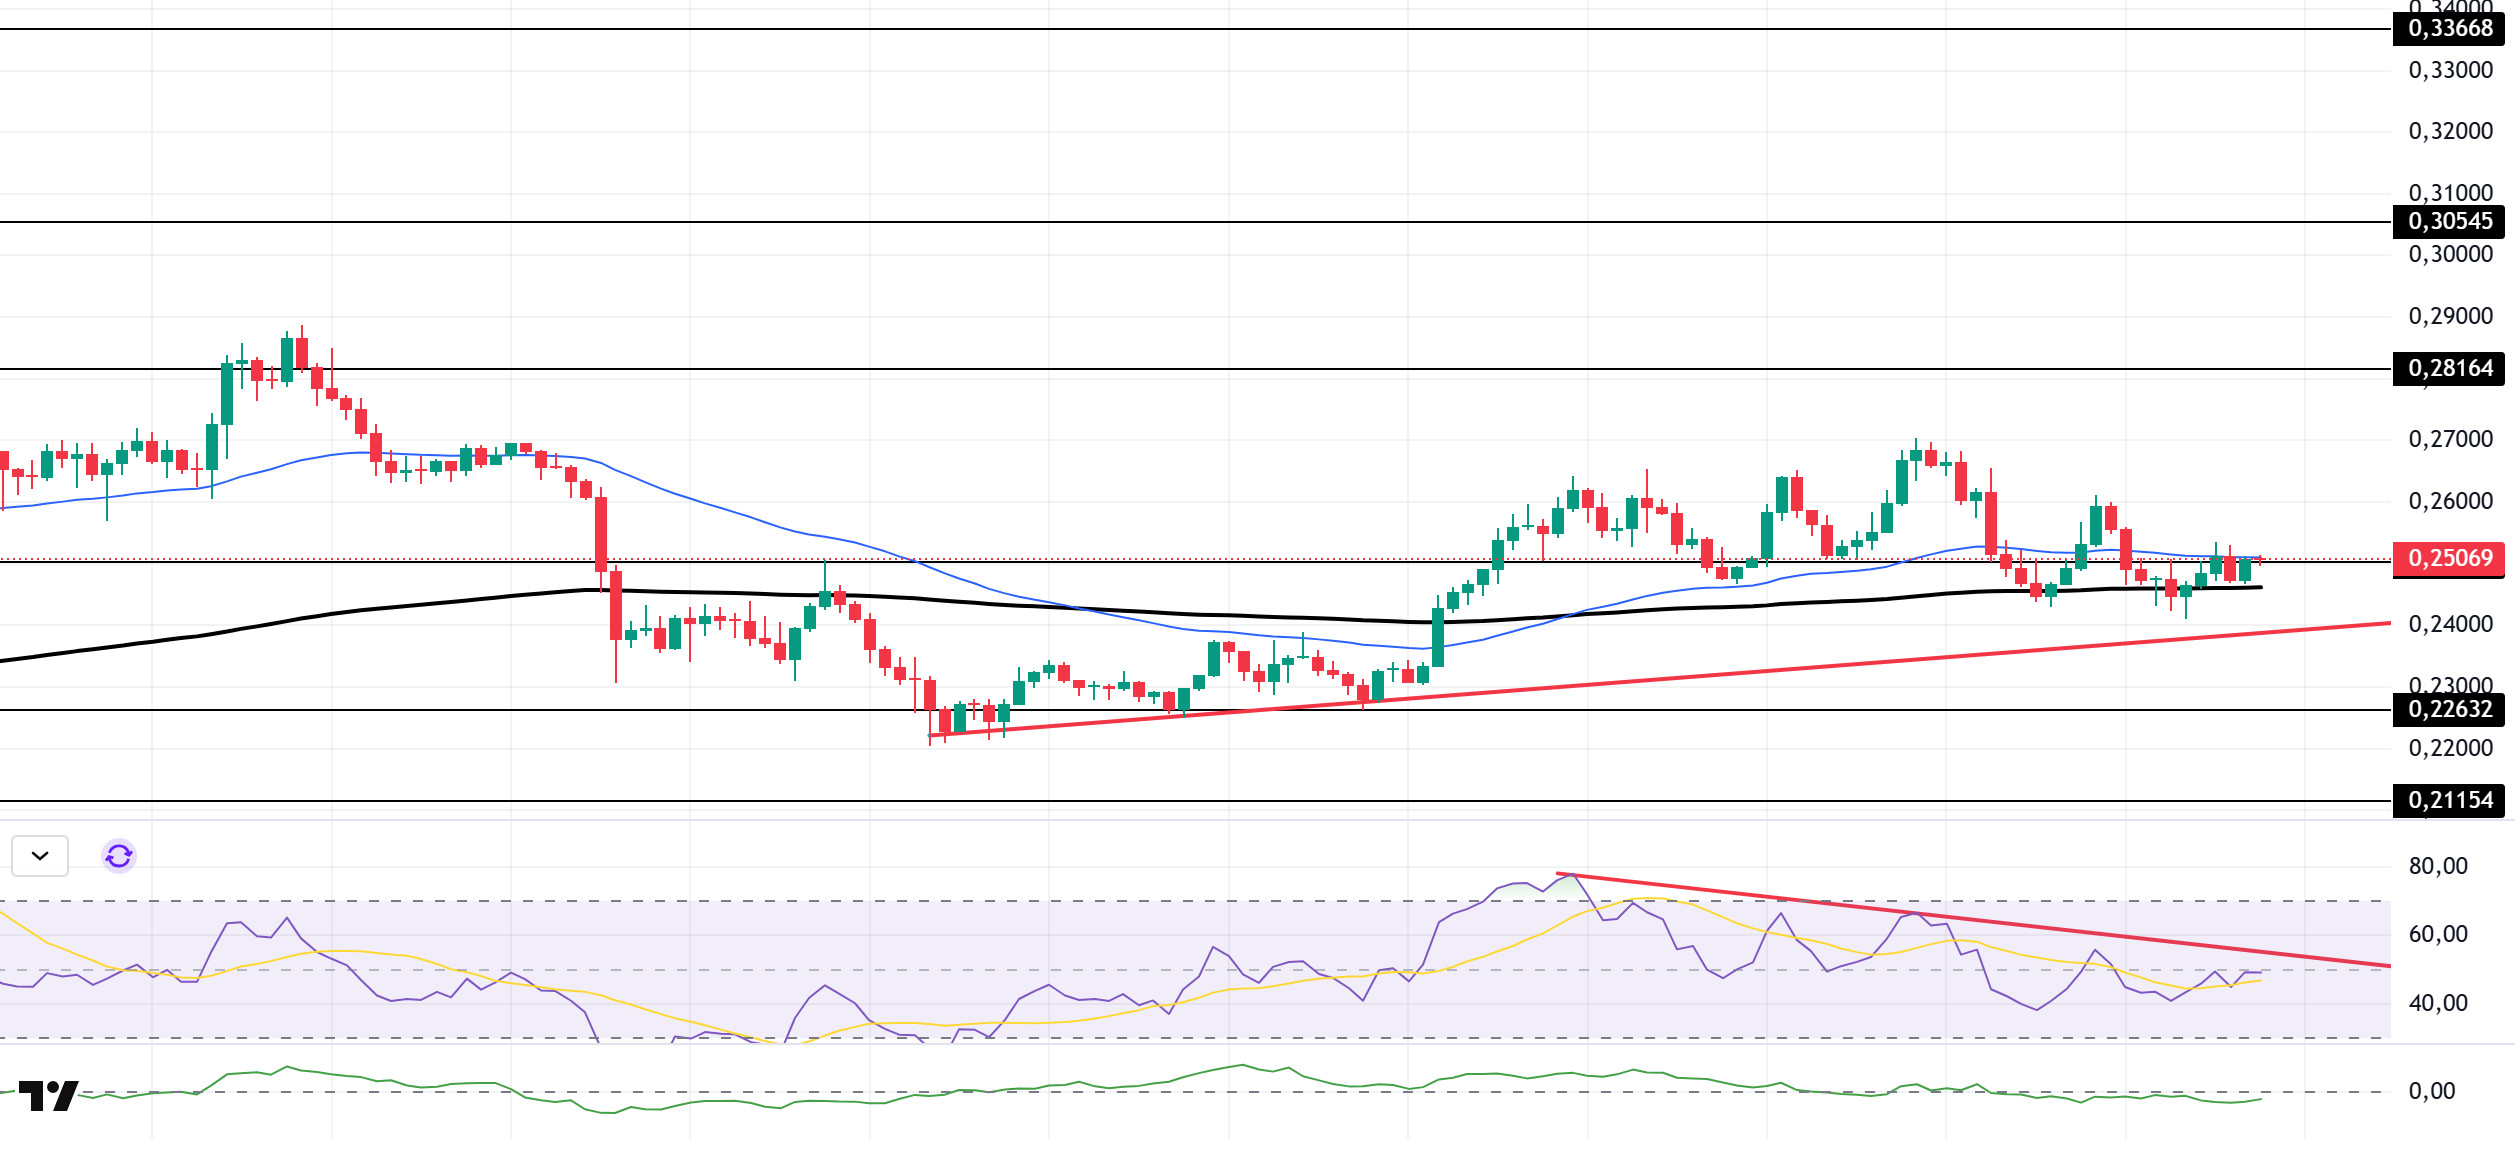
The DOGE price continued its sideways movement during the day. The asset remains above the upward trend that began on September 25. The price, supported by the 200 EMA (Black Line) moving average, is currently testing the 50 EMA (Blue Line) moving average as resistance. If it breaks through here and the uptrend continues, it could test the $0.28164 level. In the event of a pullback, the rising trend line level should be monitored.
On the 4-hour chart, the 50 EMA (Exponential Moving Average – Blue Line) remained above the 200 EMA (Black Line). This indicates that an uptrend could begin in the medium term. The price being between the two moving averages shows that the price is in a decision-making phase in the short term. The Chaikin Money Flow (CMF-20) experienced a slight rise towards the neutral level. Additionally, a decrease in money inflows could push the CMF deeper into negative territory. The Relative Strength Index (RSI-14) remained below the downward trend that began on October 2, continuing to stay in negative territory. This signaled that selling pressure was continuing. In the event of a rise due to political developments, macroeconomic data, or positive news flow in the DOGE ecosystem, the $0.28164 level stands out as a strong resistance zone. Conversely, in the event of negative news flow, the $0.22632 level could be triggered. A decline to these levels could increase momentum and potentially initiate a new upward wave.
Supports: 0.25025 – 0.22632 – 0.21154
Resistances: 0.28164 – 0.30545 – 0.33668
SUI/USDT
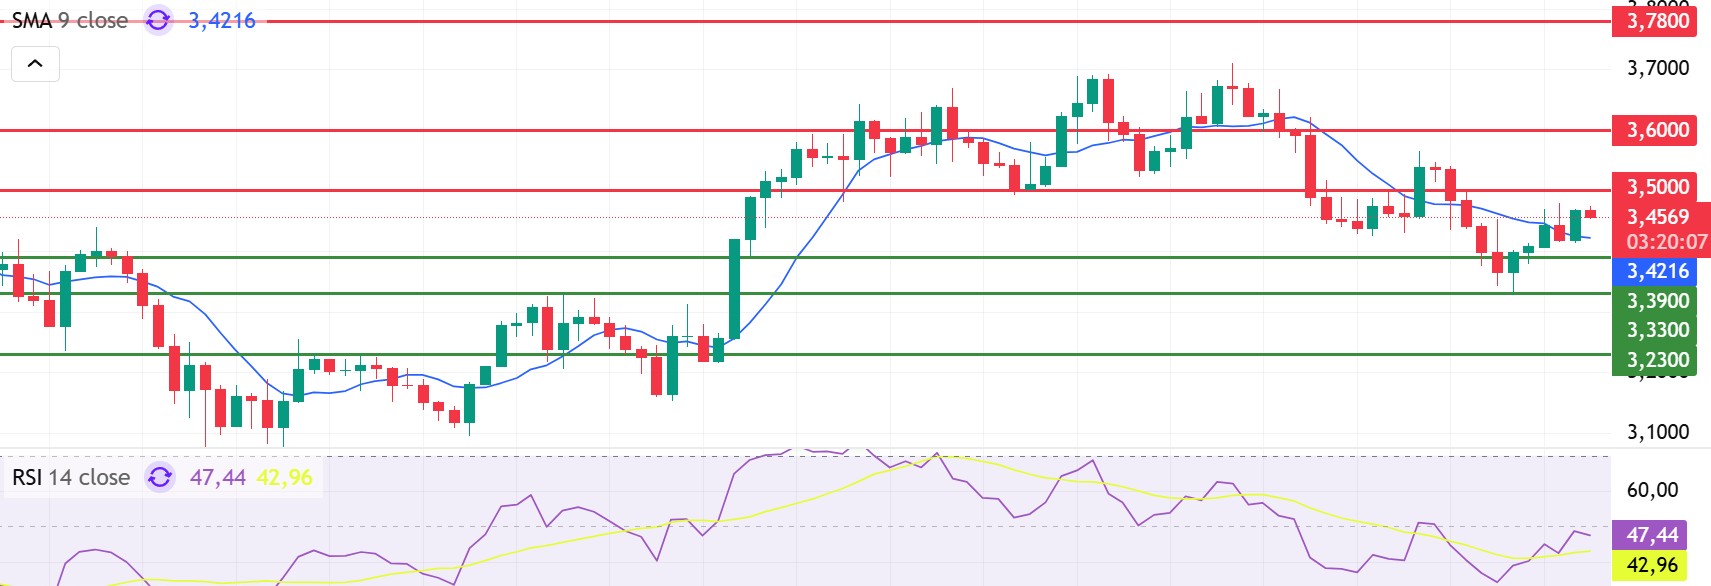
Looking at Sui’s technical outlook, we see that the price has fallen to around $3.45 on the 4-hour chart, influenced by fundamental developments. The Relative Strength Index (RSI) is currently in the range of 47.44 – 42.96. This range indicates that the market is trading close to the buy zone; a drop in the RSI to the 35.00 – 45.00 range could signal a potential buying point. If the price moves upward, the $3.50 – $3.60 – $3.78 levels can be monitored as resistance points. However, if the price falls to new lows, it may indicate that selling pressure could deepen. In this case, the $3.39 and $3.33 levels stand out as strong support zones. In particular, in the event of a sharp sell-off, a pullback to $3.23 appears technically possible.
According to Simple Moving Averages (SMA) data, Sui’s average price is currently at the $3.42 level. The price remaining above this level indicates that the current uptrend could technically continue.
Supports: 3.23 – 3.33 – 3.39
Resistances: 3.50 – 3.60 – 3.78
Legal Notice
The investment information, comments, and recommendations contained herein do not constitute investment advice. Investment advisory services are provided individually by authorized institutions taking into account the risk and return preferences of individuals. The comments and recommendations contained herein are of a general nature. These recommendations may not be suitable for your financial situation and risk and return preferences. Therefore, making an investment decision based solely on the information contained herein may not produce results in line with your expectations.

