
Technical Analysis – September 30, 2025
BTC/USDT
As the risk of a government shutdown in the US increases, talks between Trump and congressional leaders failed to reach an agreement, and a plan was announced that 11 out of 24 agencies could suspend operations. Trump announced that a 100% tariff could be imposed on foreign-made films. While Fed officials used different tones on interest rate policy, the Department of Commerce announced new export control rules for companies on the blacklist. A bill introduced in Wisconsin proposes to remove the licensing requirement for crypto activities, while Bitcoin ETFs recorded a net inflow of $522 million.
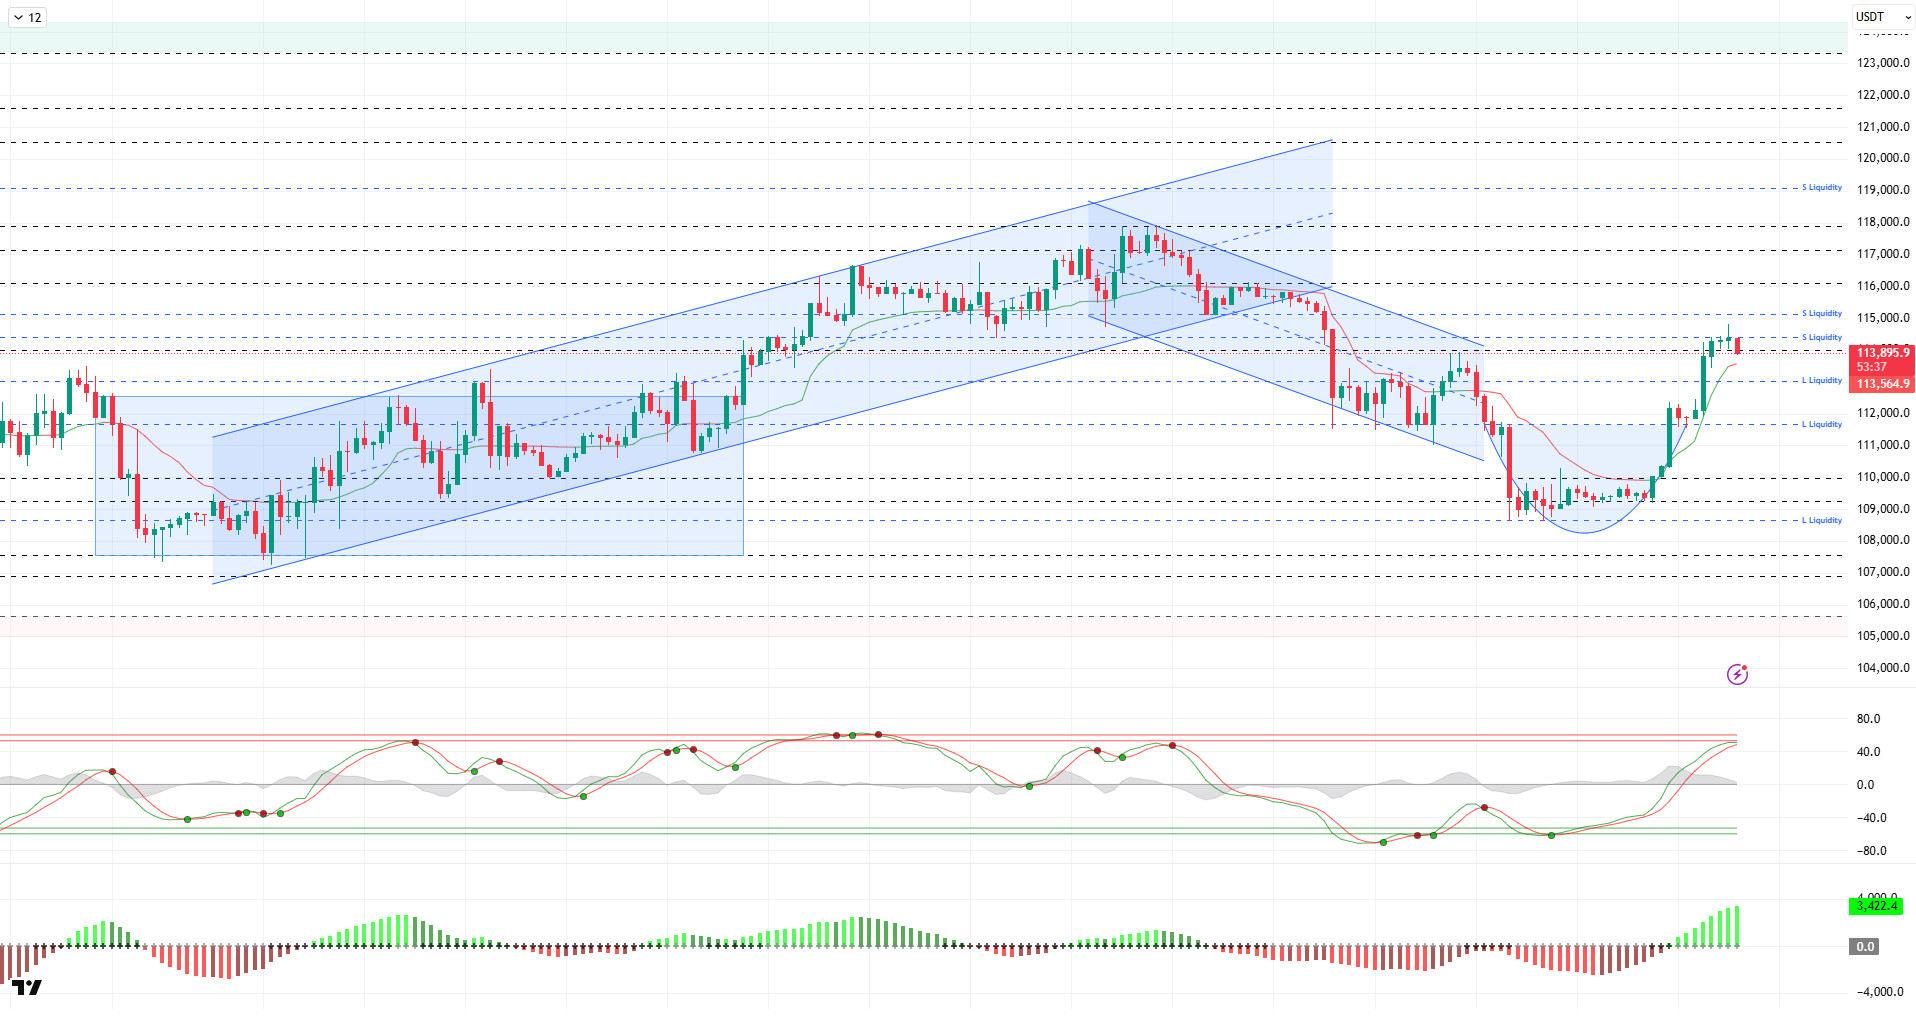
Looking at the technical picture, BTC continues to carry its upward momentum, which it captured with its cup formation, higher. In the previous analysis, BTC, which was trading at 112,000 levels, tested the 114,800 level with its recorded increases. Then, facing some selling pressure, the price fell back to 114,000 levels and continues to trade there.
Technical indicators show that the Wave Trend oscillator (WT) has crossed the middle band of the parallel channel into the overbought zone, in line with the buy signal it gave in the oversold zone. Along with the weakening buy signal, this points to a renewed short-term trend reversal. The Squeeze Momentum (SM) indicator’s histogram continues its momentum within the positive zone. The Kaufman moving average is currently trading below the price at the 113,500 level.
According to liquidation data, short positions concentrated in the 114,000–115,000 range were liquidated with the latest rise. However, accumulation is being observed again in sell-side transactions, and this concentration is particularly evident at the 115,100 level. On the buy side, short-term positions are concentrated at the 113,000 level, while long-term trades are concentrated at the 111,500 level. Over the past 24 hours, a total of $62 million in short positions and approximately $7 million in long positions were liquidated. The total liquidation amount in the overall market reached $311 million.
In summary, looking at the key developments, the decline in expectations for interest rate cuts, coupled with US macroeconomic data reducing the risk of recession, led to the loss of a positive short-term environment for the market. Differing views among Fed members on interest rate cuts and the reintroduction of tariffs have emerged as pessimistic developments for the market. On the other hand, with October approaching, which has been dominated by gains in crypto, the price has rebounded from its low. Technically, BTC has rebounded with the formation of a cup pattern. Liquidity data shows that increasing sell-side transactions have become the target. In this context, the 114,000 level is being monitored as a resistance point in the continuation of the upward movement, while we will monitor the 112,600 and then 111,400 support levels in the event of a possible selling pressure.
Supports: 112,600 – 111,400 – 110,000
Resistances: 114,000 – 115,000 – 116,000
ETH/USDT
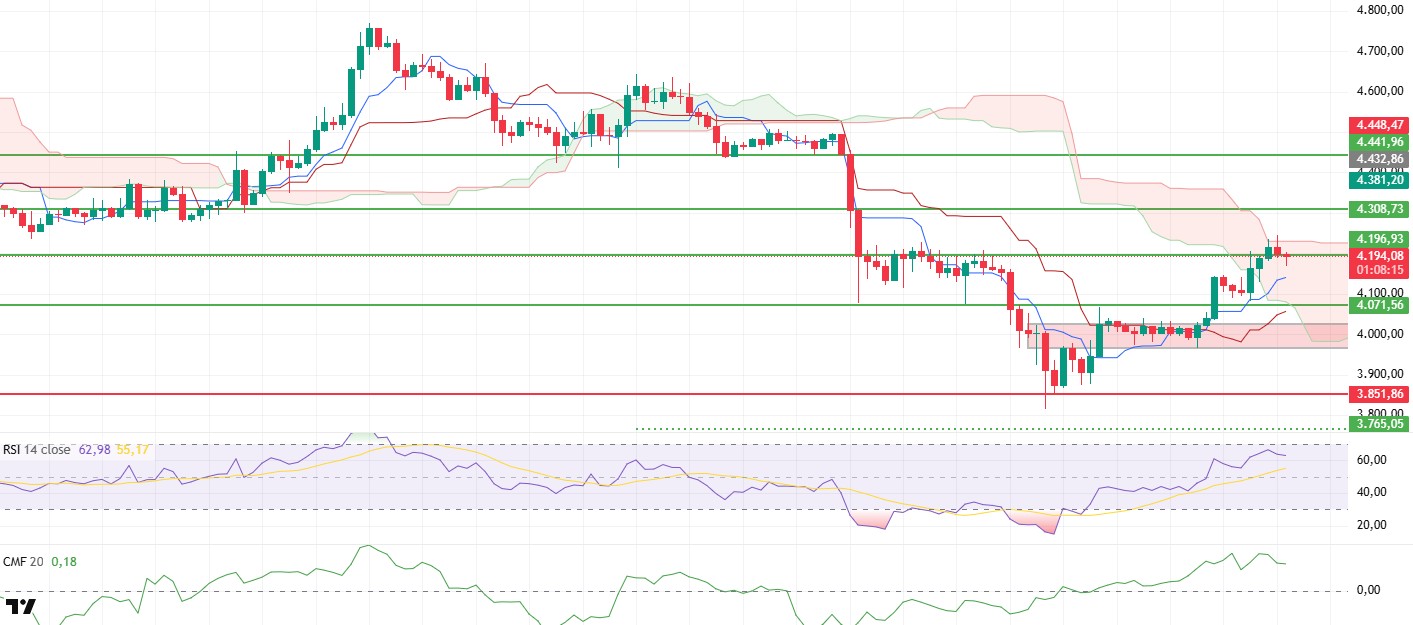
The ETH price surpassed the $4,140 level yesterday evening, continuing its expected upward momentum and climbing to $4,244. However, selling pressure from this region caused the price to retreat, resulting in a corrective move towards the critical $4,196 level. This movement shows that buyers maintain control over the market, but sellers are also entering at higher levels. In particular, maintaining the $4,196 level ensures that the price stabilizes in the short term without losing momentum.
When examining the Ichimoku indicator, the price entering the kumo cloud is a technically noteworthy development. However, the fact that it continues to remain above the Tenkan and Kijun levels has produced a trend reversal signal. This outlook indicates that the market has begun to form an upward structure again and that buyers have the advantage in the short term. The most critical threshold here is the upper band of the kumo cloud at the $4,230 level. If the price breaks this level, it could reinforce the trend reversal and pave the way for faster gains. In such a scenario, the $4,308 resistance becomes the first target, and if this level is exceeded, new price levels around the $4,350 region could come into play.
Although the Chaikin Money Flow (CMF) indicator shows a volatile appearance, remaining in positive territory confirms that liquidity inflows into the market are continuing and that the bullish scenario is still supported. This reflects that new funds are entering the market and that buyer appetite is stronger than in the previous period.
On the other hand, the Relative Strength Index (RSI) approaching the overbought zone keeps the possibility of a technical correction in the short term on the agenda. This also reminds us that profit-taking in the market may increase and that pullbacks could deepen if the price falls below $4,196. In such a scenario, the $4,140 level will be monitored as initial support.
The overall technical outlook suggests that if the price remains above the $4,230 level, the uptrend could regain momentum and test the $4,308 resistance level. However, closing below $4,196 could cause the market to weaken in the short term. Therefore, the level at which the price finds equilibrium will be decisive in determining the direction in the coming sessions.
Top of Form
Below the Form
Supports: 4,071 – 3,851 – 3,672
Resistances: 4,196 – 4,308 – 4,441
XRP/USDT
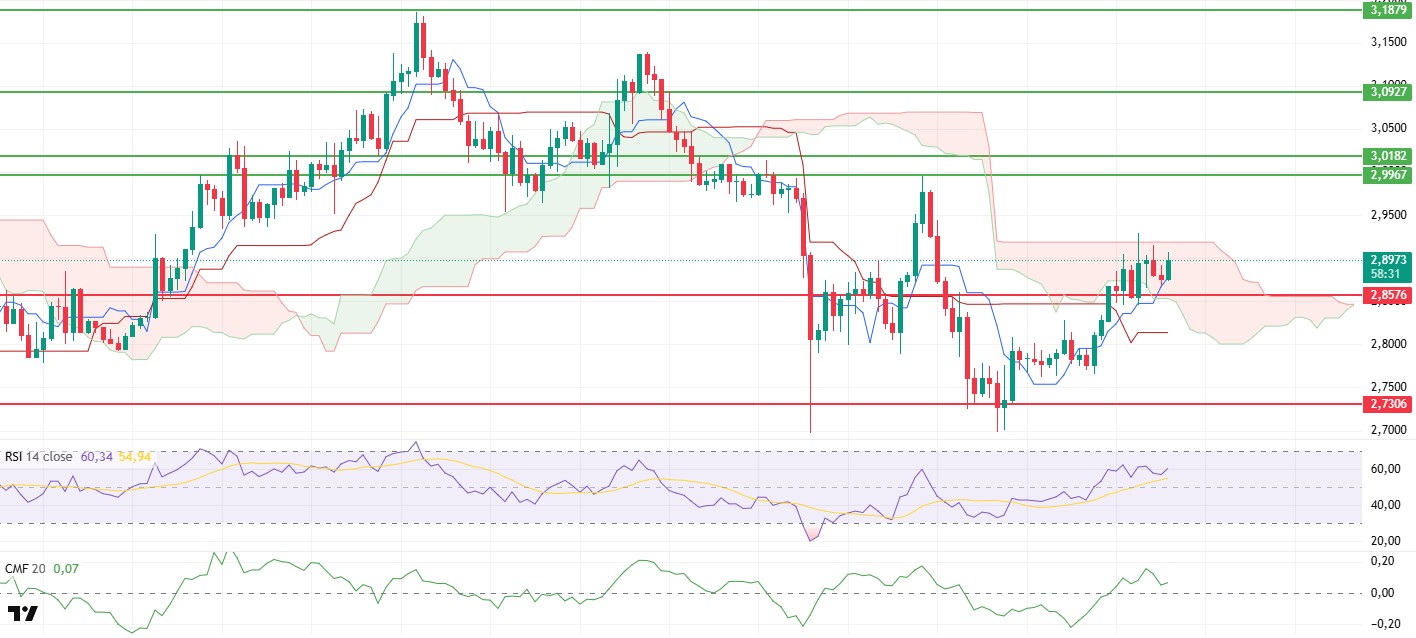
The XRP price broke above the previously highlighted critical level of $2.8576 yesterday evening, launching an upward attack and moving above the upper band of the cloud at $2.9193. XRP, currently priced around $2.90, continues to show positive signals in technical indicators. This outlook indicates that buyers remain dominant in the market and the upward trend is continuing.
The Chaikin Money Flow (CMF) indicator continues to remain in positive territory despite its volatile course. This indicates that liquidity inflows into the market are continuing and that the bullish scenario remains valid.
When examining the Ichimoku indicator, it is noteworthy that the price is moving within the kumo cloud and above the Tenkan level. This outlook strengthens the short-term positive trend structure and confirms the continuation of upward potential. In particular, the price’s continued hold within the cloud shows that buyers are keeping momentum alive.
In the short term, the $2.8576 level is the most critical threshold. As long as prices remain above this level, they are expected to move towards the main resistance zone at $2.99. Conversely, a loss of the $2.8576 level could weaken momentum and trigger more aggressive selling. Overall, positive signals from technical indicators and the price managing to stay above strong support levels are maintaining upward expectations in the short term . However, it should not be forgotten that any closes below $2.8576 could disrupt market equilibrium.
Supports: 2.8570 – 2.7306 – 2.6513
Resistances: 2.9183 – 2.9967 – 3.0927
SOL/USDT
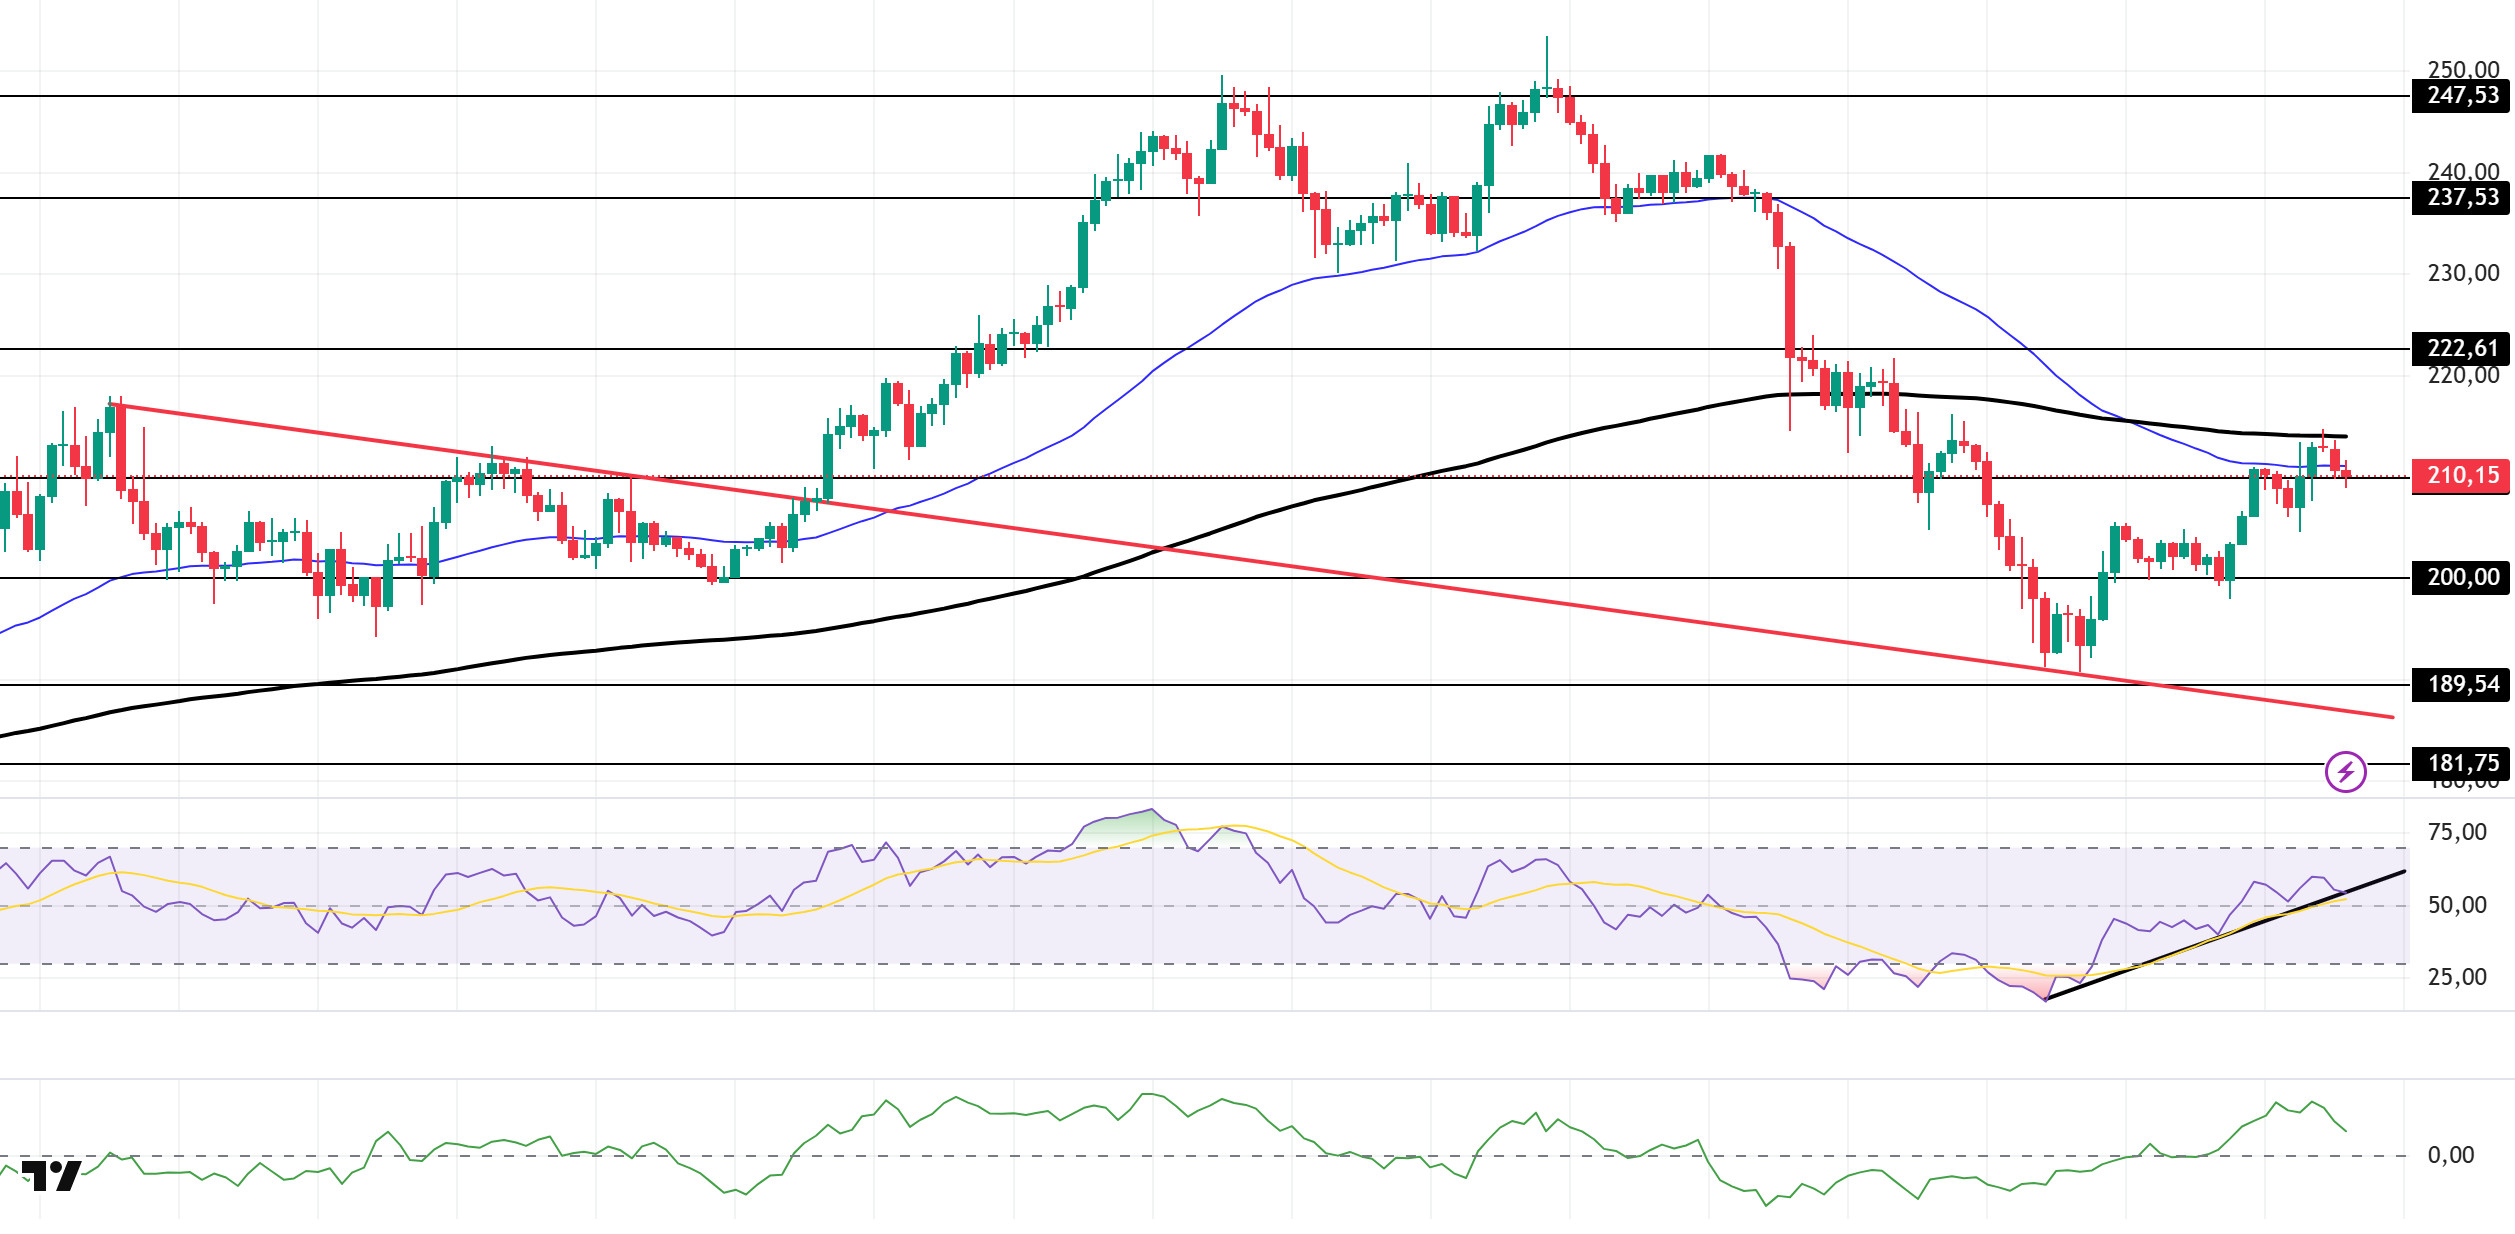
The SOL price continues its horizontal trend. The asset remains in the upper region of the downward trend that began on August 29. Currently, the price, which is facing resistance at the 200 EMA (Black Line) moving average, has experienced a slight pullback and has started to trade below the 50 EMA (Blue Line) moving average. If the pullback continues, the $200.00 level can be monitored. In the event of candle closes above the 200 EMA, the $222.61 level should be monitored.
On the 4-hour chart, it remained below the 50 EMA (Exponential Moving Average – Blue Line) and 200 EMA (Black Line). This indicates a possible downward trend in the medium term. At the same time, the price being below both moving averages shows us that the market is in a downward trend in the short term. The Chaikin Money Flow (CMF-20) remained in positive territory. However, a decrease in money inflows could push the CMF into negative territory. The Relative Strength Index (RSI-14) remained in positive territory. It also continues to be in the upper region of the upward trend that began on September 25 and is currently testing this area as support. In the event of an uptrend driven by macroeconomic data or positive news related to the Solana ecosystem, the $222.61 level stands out as a strong resistance point. If this level is broken upwards, the uptrend is expected to continue. In the event of pullbacks due to developments in the opposite direction or profit-taking, the $200.00 level may be tested. A decline to these support levels could increase buying momentum, presenting a potential opportunity for an upward move.
Supports: 209.93 – 200.00 – 189.54
Resistances: 222.61 – 237.53 – 247.53
DOGE/USDT
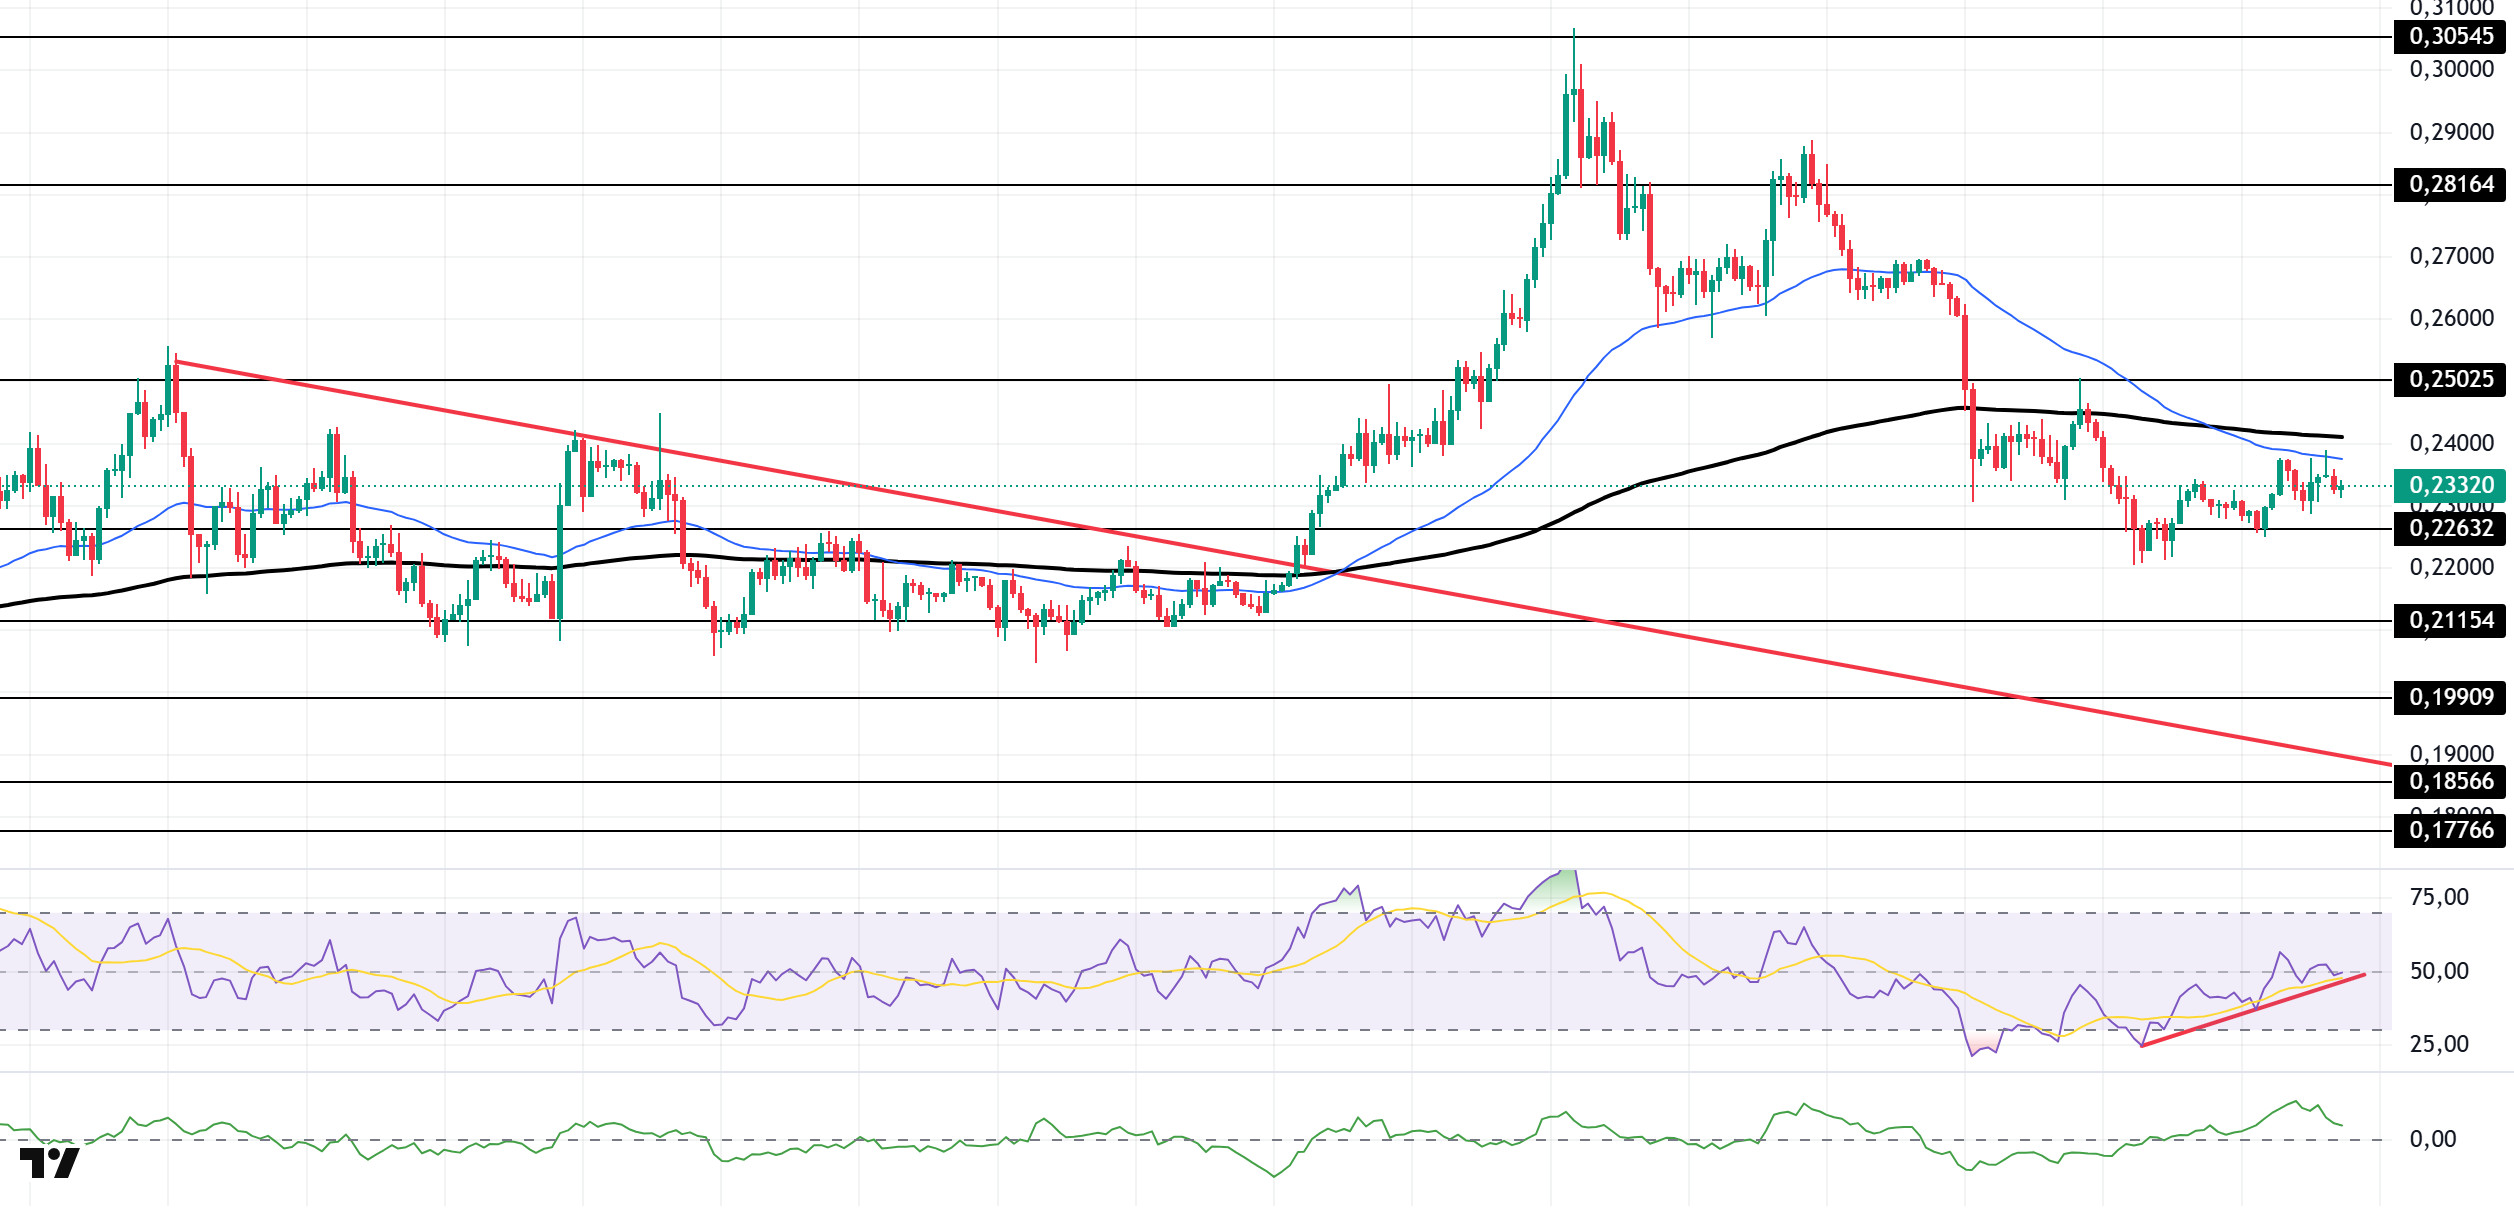
The DOGE price continues its sideways movement. The asset remained above the downward trend that began on August 14. Testing the strong support level of $0.22632 as support, the price failed to break through and experienced an uptrend. As of now, it has tested the 50 EMA (Exponential Moving Average – Blue Line) moving average as resistance and experienced a slight pullback from there. The moving average may test the $0.25025 level as resistance in candle closes above it. If a pullback begins, the $0.22632 level can be monitored.
On the 4-hour chart, the 50 EMA (Exponential Moving Average – Blue Line) remained below the 200 EMA (Black Line). This indicates that a medium-term downward trend has begun. The price being below both moving averages indicates a downward trend in the short term. The Chaikin Money Flow (CMF-20) managed to stay in positive territory. Additionally, a decrease in money inflows could push the CMF into negative territory. The Relative Strength Index (RSI-14) has fallen into negative territory and is currently testing the rising trend that began on September 25 as support. A break below this level could trigger selling pressure. In the event of potential upward movements driven by political developments, macroeconomic data, or positive news flow within the DOGE ecosystem, the $0.25025 level stands out as a strong resistance zone. Conversely, in the event of negative news flow, the $0.21154 level could be triggered. A decline to these levels could increase momentum and initiate a new wave of growth.
Supports: 0.22632 – 0.21154 – 0.19909
Resistances: 0.25025 – 0.28164 – 0.30545
TRX/USDT
As of September 29, 2025, the total amount of TRX staked is 44,586,668,243, which is 47.10% of the circulating supply. Compared to the previous day, there has been a decrease of approximately 0.01% in the amount staked. However, the market value of TRX has reached $31.9 billion.
Additionally, a total of 3,685,258 TRX was burned yesterday, and a net 54,454 TRX was added to the circulating supply. This situation is leading to increased inflationary pressure on Tron.
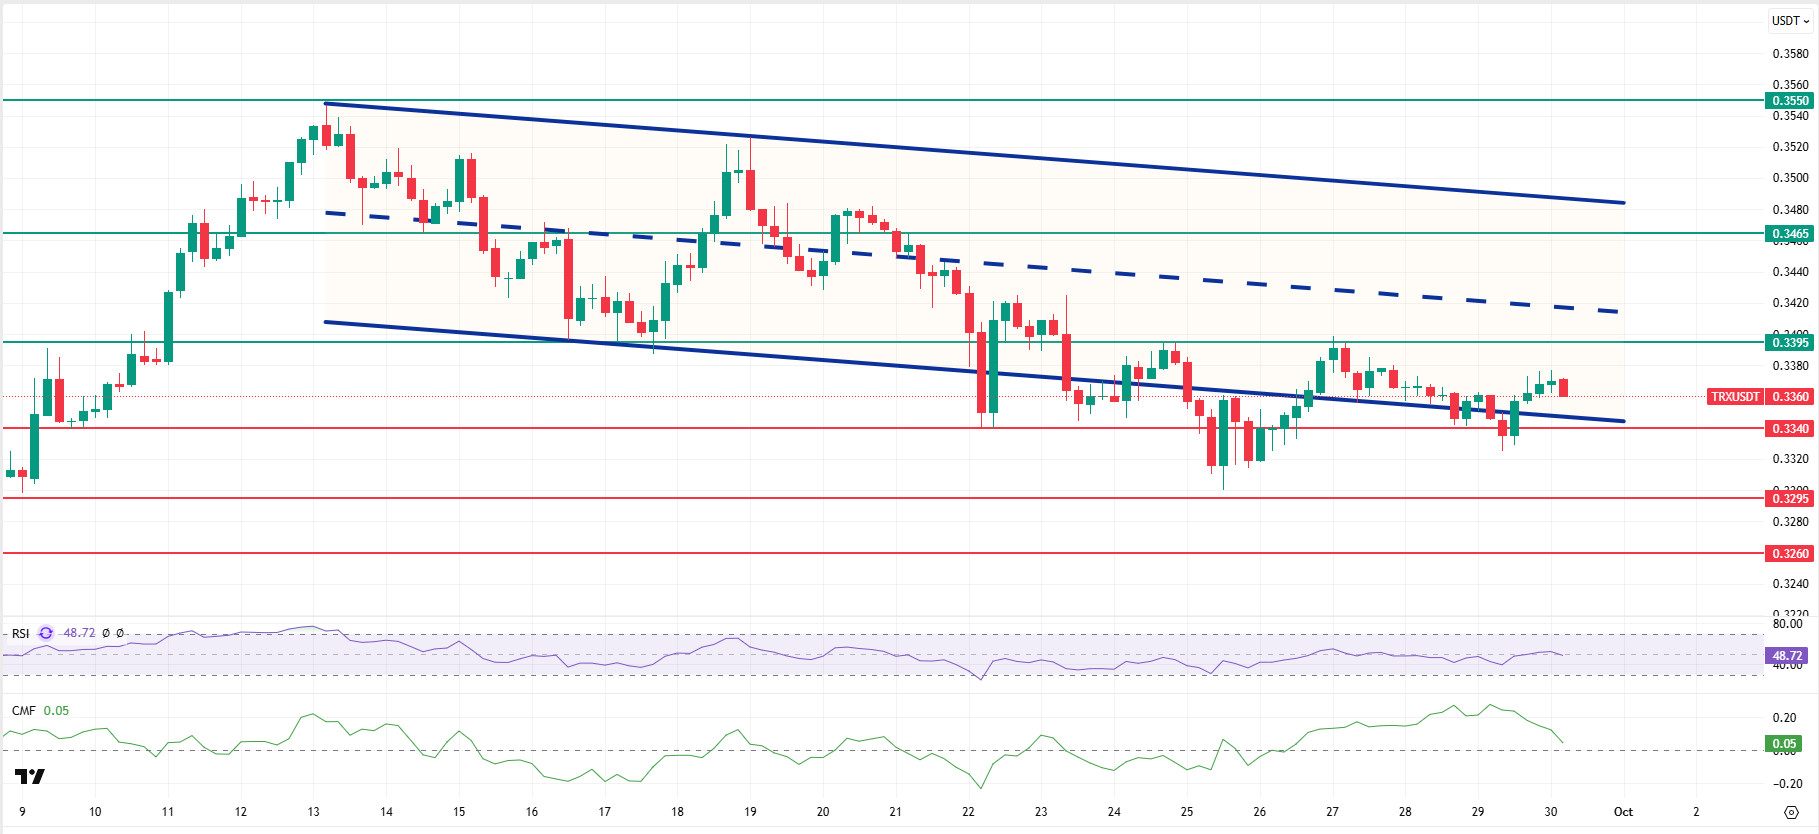
Technically speaking, TRX closed yesterday at 0.3368 following the previous day’s rise, retreated slightly in the morning hours, and is currently trading at 0.3360. Currently located at the lower band of the bearish channel, TRX is priced just above the 0.3340 support level on the 4-hour chart. The Relative Strength Index (RSI) value is 48, indicating a sell zone. In addition, the Chaikin Money Flow (CMF) indicator is above zero at 0.05, indicating increased cash inflows. This suggests that buyers are exerting more pressure on the market and that buying activity could gain momentum in the short term.
In light of all these indicators, TRX may rise slightly in the first half of the day, moving towards the middle band of the channel, given its current zone and CMF value. It could then test the 0.3395 resistance level. A candle close above the 0.3395 resistance could extend the uptrend, moving towards the upper band of the bearish channel and testing the 0.3465 resistance. If it fails to close above the 0.3395 resistance level and the CMF indicator moves into negative territory, it may decline slightly due to potential selling pressure and test the 0.3340 and 0.3295 support levels in sequence.
On the 4-hour chart, 0.3260 is an important support level, and as long as it remains above this level, the upward momentum is expected to continue. If this support is broken, selling pressure may increase.
Supports: 0.3340 – 0.3295 – 0.3260
Resistances: 0.3395 – 0.3465 – 0.3550
SHIB/USDT
Market data shows that risk appetite focused on Shiba Inu has signaled a recovery driven by liquidations. Approximately $433.28 million in liquidations were recorded across crypto in the last 24 hours, with $330 million of this being short-sided, indicating a release of selling pressure. According to CoinGlass data, 3,859,993,178 short positions were liquidated on the Shiba Inu side. A total of $91,880 worth of positions were closed on SHIB specifically, with $46,310 occurring in long trades and $45,570 in short trades. This unwinding of volume neutralized part of the pressure carried over from last week, strengthening the search for short-term equilibrium.
On the regulatory front, the US Securities and Exchange Commission’s new listing standards provided a framework that accelerated spot ETP listings for crypto assets that have been traded on a CFTC-supervised exchange for at least six months. Considering the 1k Shib SHB futures contract traded on Coinbase Derivatives since July 15, 2024, Shiba Inu meets this eligibility criterion. While this development makes the possibility of a spot SHIB ETF a concrete prospect, warnings are emerging that the increase in product numbers could intensify the capital raising race for issuers. On the investor side, the difficulty in understanding the differences between seemingly similar ETFs stands out as a noteworthy issue. In short, while the narrative of institutional access is gaining strength, ultimate success will depend on market dynamics such as investor demand, product quality, and distinctive positioning.
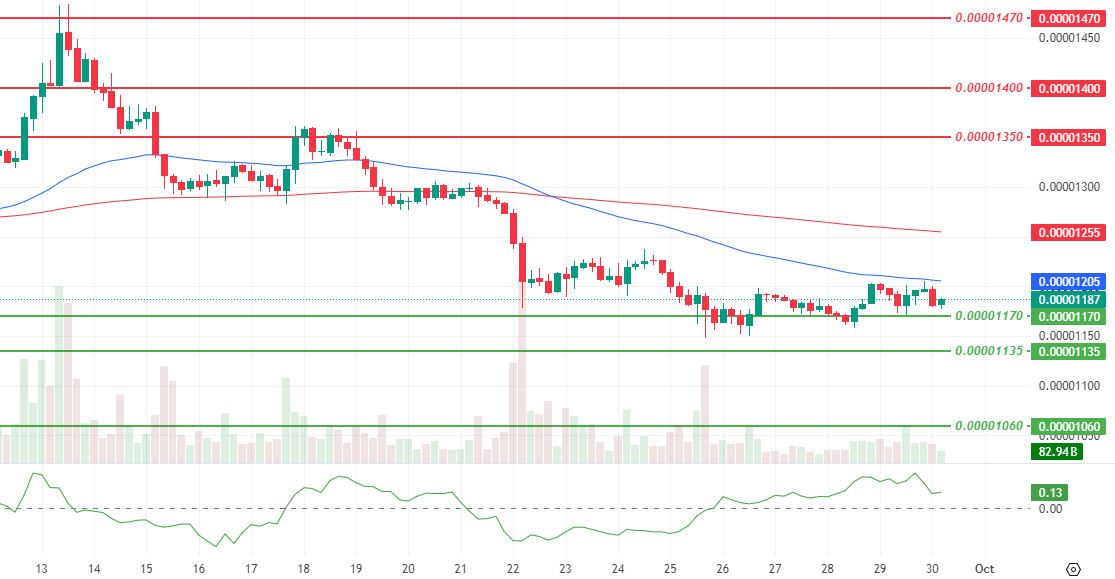
The technical outlook points to a cautious equilibrium. Compared to yesterday, momentum has retreated slightly, trading volume is increasing to a limited extent, and the Chaikin Money Flow (CMF) remains in positive territory but is weakening. The price continues to trade below the 50 and 200 Exponential Moving Averages (EMA). Yesterday’s reaction at the US open tested the EMA 50 threshold, but selling pressure pushed the price back to the $0.00001190 region. The intraday high of $0.00001205 retains its threshold status, and it is difficult to speak of strong momentum without four-hour closes above this level.
Key thresholds remain unchanged. For upward attempts, four-hour closes above $0.00001205 and especially above $0.00001240 are required. If this condition is met, intermediate resistance levels at $0.00001255 and $0.00001350 could come into play. On the downside, the $0.00001170 region stands out as the current defense line. Persistence below this level brings the $0.00001135 to $ support to the fore. If weakness deepens, the likelihood of retesting the $0.00001060 area increases. Although the CMF remains in positive territory, the slowdown in momentum and the failure to sustain above the moving averages suggest that pricing is currently seeking a reactive equilibrium. (EMA50: Blue line, EMA200: Red line)
Supports: 0.00001170 – 0.00001135 – 0.00001060
Resistances 0.00001350 – 0.00001400 – 0.00001470
Legal Notice
The investment information, comments, and recommendations contained herein do not constitute investment advice. Investment advisory services are provided individually by authorized institutions taking into account the risk and return preferences of individuals. The comments and recommendations contained herein are of a general nature. These recommendations may not be suitable for your financial situation and risk and return preferences. Therefore, making an investment decision based solely on the information contained herein may not produce results in line with your expectations.


