
Technical Analysis
BTC/USDT
Fed member Austan Goolsbee stated that interest rates could stabilize around 3% in the long term and that they would be satisfied if inflation returned to 2%. The US second-quarter current account deficit showed an improvement above expectations at -$251.3 billion. According to Glassnode data, long-term Bitcoin investors’ total profit in this cycle reached 3.40 million BTC, setting a historic record. Later in the day, statements from US President Trump and Powell will be decisive for the market.
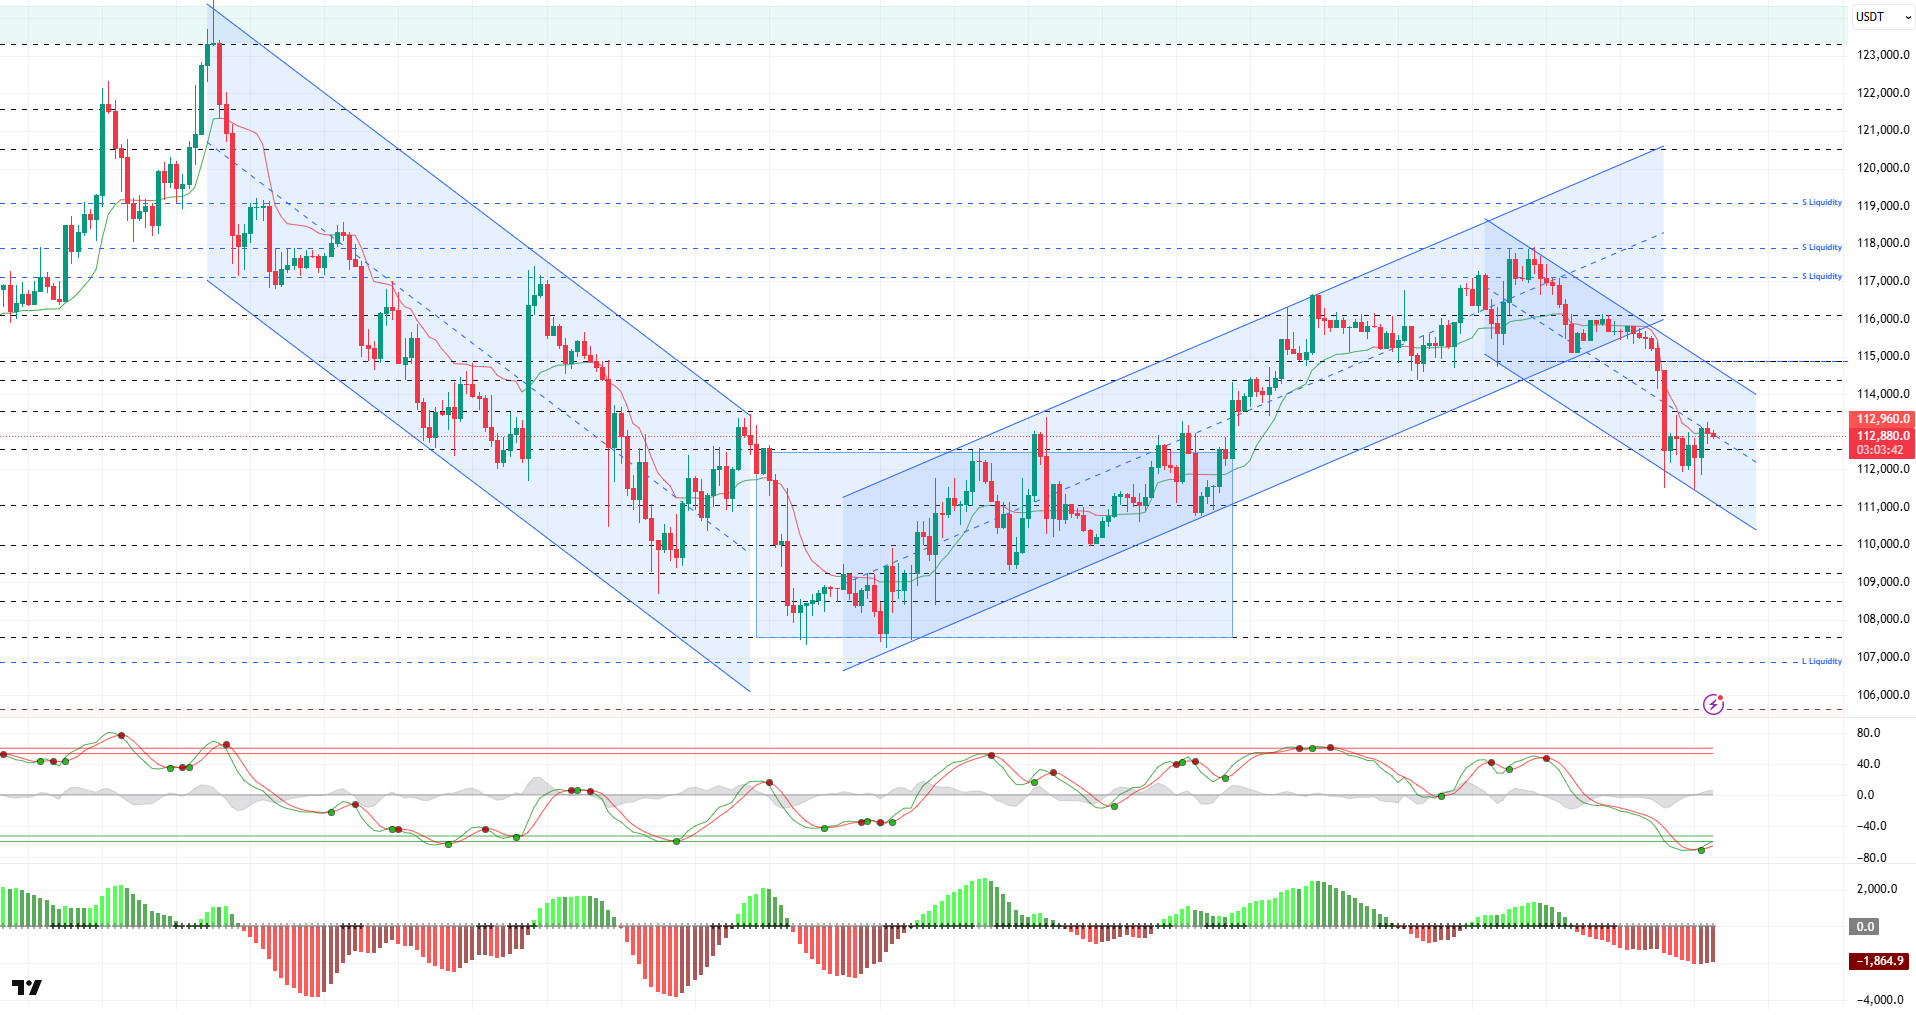
Looking at the technical picture, BTC, which lost its upward trend structure, fell back to the 111,400 level. In the previous analysis, the price, which was trying to recover, struggled but failed to break through the 113,000 level and tested the 111,400 level again. Then, regaining momentum, the price reached the 113,000 level within the downward trend structure.
Technical indicators show the Wave Trend oscillator (WT) giving a buy signal in the oversold zone, preparing for a trend reversal, while the Squeeze Momentum (SM) indicator’s histogram is gaining momentum in negative territory. The Kaufman moving average is currently trading below the price at the 112,900 level.
Looking at liquidation data, short-term trades attempted to accumulate around the 111,500 band but were liquidated by yesterday’s spike movement. In a broader context, the scarcity of short-term buy-side trades is noteworthy. The selling level shows slight density in the 113,500 – 114,000 band, while the long term has recorded significant density in the 117,800 – 119,000 region.
In summary, while there is no clear fundamental catalyst for recent sales, the decline in futures-driven selling pressure appears to be deepening the downturn. Although the overall positive picture in the market is being maintained, developments later in the day will be decisive in terms of a trend reversal. On the technical side, the break below the 115,000 level has broken the upward channel. However, a re-cross above this level could eliminate the downward structure, and if the price gains momentum, the upward movement could continue. In terms of liquidity data, the recent decline has cleared the buying levels, while a significant increase in selling levels stands out. In this context, for the price to recover, it may first need to regain the 114,000 level, followed by closes above 115,000. However, if selling pressure persists and the 112,600 level is broken, the next important support level to watch will be 111,400.
Support levels: 112,600 – 111,400 – 110,000
Resistance levels: 114,000 – 115,000 – 116,100
ETH/USDT
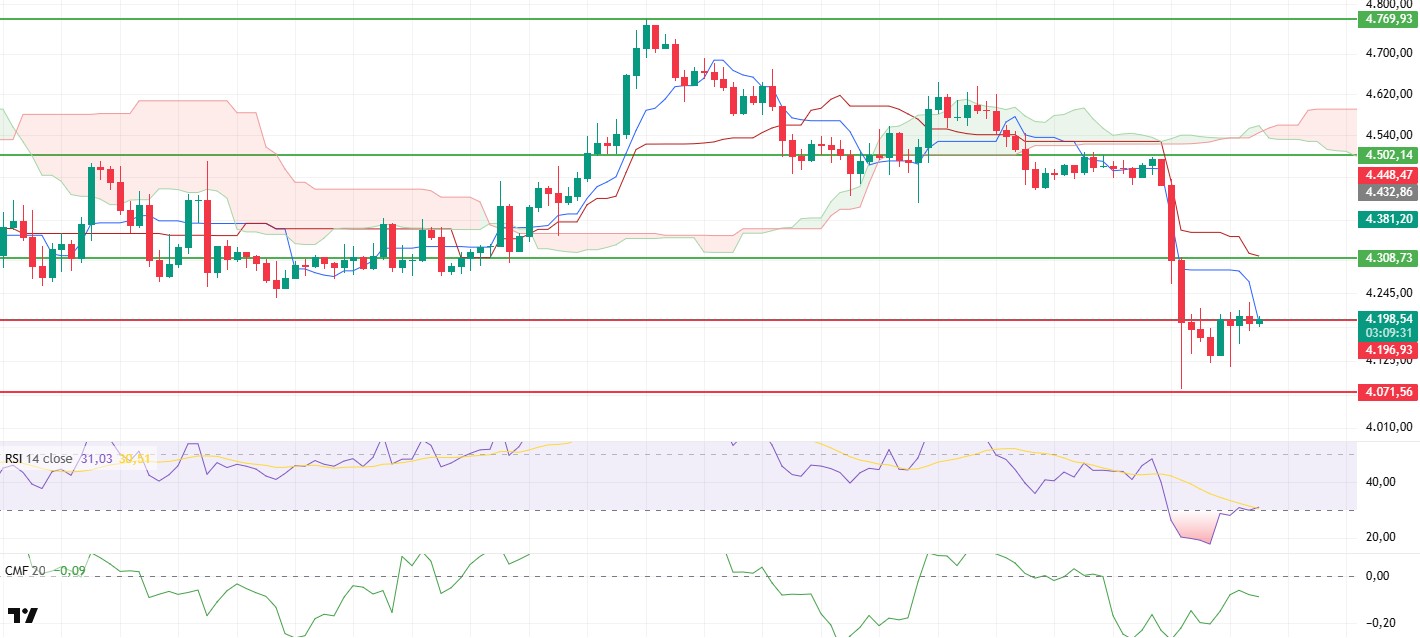
Throughout the day, a horizontal movement was observed around the $4,196 level. As emphasized in the morning analysis, this level continues to maintain a critical resistance position. Increased volatility is expected, especially in the evening hours, with the speech to be delivered by US Federal Reserve Chairman Powell.
On the liquidity side, it is noteworthy that the Chaikin Money Flow (CMF) indicator, which has been rising since the morning hours, has been moving sideways after approaching the zero line. This outlook indicates that buying and selling pressure has balanced out during the day and that the market is in a state of uncertainty.
On the momentum side, the Relative Strength Index (RSI) indicator remains at the oversold level, hovering around 31. This indicates that the price is weak in the short term and that more momentum is needed for upward movements to be sustained.
From the Ichimoku indicator perspective, the price regaining the tenkan level supports the short-term positive outlook. This development signals that upward momentum could accelerate if the critical resistance zone is breached.
As a result, Powell’s speech and whether the $4,196 level will be broken in either direction are critical in determining the market’s direction. In an upward scenario, the first target is the $4,308 level, while in a potential downward scenario, the $4,070 level is the main support level.
Top of Form
Below the Form
Support levels: 4,196 – 4,071 – 3,940
Resistance levels: 4,308 – 4,502 – 4,769
XRP/USDT
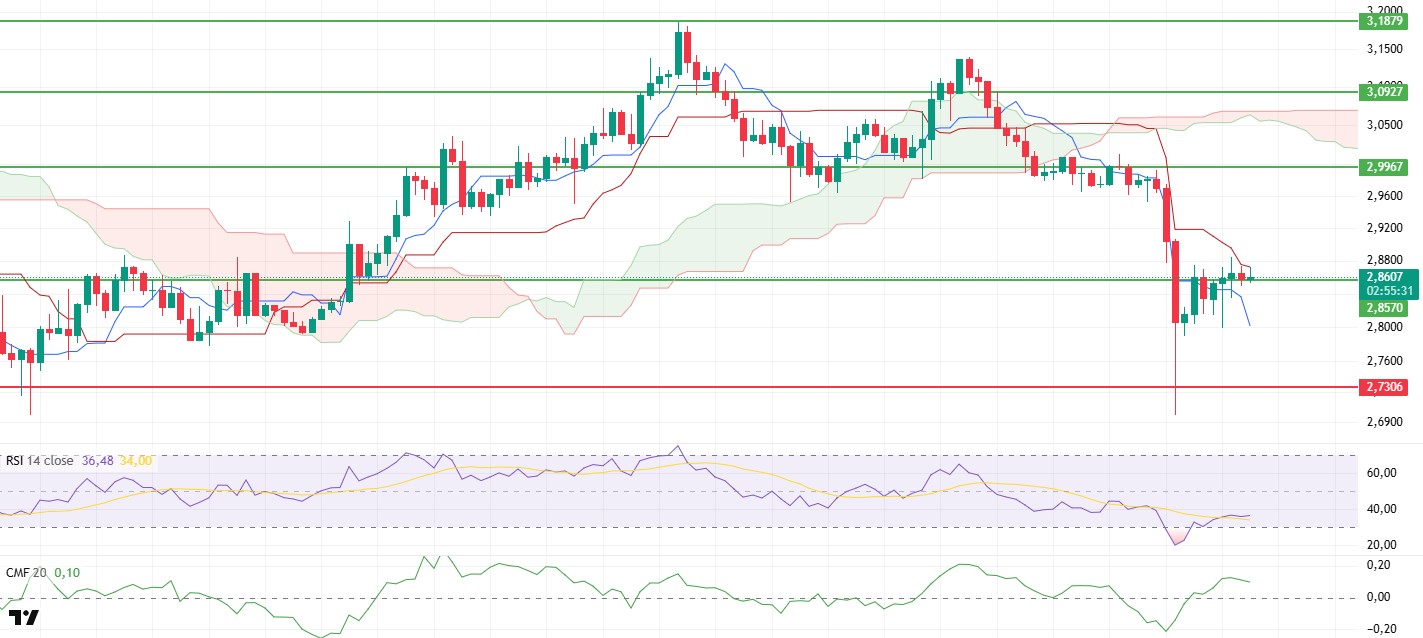
After a weak performance since the weekend, XRP recovered in the morning hours and attempted to hold above the $2.85 level, regaining it during the day. The price is currently moving sideways at this critical level, and the market continues to search for direction.
On the liquidity front, the Chaikin Money Flow (CMF) indicator is maintaining its upward momentum. This outlook indicates that liquidity inflows into the market are continuing and buyers remain active.
The momentum front also presents a positive picture. The Relative Strength Index (RSI) indicator has moved out of the oversold zone and continues its upward trend. This situation can be interpreted as a positive signal indicating that price movements may continue upward.
On the technical side, the Kijun level stands out in the Ichimoku indicator. If XRP, which has been stuck in this region during the day, can break above the $2.8750 level, it is possible that the positive outlook will strengthen in the short term and the price will continue its upward movement.
As a result, the $2.85 level remains a critical support level for the remainder of the day. Sustained trading above this level could allow the price to test resistance levels at $2.8750, followed by $2.92 and $2.99. However, a drop below $2.85 could reignite selling pressure and cause the price to retreat towards the $2.73 level.
Support levels: 2.8570 – 2.7306 – 2.6513
Resistance levels: 2.9967 – 3.0927 – 3.1879
SOL/USDT
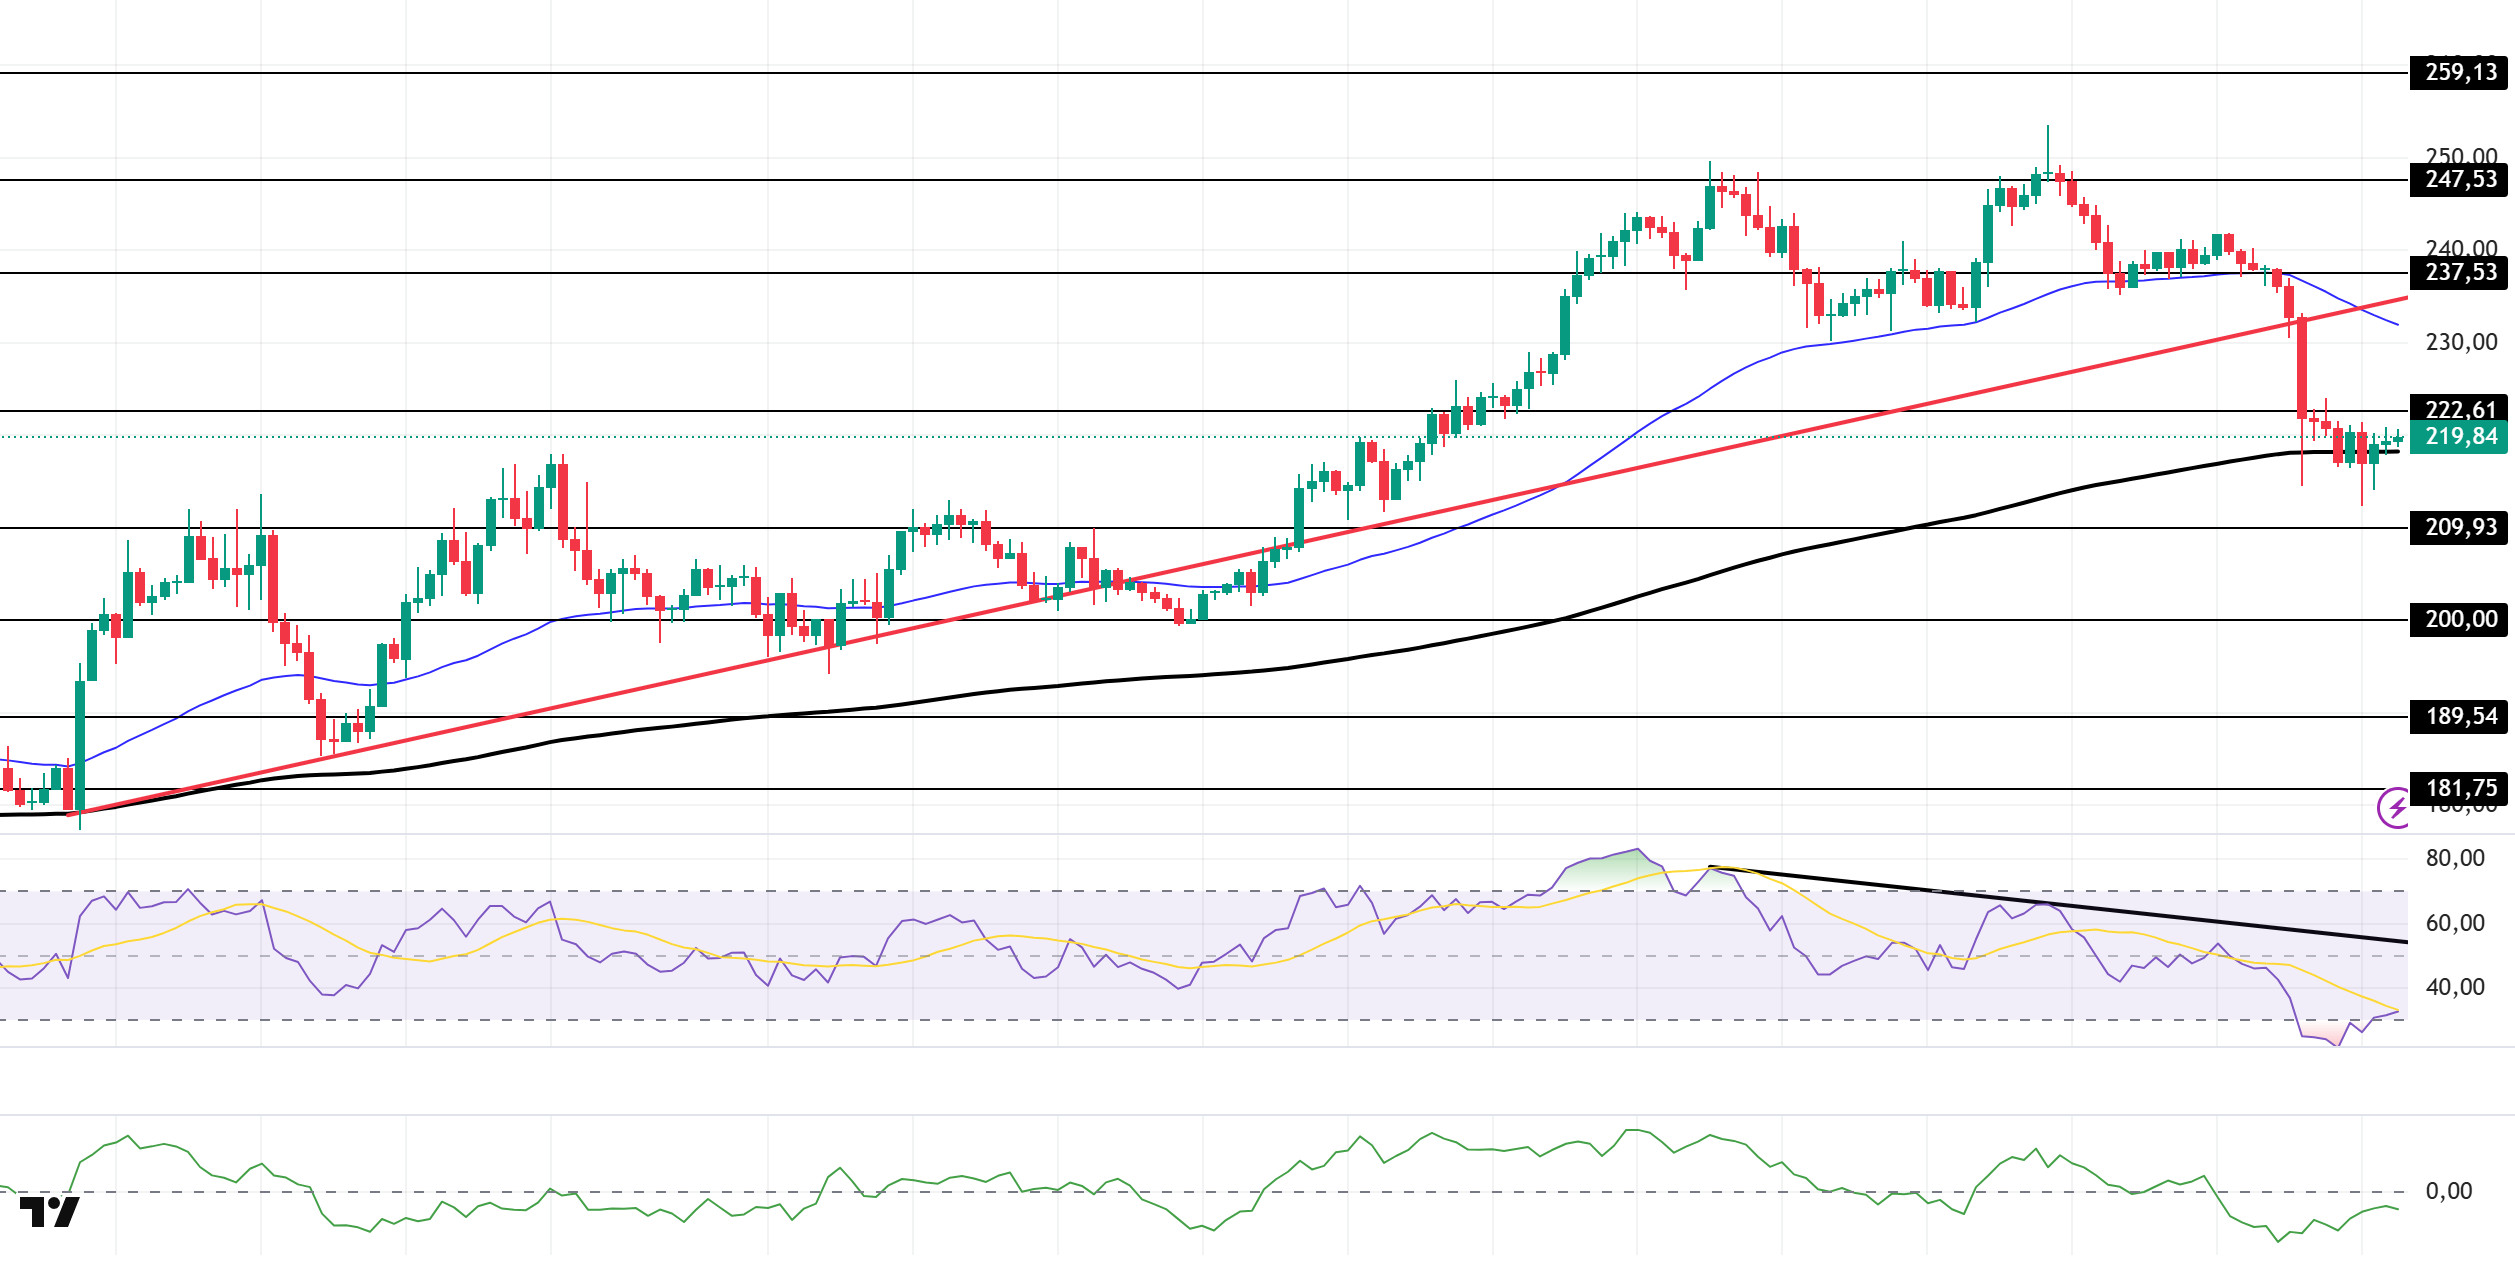
The SOL price traded sideways during the day. The asset deepened its decline by breaking below the strong support level of $237.53 and the 50 EMA (Exponential Moving Average – Blue Line) moving average. Breaking below the upward trend that began on August 22, the price is currently testing the 200 EMA (Black Line) moving average as support. If it moves above this moving average, it may test the $237.53 level as resistance. If the pullback continues, it may test the $209.93 level as support.
The price remained above the 50 EMA (Exponential Moving Average – Blue Line) and 200 EMA (Black Line) on the 4-hour chart. This indicates that the upward trend may continue in the medium term. At the same time, the price being below both moving averages shows us that the market is trending downward in the short term. The Chaikin Money Flow (CMF-20) remained in negative territory. However, an increase in cash inflows could push the CMF into positive territory. The Relative Strength Index (RSI-14) remained in oversold territory. This could lead to minor corrections. At the same time, it continued to remain below the downward trend that began on September 14, indicating that selling pressure continues. If there is an upturn due to macroeconomic data or positive news related to the Solana ecosystem, the $237.53 level stands out as a strong resistance point. If this level is broken upwards, the uptrend is expected to continue. In the event of pullbacks due to developments in the opposite direction or profit-taking, the $200.00 level could be tested. A decline to these support levels could increase buying momentum, presenting a potential upside opportunity.
Support levels: 209.93 – 200.00 – 189.54
Resistance levels: 222.61 – 237.53 – 247.53
DOGE/USDT
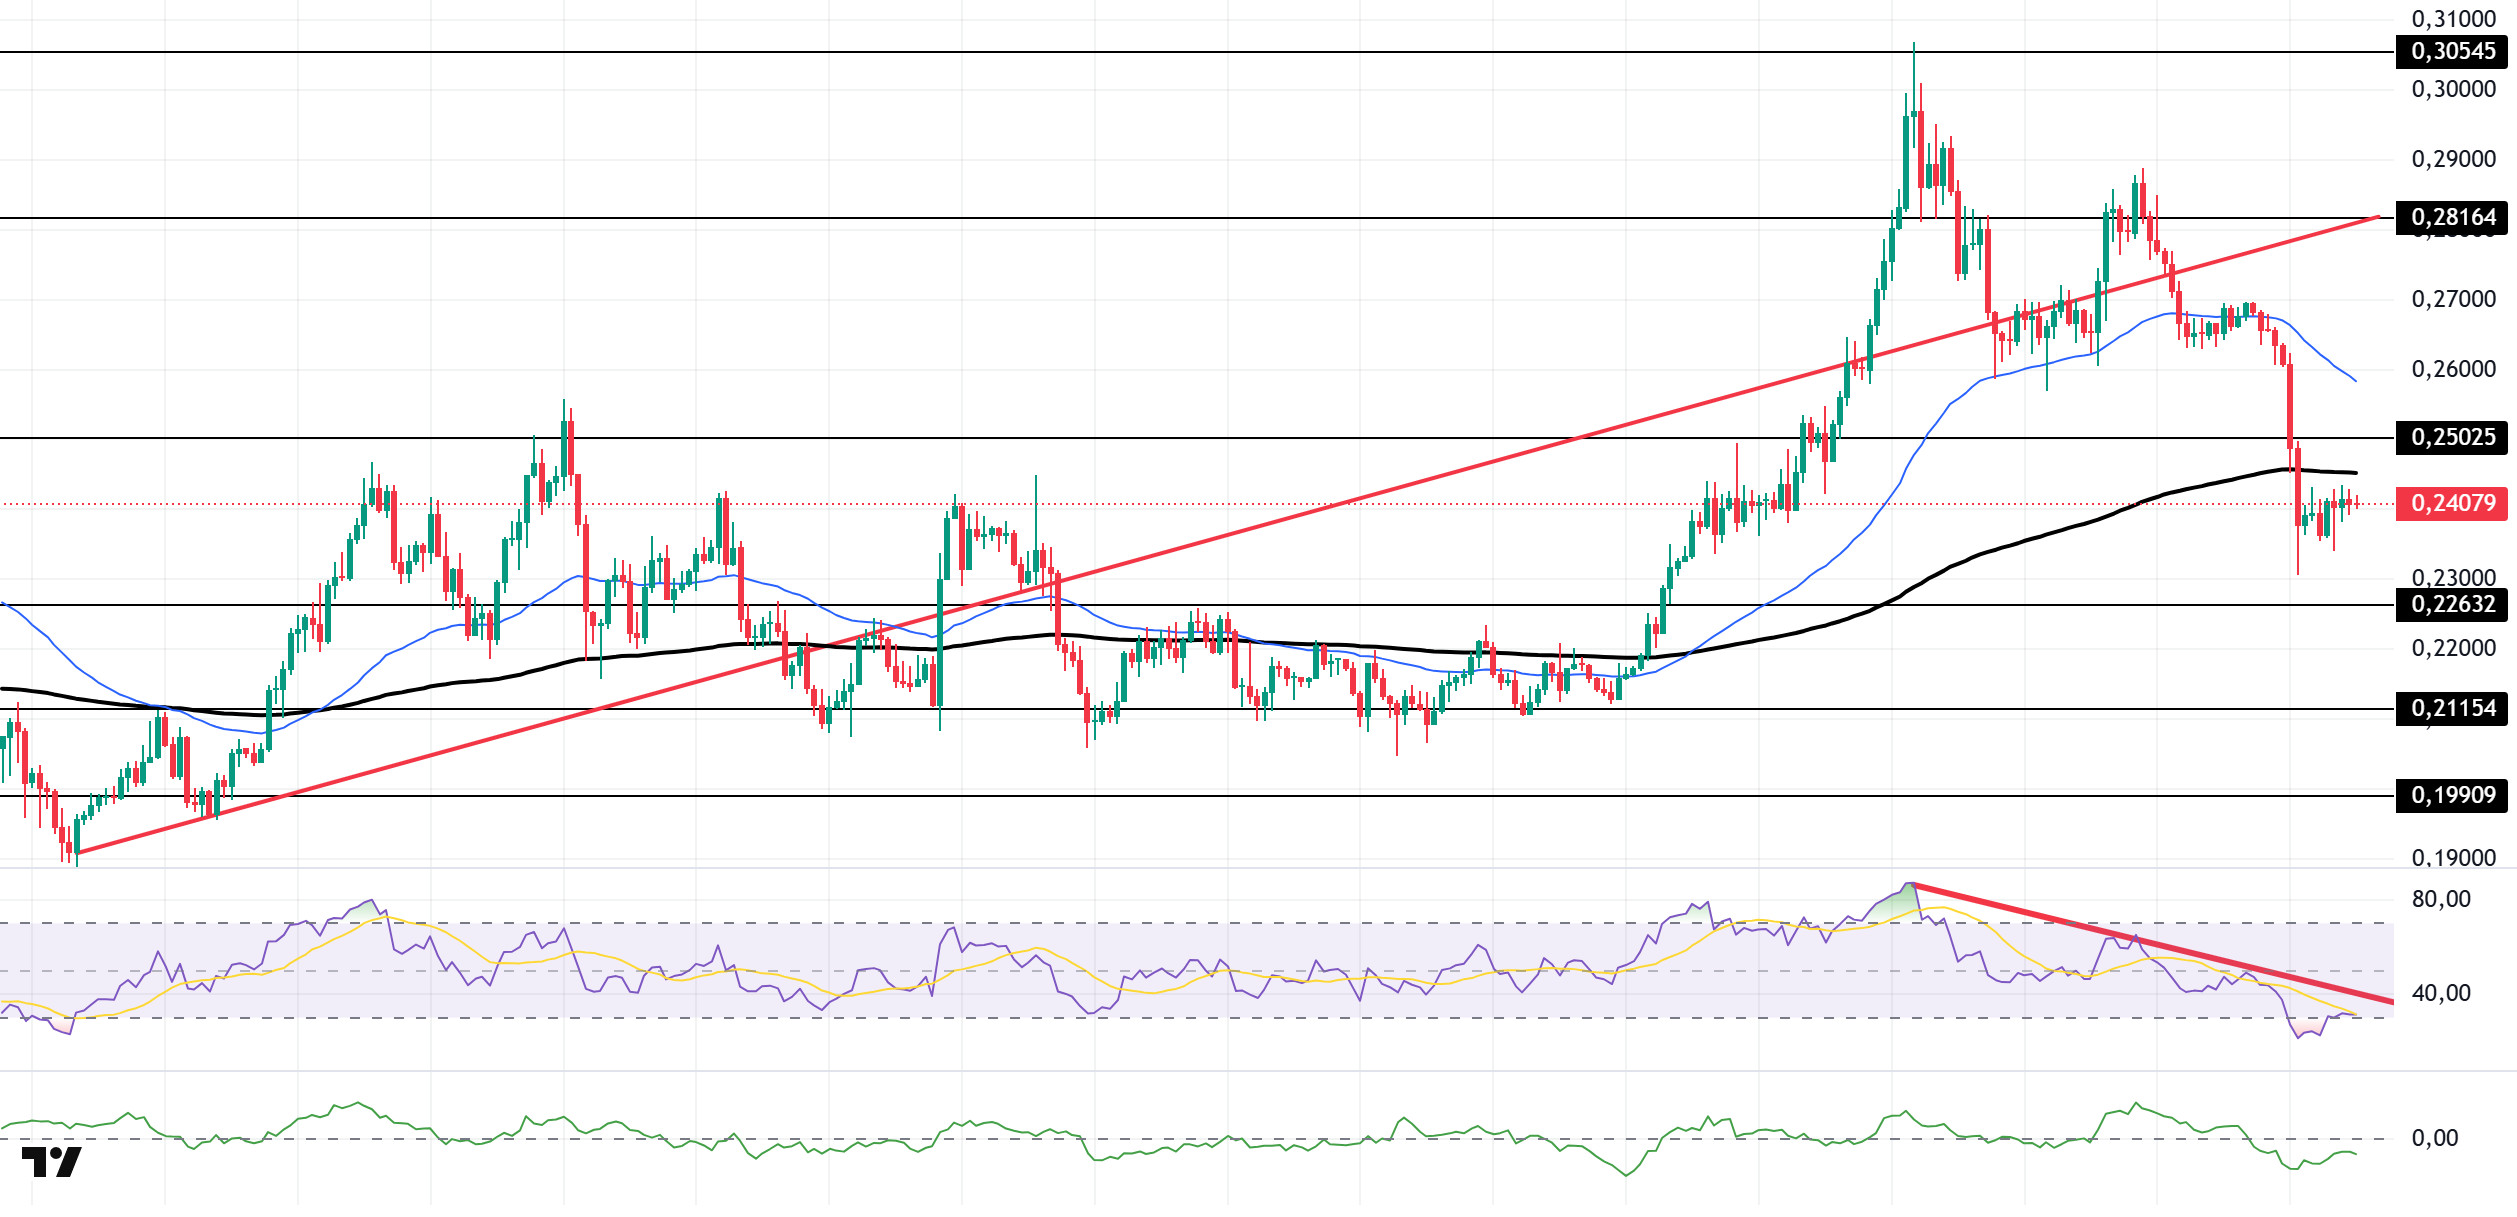
The DOGE price traded sideways during the day. The asset tested the strong support level of $0.25025 and broke below it, moving into the lower region of the 200 EMA (Exponential Moving Average – Black Line). Currently remaining below the 200 EMA moving average, the price could test the $0.22632 level if the pullback continues. In the event of a potential rise, the $0.25025 level should be monitored as resistance.
On the 4-hour chart, the 50 EMA (Exponential Moving Average – Blue Line) remained above the 200 EMA (Black Line). This indicates that the medium-term upward trend is continuing. The price being below both moving averages, however, suggests a short-term downward trend. The Chaikin Money Flow (CMF-20) remained in negative territory. Additionally, a decrease in money inflows could push the CMF deeper into negative territory. The Relative Strength Index (RSI-14) is in the oversold zone. This could lead to an upward correction. At the same time, it continued to be in the lower region of the downtrend that began on September 13, indicating that selling pressure continues. In the event of a rise due to political developments, macroeconomic data, or positive news flow in the DOGE ecosystem, the $0.28164 level stands out as a strong resistance zone. Conversely, in the event of negative news flow, the $0.21154 level could be triggered. A decline to these levels could increase momentum and initiate a new wave of growth.
Support levels: $0.22632 – $0.21154 – $0.19909
Resistance levels: 0.25025 – 0.28164 – 0.30545
TRX/USDT
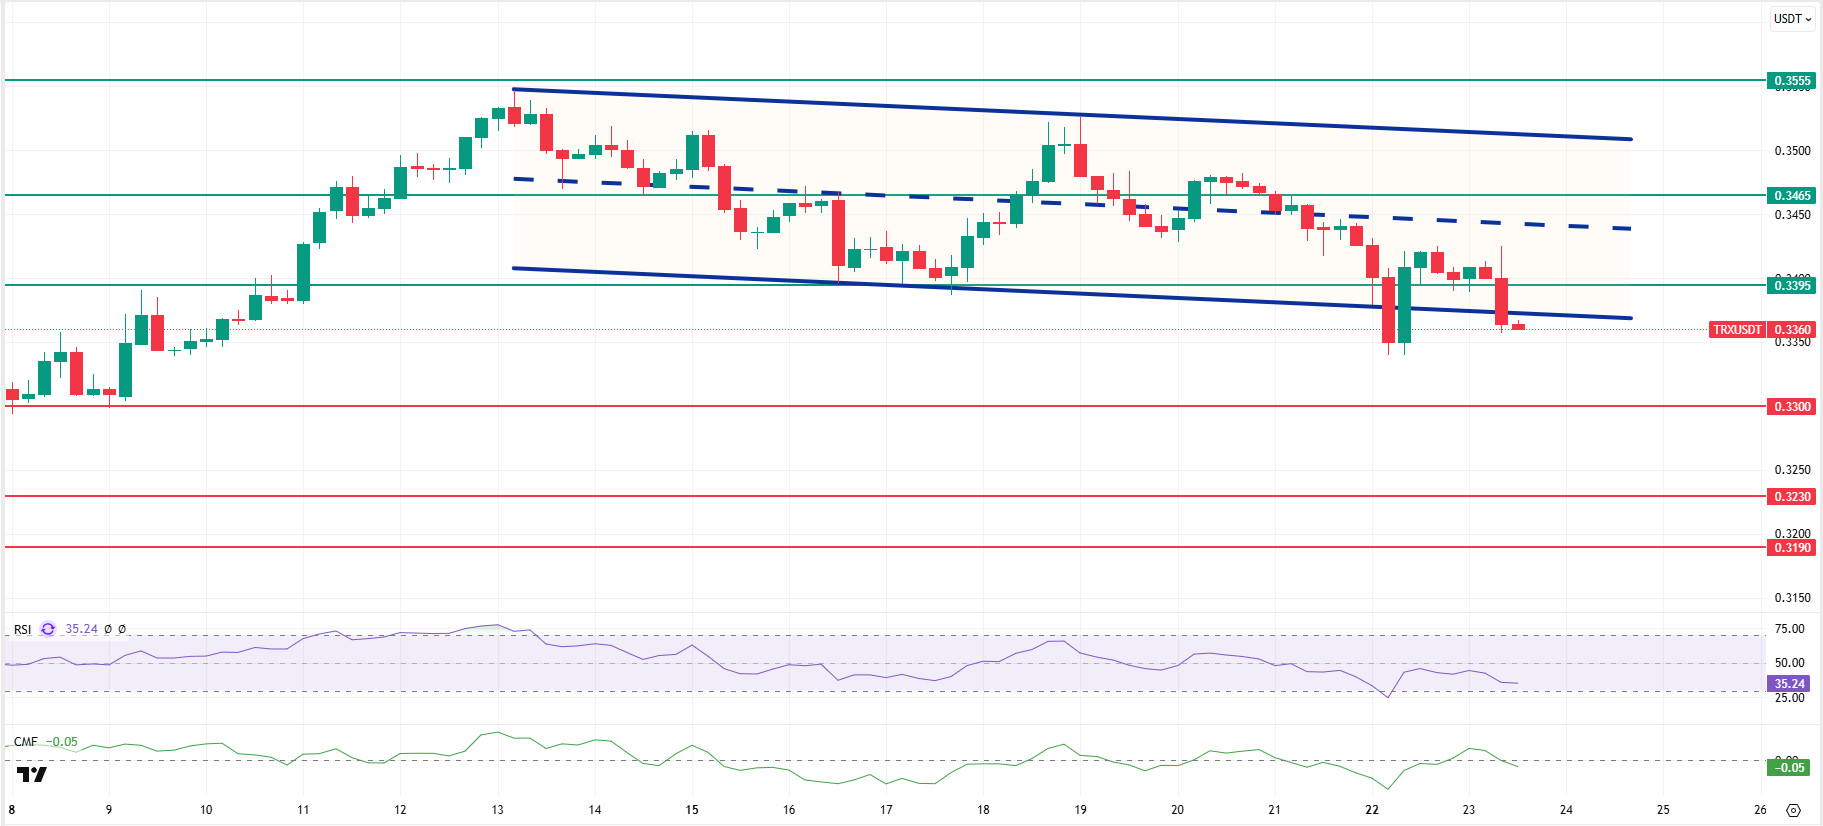
As mentioned in this morning’s analysis, TRX failed to stay above the 0.3395 resistance after the decline and broke below the lower band of the bearish channel. It is currently trading at the 0.3360 level. Currently just below the lower band of the bearish channel, TRX is trading very close to the 0.3395 resistance on the 4-hour chart. The Relative Strength Index (RSI) value of 35 indicates that it is very close to the oversold zone. In addition, the Chaikin Money Flow (CMF) indicator continues to remain below zero at a value of -0.05, indicating a decrease in cash inflows. The CMF remaining in negative territory can be considered an indicator that the price may experience a decline.
In light of all these indicators, TRX may rise slightly in the second half of the day and move towards the bearish channel. In this case, it may test the 0.3395 resistance level. If it closes above this resistance level, it may continue its upward movement and then move towards the middle band of the channel to test the 0.3465 resistance level. If the candle does not close above the 0.3395 resistance level, the CMF may remain in negative territory, causing inflows to weaken significantly. Following a possible decline in price, it may test the 0.3300 support level.
On the 4-hour chart, 0.3190 is an important support level, and as long as it remains above this level, the upward momentum is expected to continue. If this support level is broken, selling pressure may increase.
Support levels: 0.3300 – 0.3230 – 0.3190
Resistance levels: 0.3395 – 0.3465 – 0.3555
Legal Notice
The investment information, comments, and recommendations contained herein do not constitute investment advice. Investment advisory services are provided individually by authorized institutions taking into account the risk and return preferences of individuals. The comments and recommendations contained herein are of a general nature. These recommendations may not be suitable for your financial situation and risk and return preferences. Therefore, making an investment decision based solely on the information contained herein may not produce results in line with your expectations.


