
Technical Analysis
BTC/USDT
As of August 1, 2025, the US began implementing new customs tariffs at rates of 39% on Swiss products, 35% on Canadian products, 19-20% on products from Pakistan, Malaysia, Vietnam, and Bangladesh, and 15% on products from Israel. SEC Chair Paul Atkins announced that creating a fast and transparent regulatory framework for crypto asset issuance is a top priority and unveiled the “Project Crypto” initiative. Strategy launched a $4.2 billion STRC share sale program. Apple reported revenue of $94.04 billion for the third quarter of 2025 and announced that it has begun integrating artificial intelligence investments into its products. Today’s data set will include U.S. non-farm payroll data.
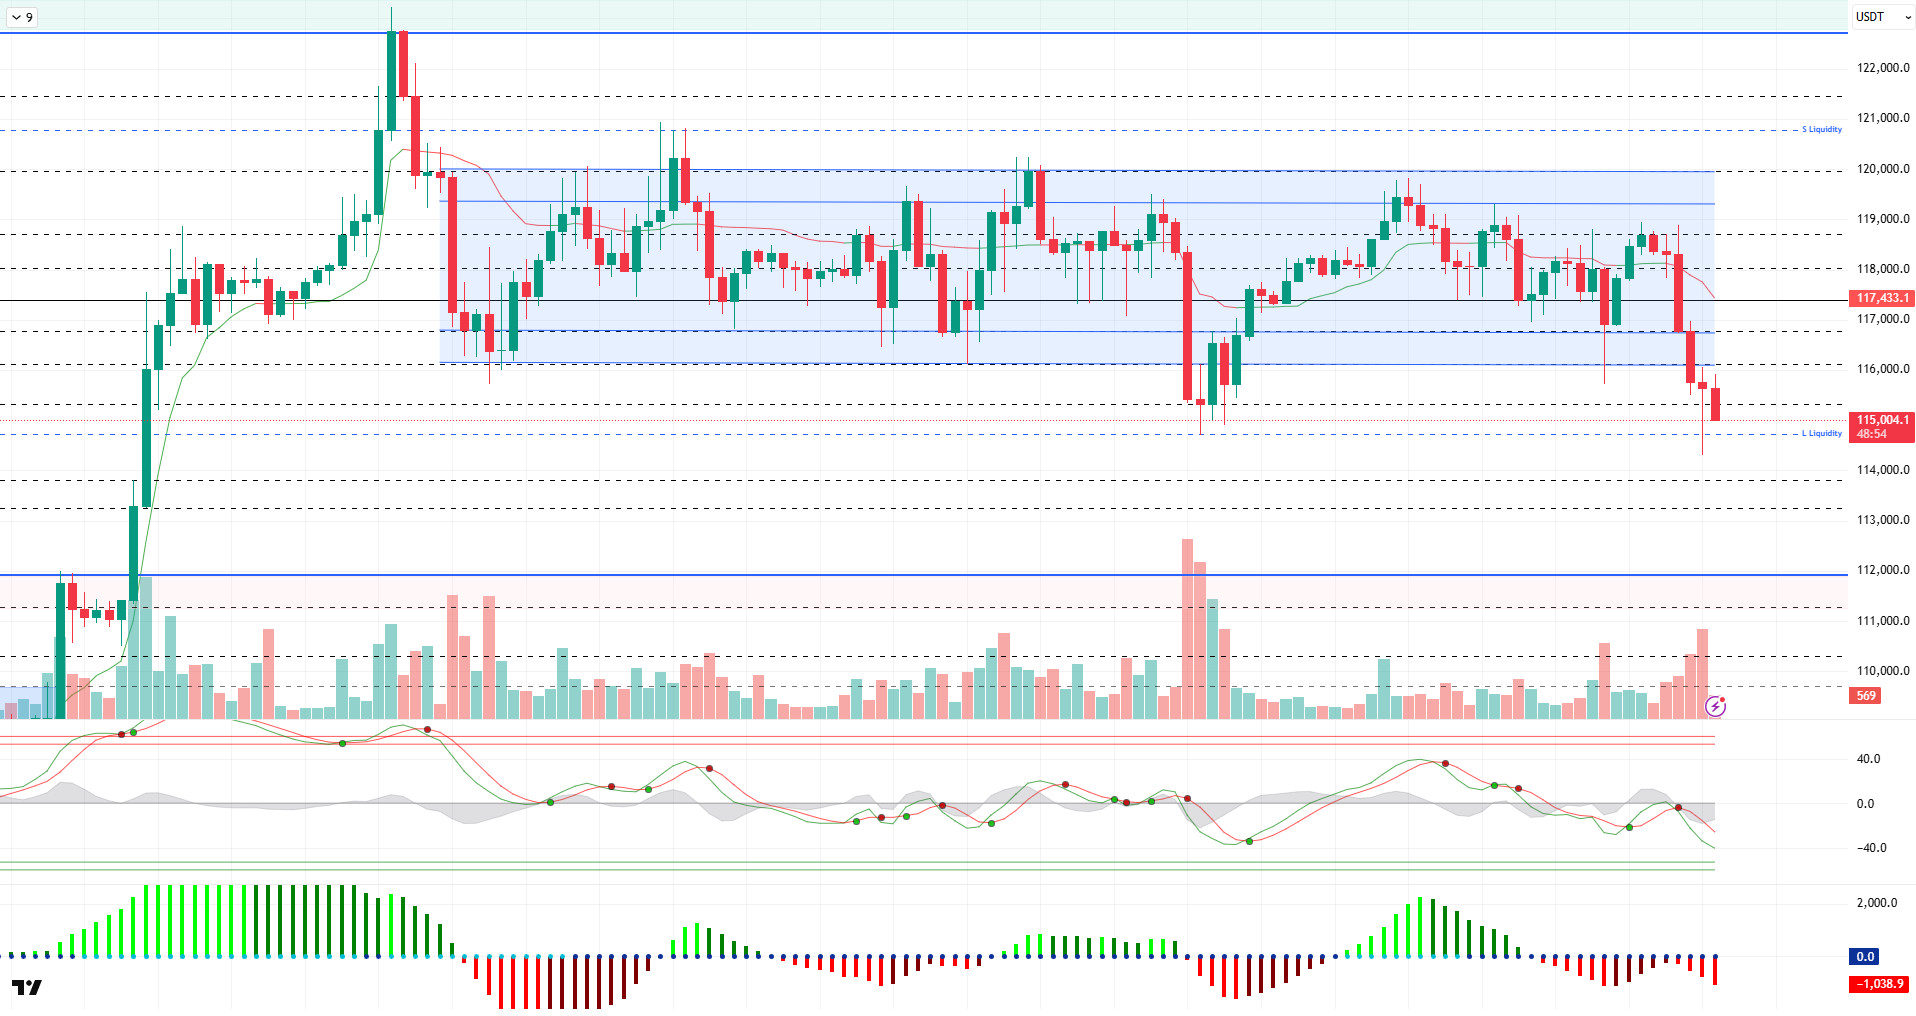
Looking at the technical picture, BTC broke below the horizontal band after a consolidation phase and fell to 114,300. After a slight recovery, the price tested the 116,000 level but, with continued selling pressure, it is now trading around the 115,000 level. The price, which had previously tested this area, has returned to the region, forming a double bottom pattern.
On the technical indicators front, the Wave Trend (WT) oscillator had been showing indecision in the middle band of the channel for a long time before recording an upward movement yesterday. Having once again reversed the trend, WT has now moved back towards the oversold zone. The Squeeze Momentum (SM) indicator lost momentum in the negative zone amid selling pressure. The Kaufman moving average is currently trading at the 117,500 level, with the price-to-moving average band widening.
Looking at liquidity data, the region that recorded limited accumulation in the 115,000–114,000 band has been liquidated, while sell positions continue to accumulate above the 120,000 level.
In summary, while fundamental developments emerged as factors creating selling pressure in terms of pricing, technical and liquidity data lost the favorable ground they had created for an uptrend. In this context, a trend reversal and a return to a horizontal band range could enable prices to resume their upward movement. In the absence of such a development, closes below the 115,000 level could bring the 112,000 level back into focus. Following the price filling the “gap” zone, the momentum situation can be monitored again.
Support levels: 115,000 – 114,300 – 113,200
Resistances: 116,000 – 116,800 – 117,500
ETH/USDT
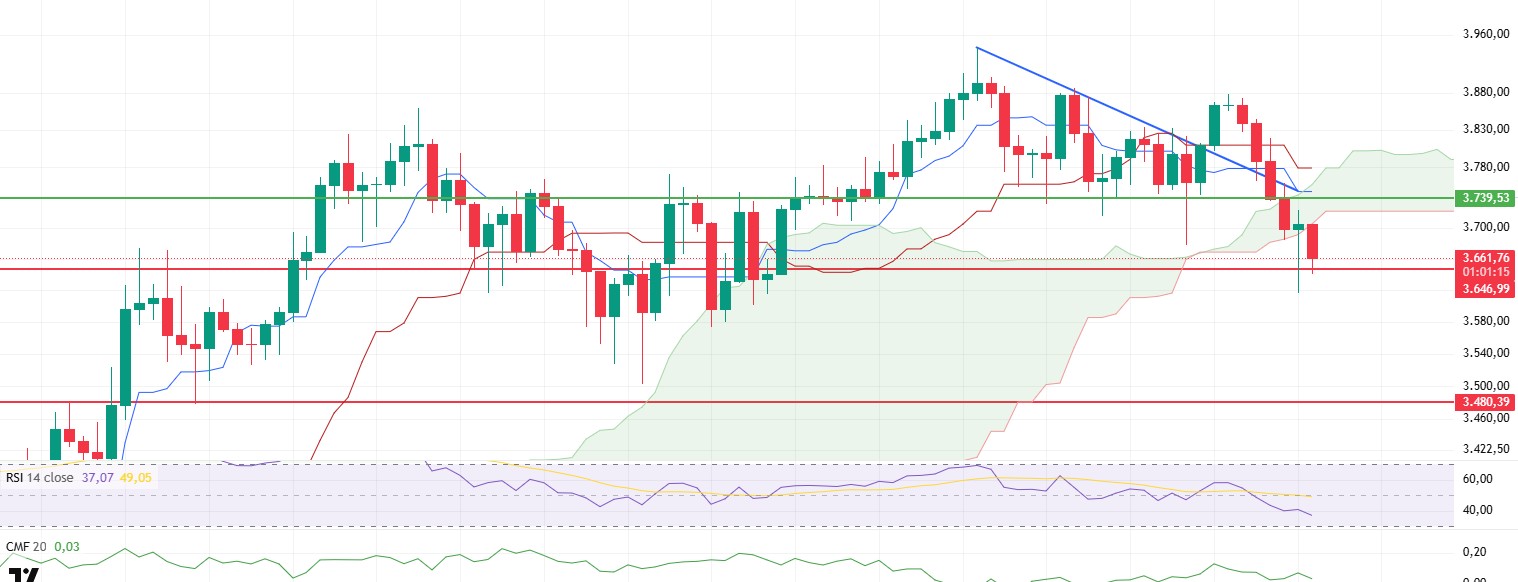
ETH fell to the horizontal support zone at $3,739 following heavy selling pressure that began yesterday afternoon. The downward break of this level deepened the decline, and the price quickly fell below the Ichimoku cloud level. Following this break, selling accelerated, pulling the price down to $3,620. Currently, there are efforts to hold at the intermediate support level of $3,647. However, weakness in technical indicators and deterioration in market structure pose significant risks to maintaining this level.
On-chain data and futures market indicators support price movements. The rapid decline in open interest indicates that market players are closing their positions and seeking to reduce risk in an uncertain environment. The shift of the funding rate into negative territory indicates that short positions are gaining prominence in the market and that downward expectations are beginning to rise. This structure provides an important signal that the pressure on prices is not temporary and that the downward trend is strengthening.
The Ichimoku indicator also confirms that the overall outlook has turned negative. The price falling below both the kijun and tenkan levels and then dropping below the kumo cloud indicates that the market structure has broken down and that the potential for a short- to medium-term decline is gaining strength. Such a breakout typically signals that selling pressure will continue and that there is a high probability of lower levels being tested.
From a liquidity dynamics perspective, the Chaikin Money Flow (CMF) indicator has retreated to the zero line. This indicates a significant outflow of liquidity from the market and a weakening of the buying side. In particular, the increasing potential for a move into negative territory suggests that selling pressure is gaining momentum and having a direct impact on prices.
On the momentum side, the Relative Strength Index (RSI) is showing a noticeable weakness. Both the MA line and its own downward trend have broken below, indicating that price movement has lost momentum ( ) and buying power has significantly weakened. While the RSI’s drop to the 37 level indicates that the market is approaching an oversold region, this alone is not strong enough to be considered a reversal signal.
Overall, it appears that the ETH price is seeking equilibrium at the $3,646 level. If the ETH price fails to hold at this level, the possibility of increased selling pressure and a new wave of declines below $3,400 will remain on the table. On the other hand, if the price regains the lower band of the cloud at the 3,721 dollar level and the previous horizontal support – now resistance – zone at the 3,739 dollar level, the possibility of a short-term recovery could come to the fore. However, for such a recovery to be sustainable, upward breakouts must be volume-supported, and simultaneous improvements in technical indicators must be observed.
Top of Form
Below the Form
Support levels: 3,646 – 3,480 – 3,285
Resistance levels: 3,739 – 4,084 – 4,381
XRP/USDT
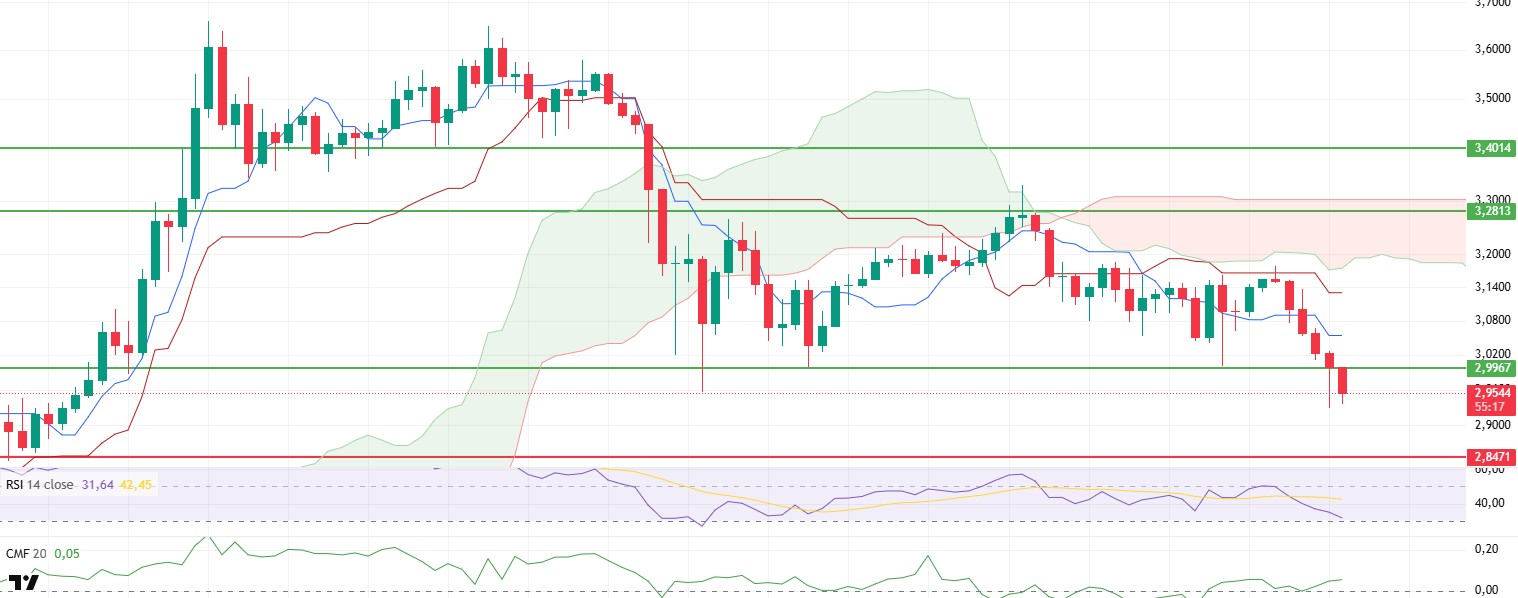
XRP has begun trading at a critical threshold, falling below the key support level of $2.99 during the latest downturn. Although there has not yet been a clear close below this level, a breach of this zone would signal a more pronounced technical weakness. Such dips below support levels, especially when accompanied by volume, indicate that the downtrend is gaining strength. At this point, the price’s attempt to reclaim the $2.99 level stands out as an important threshold.
Technical indicators provide important signals for understanding the underlying structure of price movements. The Chaikin Money Flow (CMF) indicator remains in positive territory, supported by the zero line despite the downward movement of the price. This indicates the presence of limited liquidity flowing into the market during the decline and suggests that the price is attempting to hold at its current level. However, this positive structure is not sufficient on its own, as the overall market structure still shows that selling pressure remains dominant.
Data from the futures market indicates a more aggressive selling pressure than the spot market. Short-term investors’ sentiments are strengthening expectations that the price could test lower levels if it fails to hold its current support level. This situation, combined with the concentration of short positions opened in leveraged transactions, could pave the way for a new wave of price declines.
On the momentum side, the Relative Strength Index (RSI) clearly indicates technical weakness. Although the indicator’s decline to 33 suggests that the market is approaching the oversold zone, the sharp and steep decline in the RSI signals that momentum is continuing to weaken and downward pressure is continuing. This structure serves as a strong signal that lower support levels could be tested if the price fails to maintain its current levels.
Based on all this data, it is crucial whether the XRP price will be able to regain the $2.99 level during the day. A sustained break above this level could provide at least short-term technical relief and pave the way for temporary recoveries. However, a close below the 2.99 dollar level, combined with the current weakness in technical indicators, could bring about a more severe and deepening downturn. Therefore, the price’s behavior at this critical level will be decisive for short-term direction.
Supports: 2.8471 – 2.6513 – 2.4777
Resistances: 2.9967 – 3.2813 – 3.4014
SOL/USDT
Bitwise and VanEck urge the SEC to approve liquid staking tokens for Solana ETFs. VanEck, Grayscale, Franklin, Bitwise, Fidelity, and CoinShares filed an amended S-1 form for the Solana ETF. Jito Labs and VanEck launched a Solana-based liquid staking solution that enables investors to maintain liquidity while staking their assets, is compliant with regulations, and increases DeFi participation.
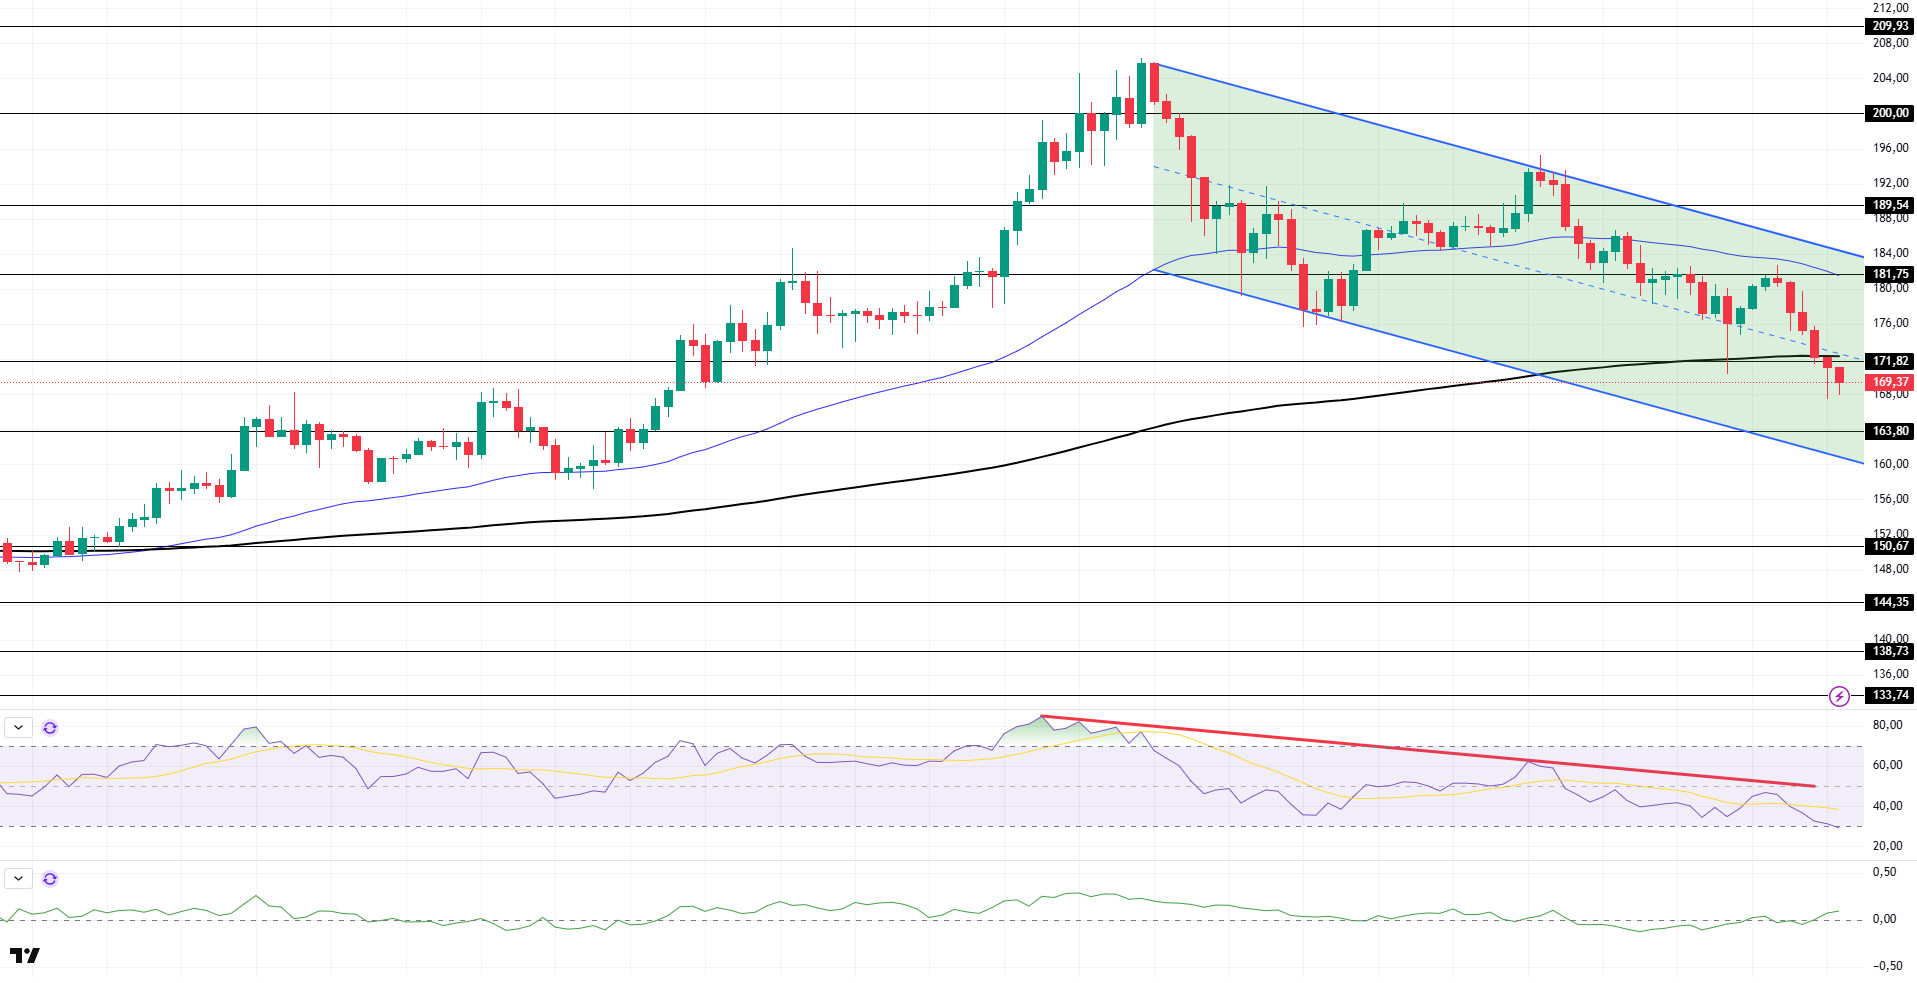
The SOL price continues to decline. The asset has remained within the downward trend that began on July 23. The price tested the strong resistance level of $181.75 and the 50 EMA (Blue Line) levels, encountered resistance here, lost momentum, and broke below the 200 EMA (Black Line) moving average. If the pullback continues, the $163.80 level could be targeted. If an upward movement begins, the 181.75 dollar level can be monitored.
On the 4-hour chart, the 50 EMA (Blue Line) remains above the 200 EMA (Black Line). This indicates that the upward trend may continue in the medium term. At the same time, the price being below both moving averages shows that the market is currently in a downward trend. Chaikin Money Flow (CMF-20) has started to move into positive territory. However, a decrease in money inflows could push the CMF into negative territory. The Relative Strength Index (RSI-14) has continued to remain below the downward trend that began on July 21 and is now in the oversold zone. This could trigger an upward movement. In the event of an uptrend driven by positive macroeconomic data or news related to the Solana ecosystem, the $181.75 level emerges as a strong resistance point. If this level is broken to the upside, the uptrend is expected to continue. In the event of a pullback due to adverse developments or profit-taking, the 163.80 dollar level could be tested. A decline to these support levels could see an increase in buying momentum, presenting a potential opportunity for an upward move.
Support levels: 163.80 – 150.67 – 144.35
Resistance levels: 171.82 – 181.75 – 189.54
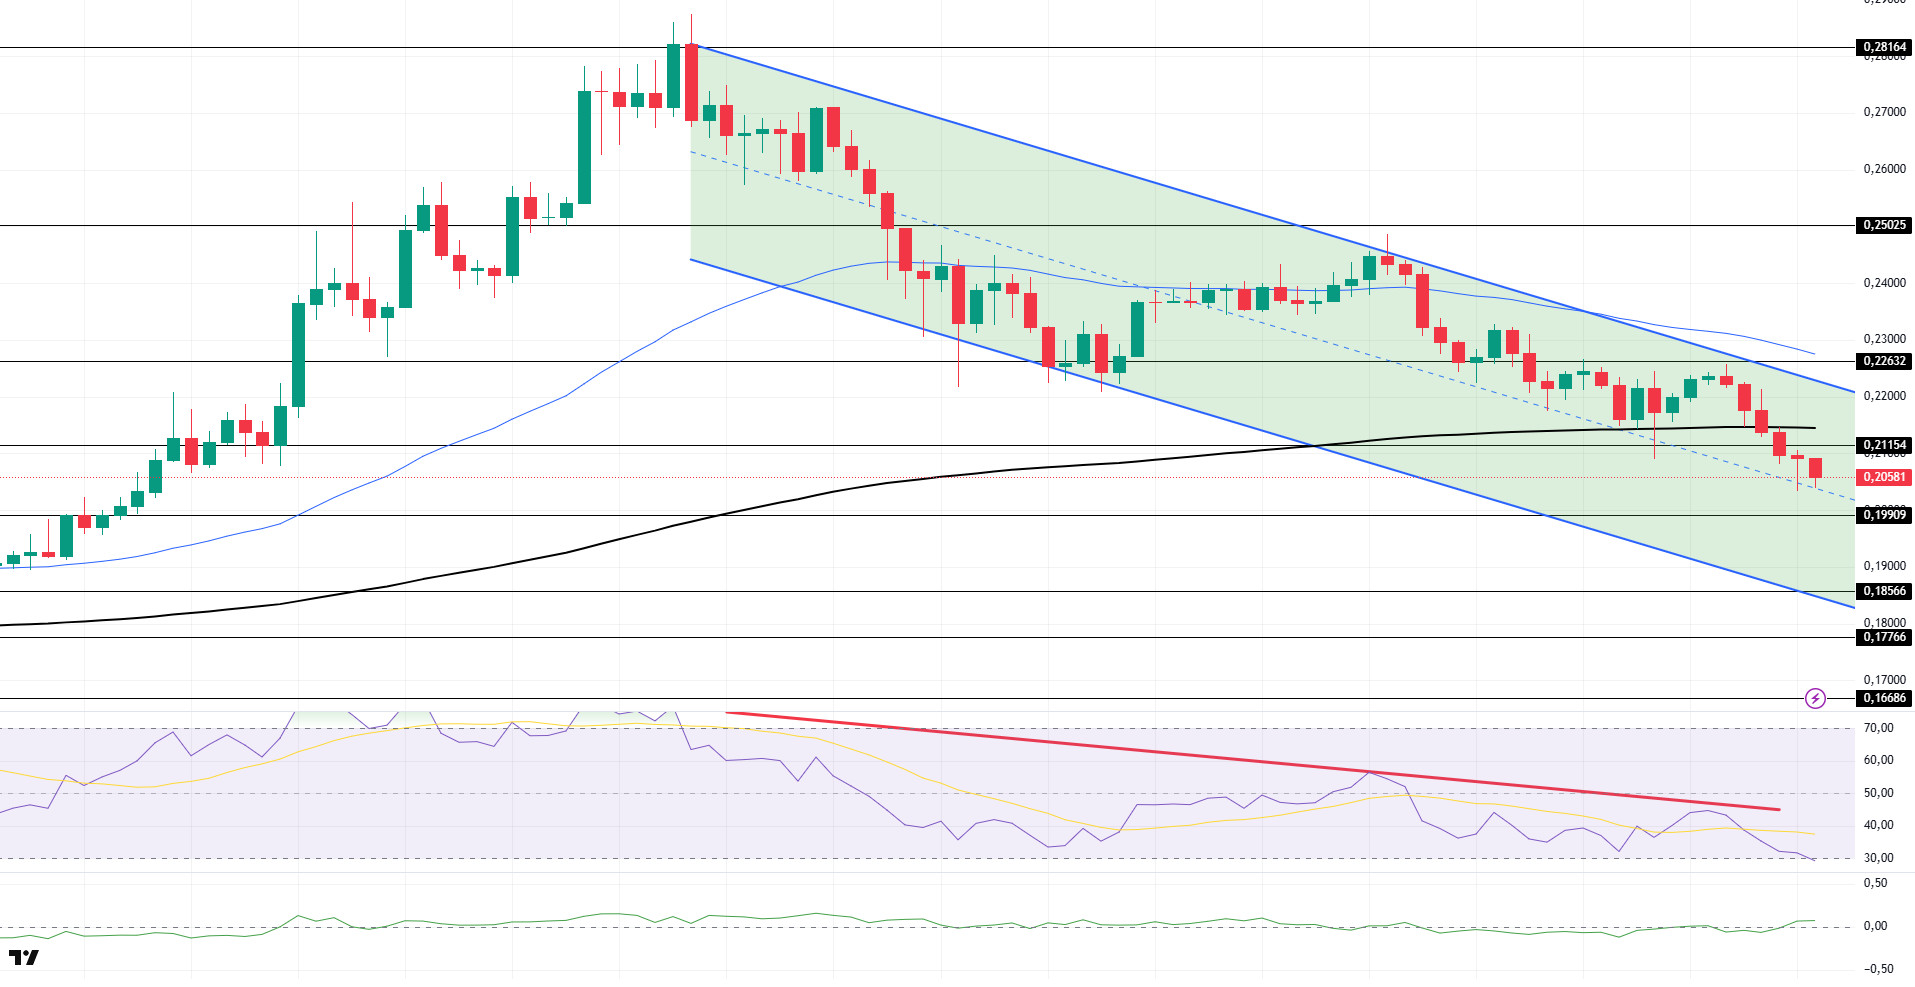
DOGE/USDT
The DOGE price has declined. The asset continued to lose value after encountering resistance at the resistance level of 0.22632 USD and the top of the downtrend that began on July 21. The price, which remained within the trend, deepened its decline by breaking below the 200 EMA (Black Line) moving average. In the event of a continued pullback, the 0.19909 dollar level can be monitored as support. If an uptrend begins, the 0.22632-dollar level should be monitored.
On the 4-hour chart, the 50 EMA (Blue Line) remains above the 200 EMA (Black Line). This indicates that the asset is in an upward trend in the medium term. The price being below both moving averages ( ) indicates that the asset is in a downward trend in the short term. The Chaikin Money Flow (CMF-20) has crossed into positive territory. Additionally, negative cash inflows could push the CMF deeper into negative territory. The Relative Strength Index (RSI-14) remains in negative territory. Furthermore, it remains below the downward trend that began on July 21. It is also approaching the oversold zone, which could prolong the decline. In the event of potential increases driven by political developments, macroeconomic data, or positive news flow within the DOGE ecosystem, the $0.22632 level emerges as a strong resistance zone. In the opposite scenario or in the event of negative news flow, the 0.19909 dollar level could be triggered. A decline to these levels could increase momentum and potentially initiate a new upward wave.
Support levels: 0.19909 – 0.18566 – 0.17766
Resistance levels: 0.21154 – 0.22632 – 0.25025
Legal Notice
The investment information, comments, and recommendations contained herein do not constitute investment advice. Investment advisory services are provided individually by authorized institutions taking into account the risk and return preferences of individuals. The comments and recommendations contained herein are of a general nature. These recommendations may not be suitable for your financial situation and risk and return preferences. Therefore, making an investment decision based solely on the information contained herein may not produce results in line with your expectations.

