
Technical Analysis
BTC/USDT
Strategy announced the purchase of 1,955 BTC for $217.4 million. Europe-based Capital B raised €5 million in capital and announced plans to purchase approximately 60 BTC, bringing its total reserves to 2,261 BTC. El Salvador, on the other hand, increased its total reserves to 6,313 BTC by purchasing 21 BTC in the fourth year of Bitcoin Day; It was stated that the assets will be stored at 14 different addresses.
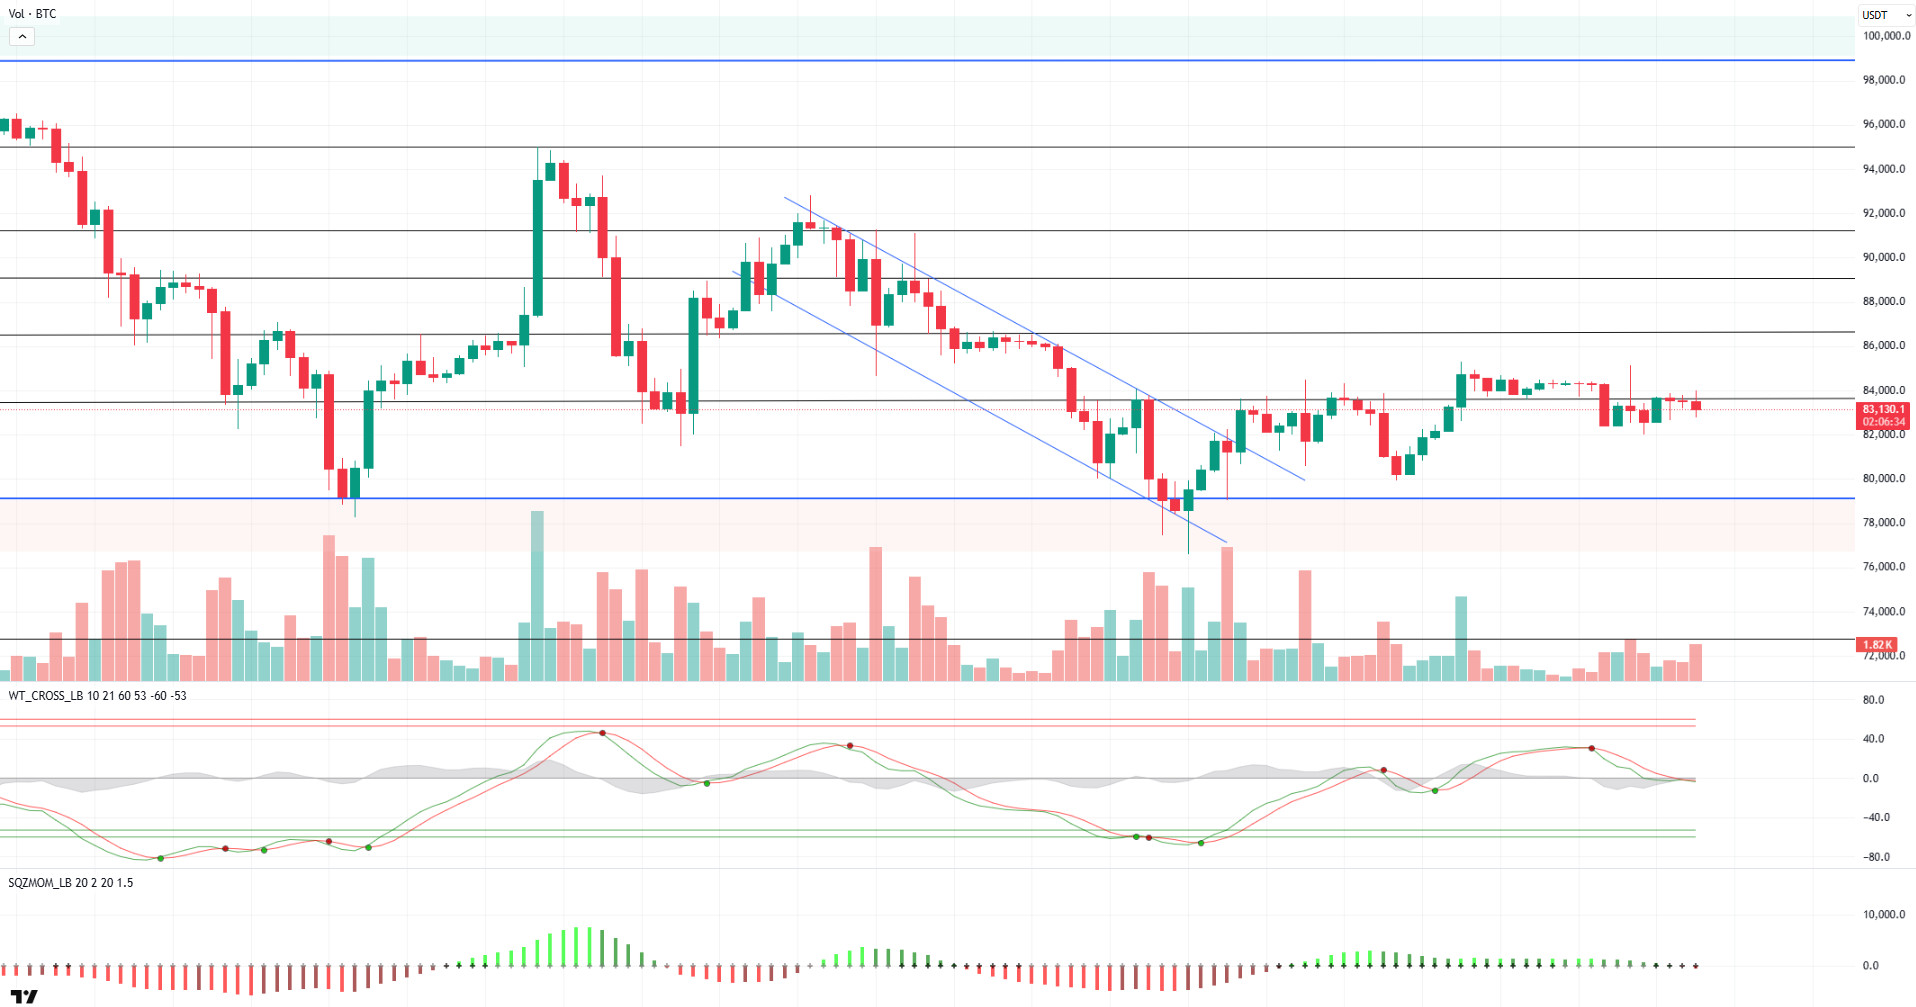
When we look at the technical outlook, it is seen that with the transformation of the falling trend structure into a horizontal trend structure, the bowl-and-handle pattern formed in BTC has been completed and invalidated by the effect of fundamental developments. BTC, which formed a minor uptrend within the horizontal band range, rose compared to the previous analysis and reached 112,000.
Technical indicators are heading towards the overbought zone, regaining strength after BTC weakened, which broke through the Wave Trend oscillator (WT) channel mid-band. On the Squeeze Momentum (SM) indicator, the histogram is trying to regain momentum in the negative area. The Kaufman moving average is currently moving below the price at 110,500.
Looking at the liquidity data, short-term accumulating sell trades were liquidated at 112.600 -113.400, while the wider timeframe sell accumulation was diluted at 114.000. While the buying tier started to accumulate at 109,000 levels in the short term, the 106,500 – 107,500 band continues to be a more intense accumulation zone.
In summary, the loss of the optimistic mood in recent days with the fundamental developments, the interest rate cut discussions among Fed members, tariffs remaining on the agenda with the new distribution of duties and political tensions stand out as factors that put pressure on the price. In technical terms, although the formation of a favorable ground for a new upward movement created some recovery, it was noteworthy that the rises remained in the form of liquidity purchases. Turning the rises into a trend may be possible with the reappearance of new catalysts in the market, creating a driving force on the price. In this context, 112,600 stands out as a critical reference area in the continuation of the upward movement. Exceeding this level may cause the price to gain momentum and bring a movement towards the 114,000 level. In a possible selling pressure, the 108,500 level may meet us in case of a break of 110,000.
Supports 108,500 – 107,400 – 105,000
Resistances 112,600 – 114,000 – 115,000
ETH/USDT
According to Onchain Lens data, a whale converted 2,929 ETH into 12.64 million USDC on HyperUnit at a price of about $4,315. According to Lookonchain, a wallet associated with Metalpha withdrew 11,500 ETH ($49.34 million) from Aave and transferred it to Binance.
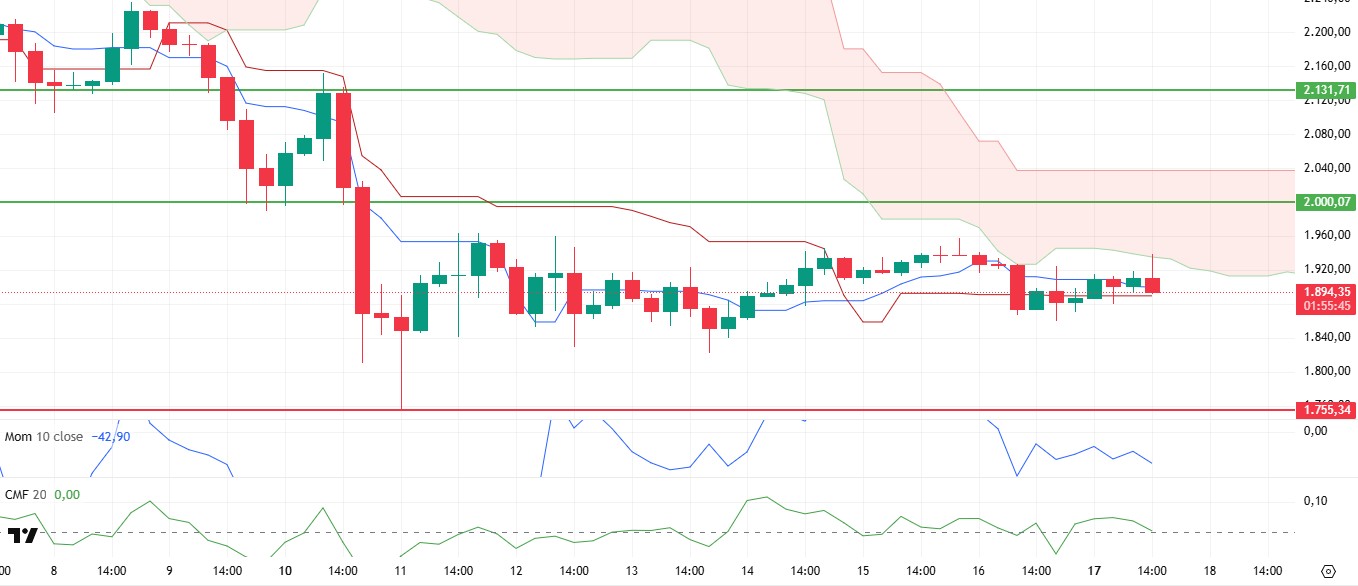
When we look at the technical outlook, the downward trend structure that started at the level of 4,950 since August 25th continues in ETH. Last week, ETH, which shot a needle to 4,130 levels last week, stabilized again in the 4,250 – 4,330 band. At the time of writing, it continues to trade at 4,320.
Technical indicators, the Wave Trend oscillator (WT) is once again turning upwards with a buy signal in the mid-channel band, while the histogram of the Squeeze Momentum (SM) indicator is trying to regain momentum in the positive area. The Kaufman moving average is currently moving above the price at 4.349.
Looking at the liquidity data, the short-term selling bias is concentrated at 4.355, while the buying bias continues to accumulate at 4.230 and above. In the wider time frame, accumulation is once again concentrated at 4,200.
To summarize, ETH continues to move in line with the general developments in the market. When we look at the fundamental dynamics specific to ETH, ETF inflows and institutional interest continue. On the technical side, it is noteworthy that the downtrend structure is maintained. Liquidity data also continues to determine the limits of price movements. In this context, the 4,330 level stands out as a critical threshold in terms of breaking the falling trend line. The momentum that may occur above this level may move the price to the 4,490 resistance zone. On the other hand, the 4,260 support level will be followed in possible pullbacks. If this support is broken, the downtrend structure may deepen further.
Supports 4,260 – 4,170 – 4,080
Resistances 4,330 – 4,385 – 4,490
XRP/USDT
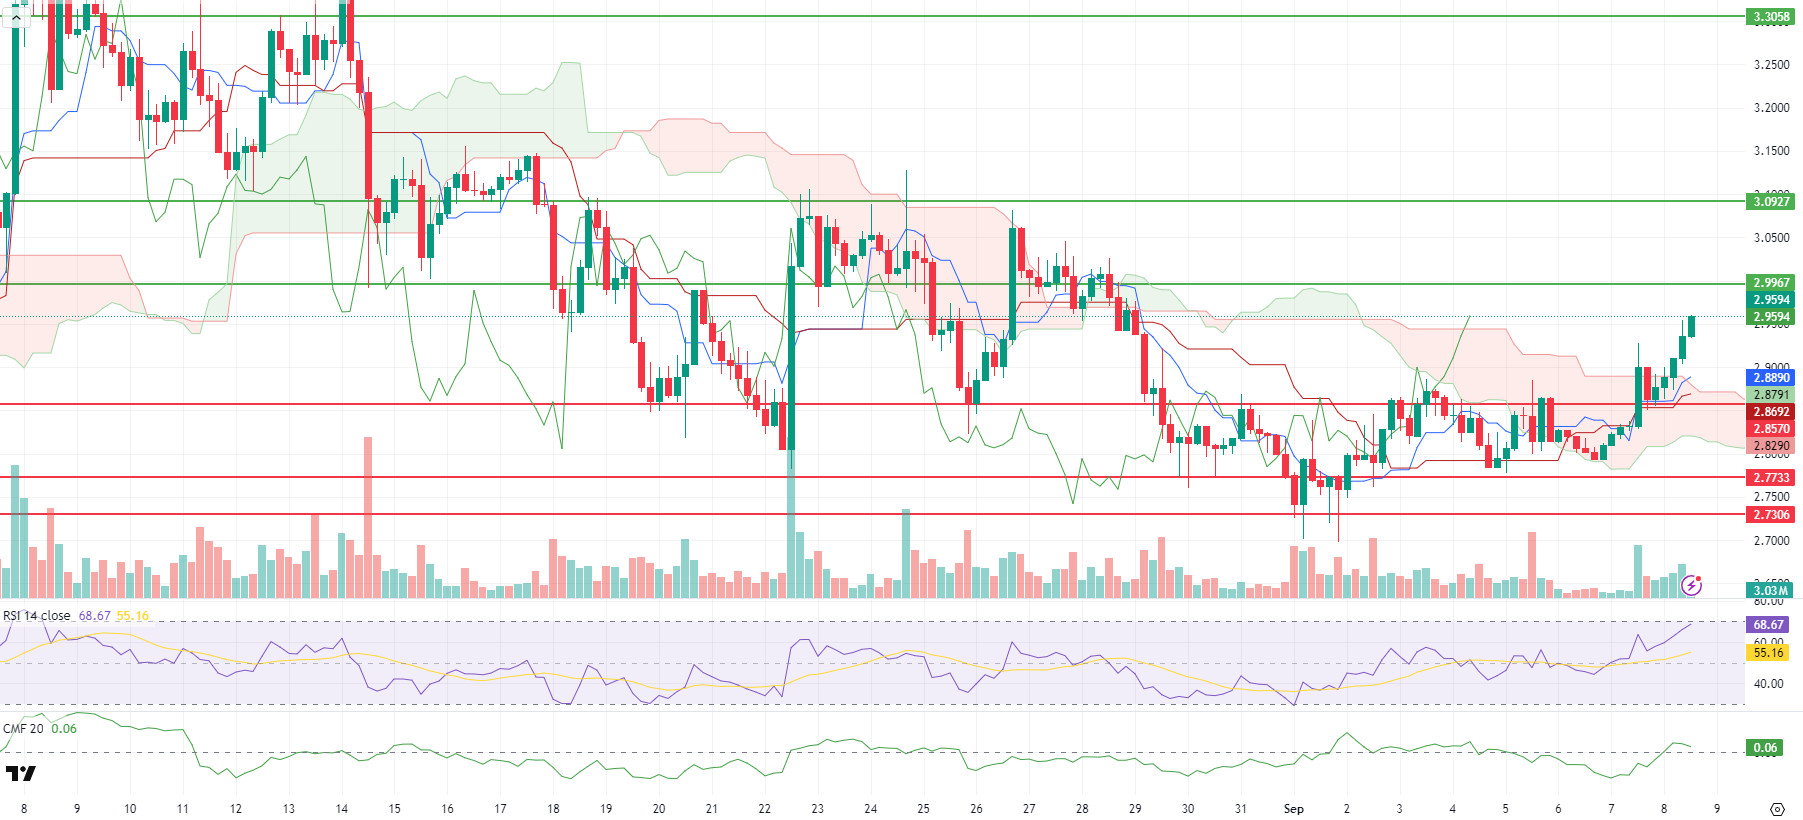
XRP, which started today at $ 2.876, continues to trade above the $ 2.95 level with an increase of about 2.4% as buyers stepped in. On the 4-hour chart, XRP maintains its uptrend by keeping the last 5 candles positive. According to Ichimoku, the structure signals improvement in the short term. Tenkan ($2.88) is above Kijun ($2.867) and the price is holding on to the Kumo upper band. Although the outlook is positive, closes and persistence above the $2.9967 resistance are essential for the continuation of the rise. Otherwise, profit sales that may come from the Kumo edge may create a risk of retracement in the short term.
Relative Strength Index (RSI) settled in neutral-positive territory at 66.6. Since the 70% threshold is an overbought area, profit realizations may be seen when approaching this zone. Chaikin Money Flow (CMF) turned positive at +0.05, indicating that liquidity inflows are picking up on the spot side. This indicates that resistance tests can only be permanent if supported by volume.
In the short term, if the hold on the upper band of Kumo ($ 2.941) continues successfully and the resistance level of $ 2.9967 can be exceeded with volume, rises towards $ 3.0927 and then $ 3.3058 may be on the agenda in the continuation of the rise. On the other hand, if the XRP price falls below $ 2,941 with the possible selling pressure, the risk of correction towards Tenkan and Kijun levels may increase. Below this region, supports of $ 2,857 and $ 2,773 stand out. In general, although momentum and liquidity indicators have turned in favor of intraday, persistence above $3.00 and keeping CMF in the positive zone will be decisive for the sustainability of the rise.
Supports: 2.8570 – 2.7733 – 2.7306
Resistances 2.9967 – 3.0927 – 3.3058
SOL/USDT
Forward Industries, Inc. announced that it has secured $1.65 billion in cash and stablecoin commitments through public private investment led by Galaxy Digital Jump Crypto and Multicoin Capital to fund its Solana-focused digital asset treasury strategy.
SOL price was bullish during the day. The asset broke the rising wedge pattern that started on August 2 to the upside. The 50 EMA (Exponential Moving Average – Blue Line) moving average (Exponential Moving Average – Blue Line) can be followed as a resistance level of 222.61 dollars in case the uptrend continues. In retracements, the ceiling level of the pattern can work as support.
On the 4-hour chart, it continued to be above the 50 EMA (Exponential Moving Average – Blue Line) and 200 EMA (Black Line). This suggests that the uptrend may continue in the medium term. At the same time, the fact that the price is above both moving averages suggests that the market is bullish in the short term. Chaikin Money Flow (CMF-20) continued to be in positive territory. However, an increase in inflows may keep CMF above the positive zone. Relative Strength Index (RSI-14) continued to be in positive territory. It also broke the ceiling of the downtrend that started on August 29 to the upside. This could exacerbate the bullishness. The $222.61 level stands out as a strong resistance point in the event of a rally on the back of macroeconomic data or positive news on the Solana ecosystem. If this level is broken upwards, the rise can be expected to continue. If there are pullbacks due to contrary developments or profit realizations, the $ 200.00 level can be tested. In case of a decline to these support levels, the increase in buying momentum may offer a potential bullish opportunity.
Supports 209.93 – 200.00 – 189.54
Resistances 222.61 – 237.53 – 247.53
DOGE/USDT
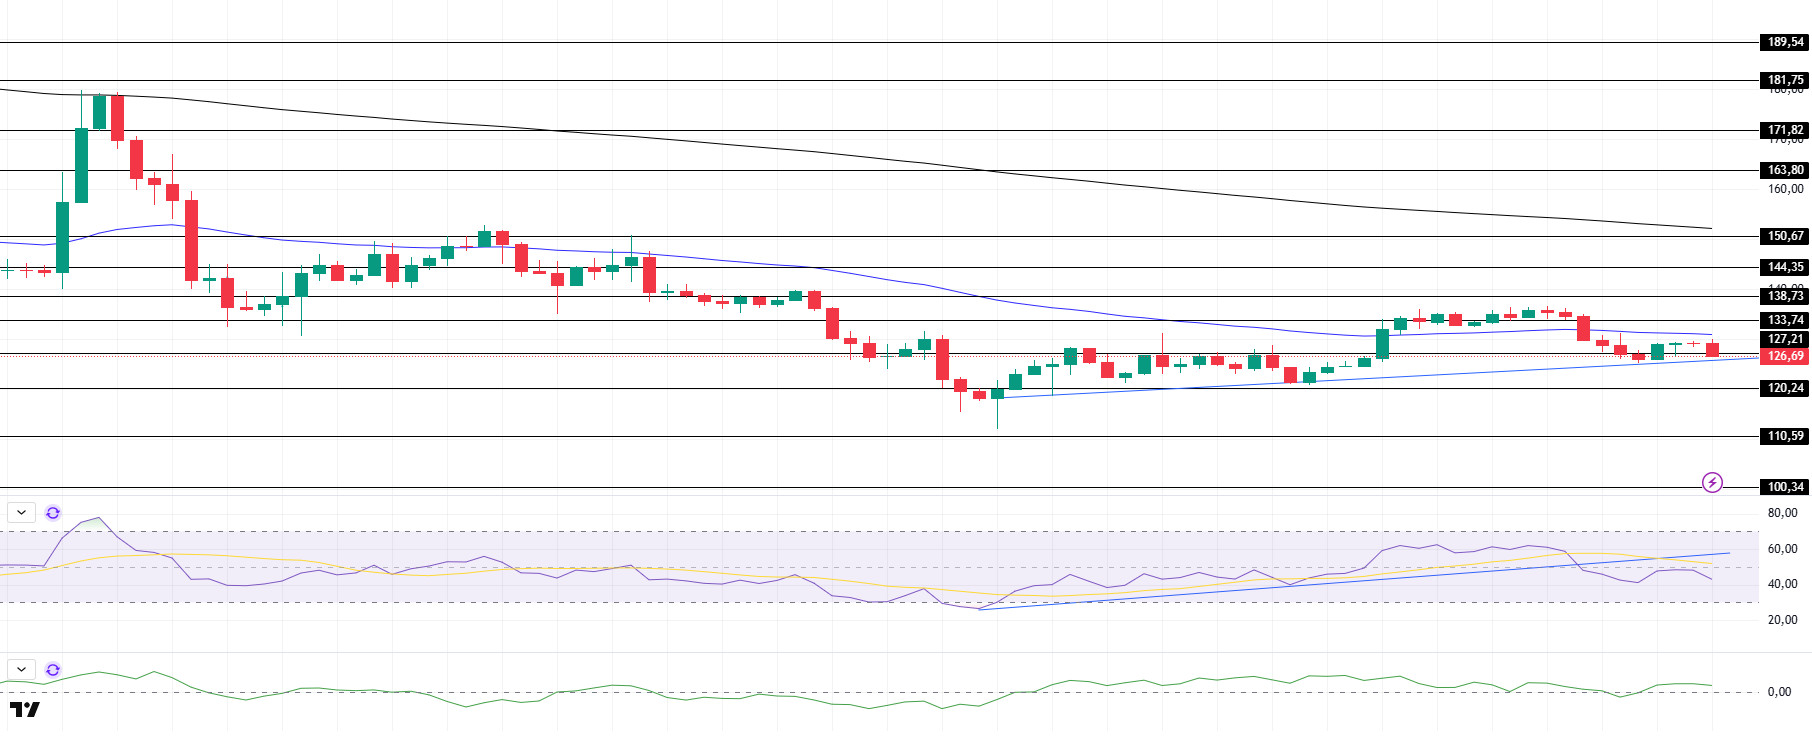
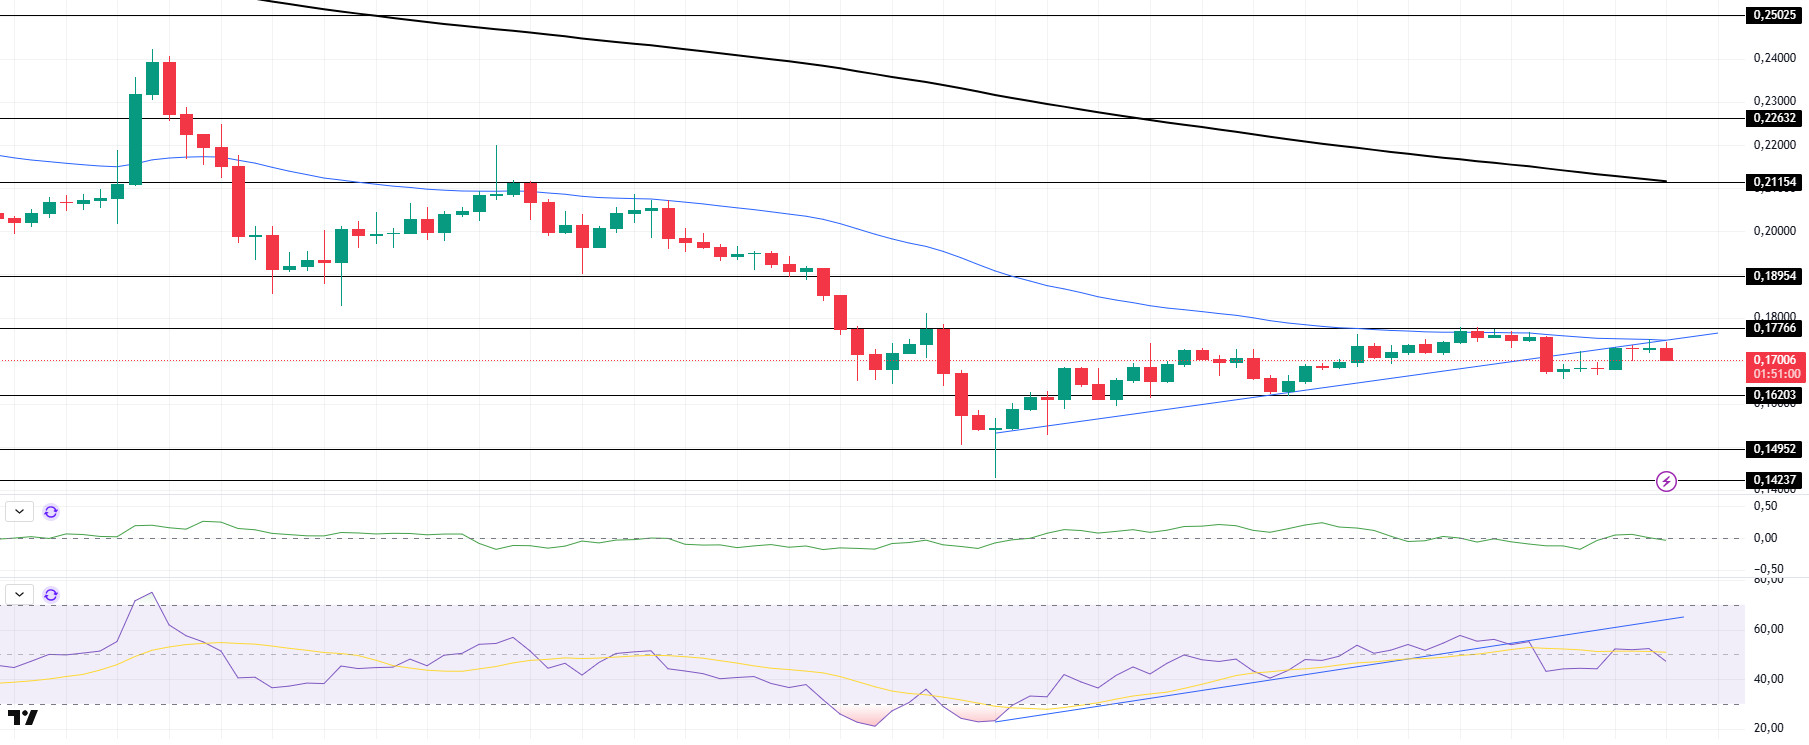
DOGE price continued to rise during the day. The asset broke the downtrend that started on July 21 with a strong candle and managed to hold above it. Breaking the 50 EMA (Exponential Moving Average – Blue Line) and 200 EMA (Black Line) moving averages to the upside, the $0.25025 level should be followed if the price maintains its momentum and continues to rise. In case of a possible pullback, the $0.22632 level may be triggered.
On the 4-hour chart, the 50 EMA (Blue Line) continued to be below the 200 EMA (Black Line). This signals the start of a downward trend in the medium term. The fact that the price is above both moving averages suggests a strong bullish bias in the short term. Chaikin Money Flow (CMF-20) continues to be in positive territory. In addition, a decrease in inflows may move CMF into negative territory. Relative Strength Index (RSI-14) remains in overbought territory. This may bring profit sales. At the same time, it continues to be in the upper zone of the uptrend that started on August 26. The $0.25025 level stands out as a strong resistance zone in case of a possible rise in line with political developments, macroeconomic data or positive news flow in the DOGE ecosystem. In the opposite case or possible negative news flow, the $0.22632 level may be triggered. In case of a decline to these levels, the momentum may increase and a new bullish wave may start.
Supports 0.22632 – 0.21154 – 0.19909
Resistances 0.25025 – 0.28164 – 0.30545
AVAX/USDT
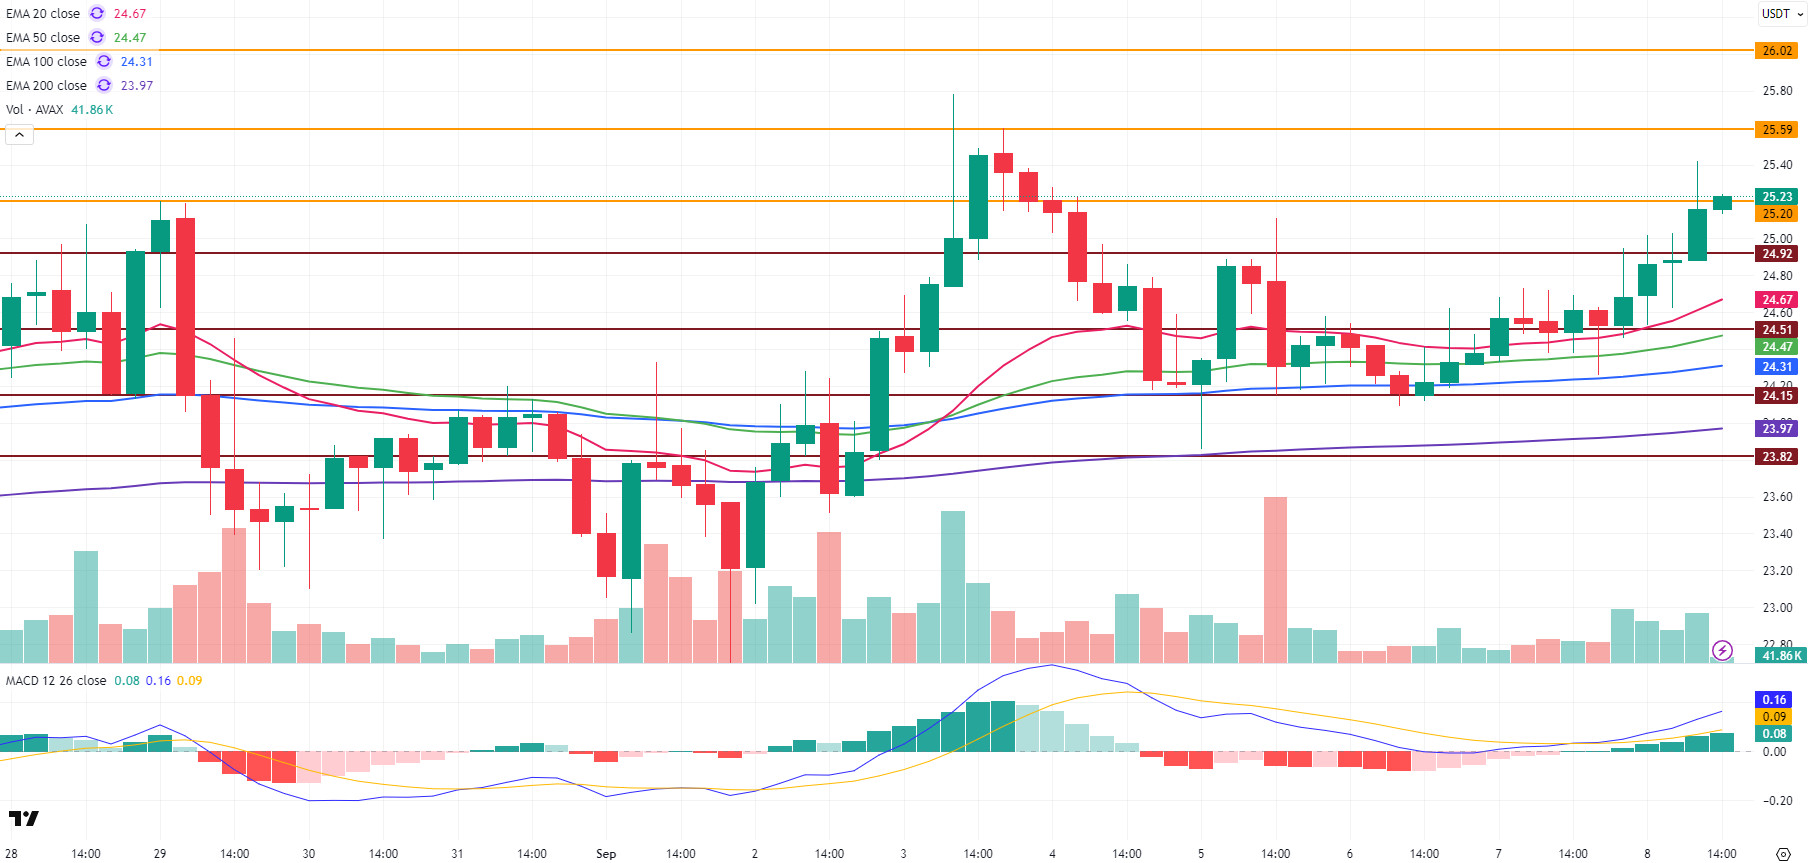
AVAX, which started the new day with a rise, continues to trade above the $ 25.20 level, gaining about 2.3%. In AVAX, which continued its upward momentum by breaking the $ 24.92 resistance during the day, the persistence above this level is critical for the continuation of the short-term upward movement. The increase in daily trading volume shows that the buy side is still active and short-term investors support the rise. If the $25 level is maintained above $25, there may be a gradual upward potential up to $26 in the short term. However, if the upward movement is not supported by volume, it is possible to face profit sales.
On the technical indicators side, the Moving Average Convergence/Divergence (MACD) is above the signal line on the 4-hour chart and continues its positive momentum. This indicates that the upward trend may continue. Also, AVAX is trading above the critical Exponential Moving Average (EMA) levels. This technical outlook points to a market where momentum is strengthening and selling pressure is weakening.
With the continuation of this momentum in AVAX, closing above the $ 25.20 level is important in its rise. In the continuation of the rise, the resistance levels of $ 25.59 and then $ 26.02 will come to the agenda, respectively. On the contrary, if negative momentum occurs and AVAX declines under the influence of sales pressure, the support level of $ 24.92 stands out as the first test point. If this level is broken downwards, support levels of $24.51 and $24.15 may come to the agenda, respectively.
(EMA20: Pink Line EMA50: Green Line, EMA100: Blue Line, EMA200: Purple Line)
Supports 24.92 – 24.51 – 24.15
Resistances 25.20 – 25.59 – 26.02
BNB/USDT
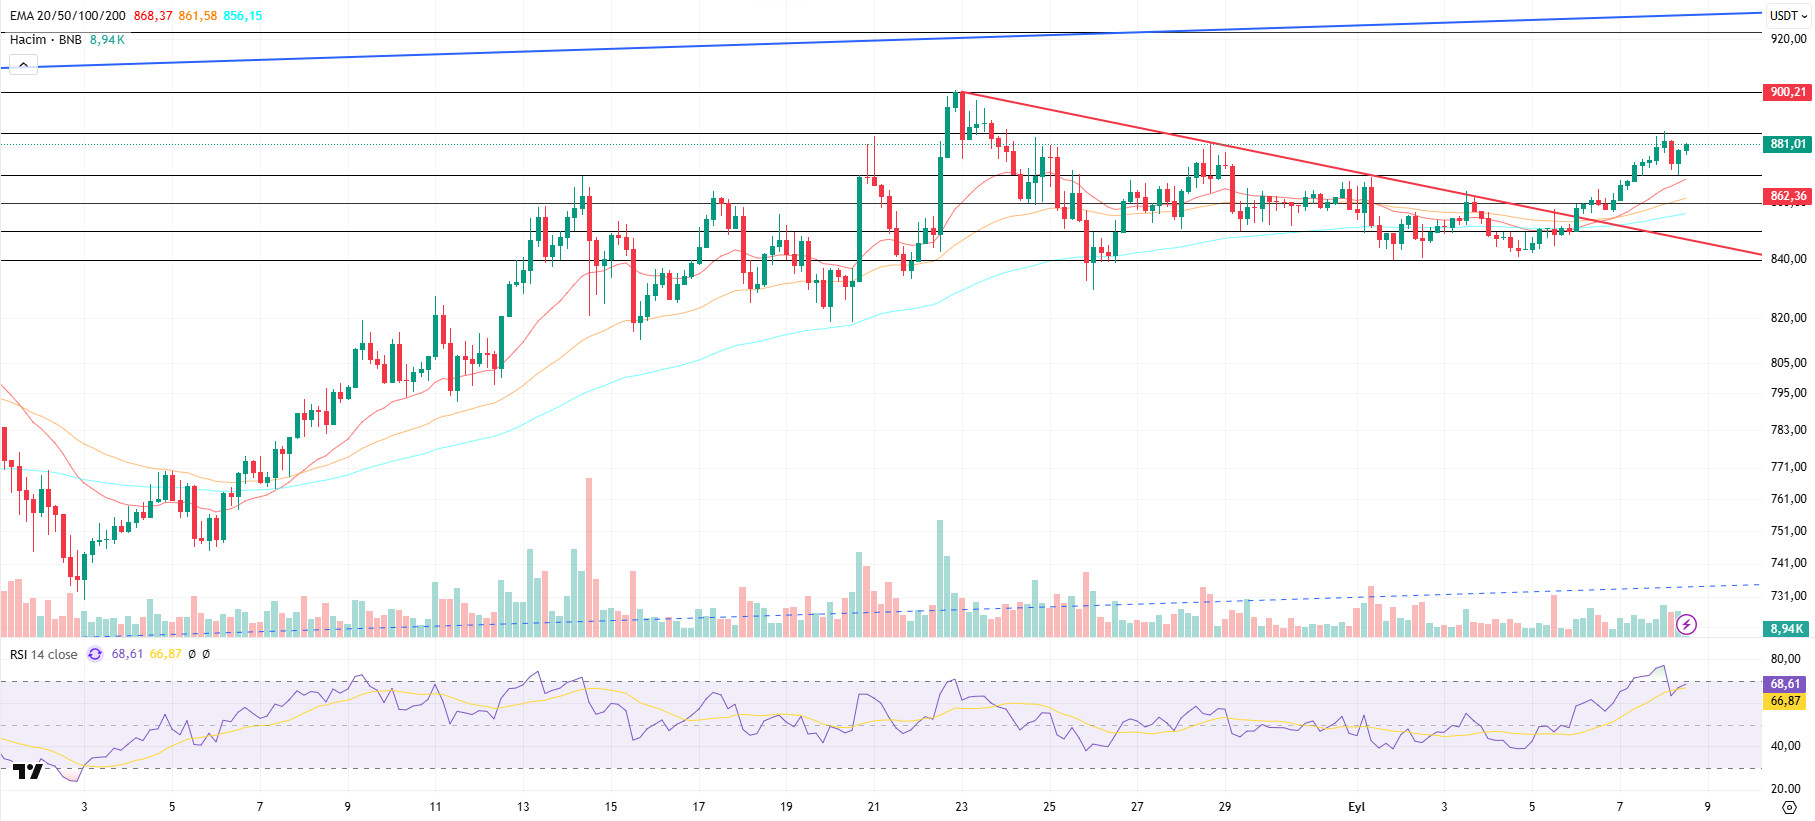
From a technical point of view, BNB/USDT continued its downward trend to the $840 level with the selling pressure it saw from the $900 peak level in the four-hour period. Finding support three times from this level, BNB regained positive momentum up to $885. Thus, the asset displayed a horizontal outlook between the $ 840-885 levels.
However, with the beginning of the new day, it saw selling pressure below the $ 885 level and made a negative start. With this start, it fell to $870 during the day in line with our expectation and regained positive momentum with support from this level. This momentum enabled the price to rise above the $ 880 level.
Technical indicators for BNB/USDT, which is currently trading in the range of $870-885, show that a weak trend in trading volume has recently come to the fore. This picture indicates that the market has entered the decision phase. On the other hand, although the Relative Strength Index (RSI) rose above the 70 level, it declined with selling pressure on the new day and turned its direction down. This technical structure indicates that negative trends may continue in the short term.
Within the framework of the current technical outlook, if the positive momentum continues, the BNB price is expected to test the $ 885 resistance level in the first place. If this level is broken upwards, the $ 900 and $ 990 levels stand out as critical resistance zones to follow, respectively. On the other hand, if the $ 885 resistance is maintained and the sales appetite increases, the price is likely to turn towards the $ 870 support level again. If this support is broken, the $ 850 and $ 920 levels, respectively, gain importance as strong resistance points to follow.
Supports 870 – 860 – 850
Resistances 885 – 900 – 920
ADA/USDT
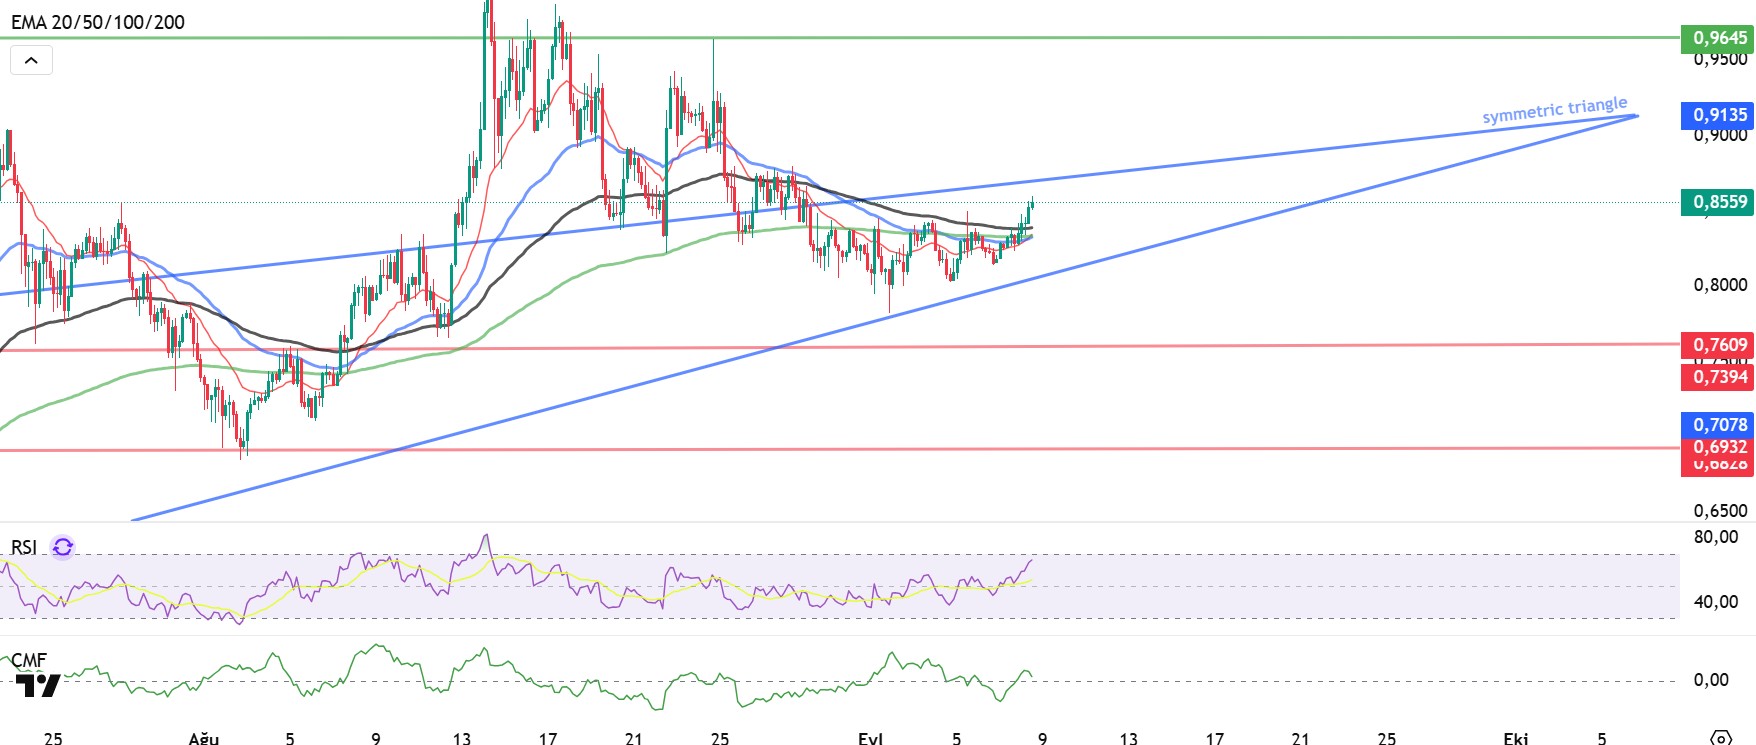
ADA got the first reaction by breaking the support level of 0.8075, which I expected to fall during the day. The CMC Altcoin Season Index report rose to 57, surpassing the 1.68T level. This bullish signal in altcoins was signaled by ADA price rising 0.60% on the day, indicating a confirmation of the reversal of the double bottom pattern in the minor channel. ADA continues its bullish move in the ascending symmetrical triangle pattern at 0.8575. Last week, it failed to break the resistance zone of 0.8788 and returned to 0.8508 levels. The first resistance point we will follow during the day may be 0.8788 dollar levels. If the closes below the 0.8149 level, the price may move out of the rising symmetrical triangle pattern and selling pressure may increase. The price continues to maintain its bullish potential on volume, staying above all moving averages. Especially the 20-day Exponential Moving Average (EMA 20 – Red Line) and (EMA 50 – Blue Line) are important for the continuation of the uptrend. Relative Strength Index (RSI) rose to 65, signaling that it is approaching the overbought zone, while Chaikin Money Flow (CMF-20) rose to 0.2, indicating that there may be buying potential. A bullish signal in inflows could keep CMF in positive territory and the positive correlation between the two indicators could herald a buying bias. In case of Trump’s statements today or in case of purchases related to the ADA ecosystem, the $ 0.9135 level may appear as our strong resistance point. If the decline starts, the 0.7851 level is the important support level we will follow.
Supports 0.7851 – 0.7380 – 0.7170
Resistances 1.1943 – 1.0954 – 0.9135
Legal Notice
The investment information, comments, and recommendations contained herein do not constitute investment advice. Investment advisory services are provided individually by authorized institutions taking into account the risk and return preferences of individuals. The comments and recommendations contained herein are of a general nature. These recommendations may not be suitable for your financial situation and risk and return preferences. Therefore, making an investment decision based solely on the information contained herein may not produce results in line with your expectations.

