
Technical Analysis
BTC/USDT
Trump stated that he would announce an executive order introducing “a single rule” at the national level instead of 50 states in the field of artificial intelligence. Discussions regarding Fed policy intensified with Hassett indicating that Powell might also be inclined toward a cautious rate cut.On the institutional side, Strategy increased its holdings to 660,624 BTC by purchasing an additional 10,624 BTC during the week of December 1–7, while appetite for digital assets was supported by a strong weekly inflow of $716 million, according to CoinShares data.
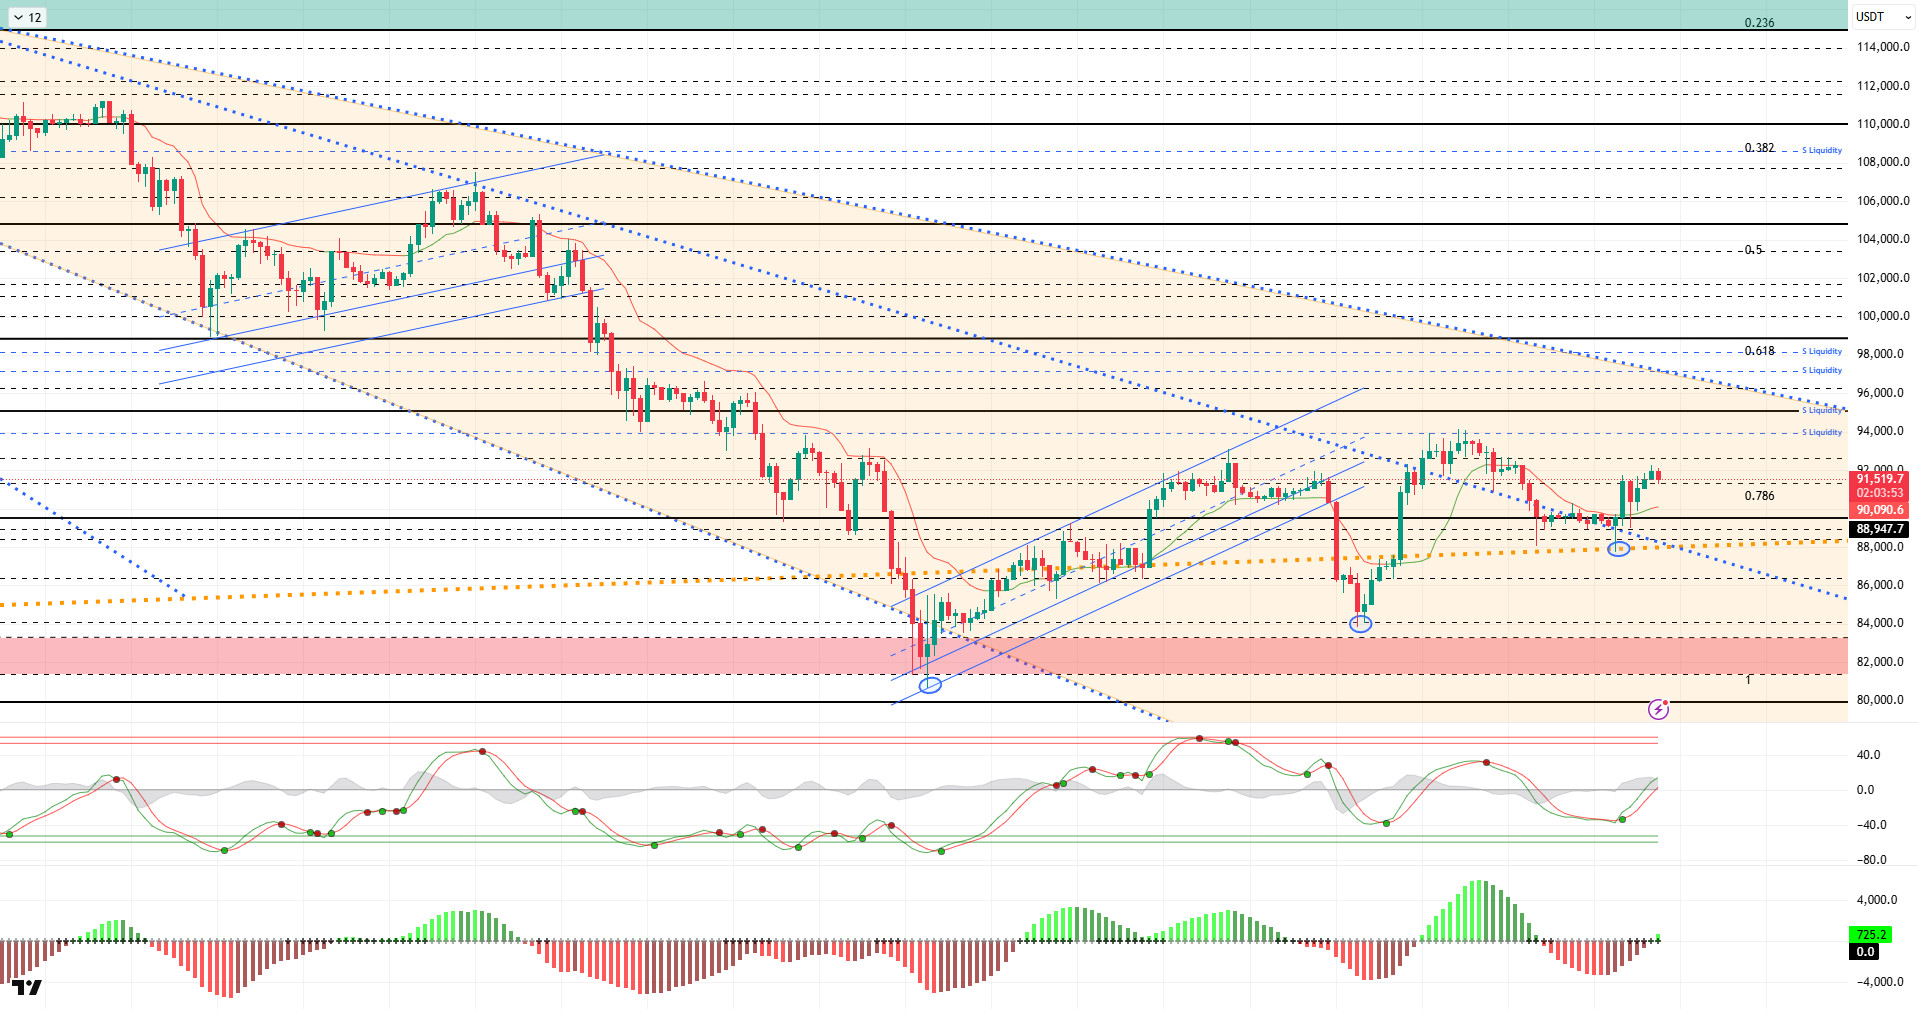
From a technical perspective, BTC broke below the flag pattern it had formed in previous analyses, touching the 87,500 level, which is the point where the major uptrend passed. The price, which left the decline in this region as a spike, recovered and moved above the falling trend line. BTC then spiked to this point once more, quickly recovered, and managed to break above the 90,000 reference zone. At the time of writing, it continues to trade at the 91,500 level.
Technical indicators show the Wave Trend (WT) oscillator giving a buy signal just above the oversold zone, while the histogram on the Squeeze Momentum (SM) indicator gained strength within the negative zone. The Kaufman Moving Average (KAMA) has now crossed below the price at the $89,800 level.
According to liquidation data, the recent decline resulted in liquidation of trades accumulated in the 90,000–88,000 range. Sell-side transactions are intensifying in the short term at the 92,000 – 94,500 level, while in the monthly view, they continue to maintain their intensity within the 97,000 – 98,000 band.
In summary, a new national security strategy was released in the US on the global front. Progress was made towards peace in the Ukraine-Russia war. Regional tensions increased between China and Japan. Technically, after testing the bottom level, the price recovered above the 90,000 level following a downward trend that started from the ATH level. Liquidity data shows that target areas have regained importance and the market has stabilized. After this stage, 90,000 has become a critical point again for the price to maintain its momentum. Closings and pricing above this level are an important indicator for regaining momentum. In this context, 95,000 stands out as the next target area, and liquidity areas will be monitored once it is passed. In the event of potential selling pressure, 90,000 will once again emerge as the reference area, and in the event of a breakout, the 87,500 level, where the major uptrend passed, will be monitored.
Supports: 90,000 – 89,000 – 87,800
Resistances: 91,400 – 92,600 – 94,000
ETH/USDT
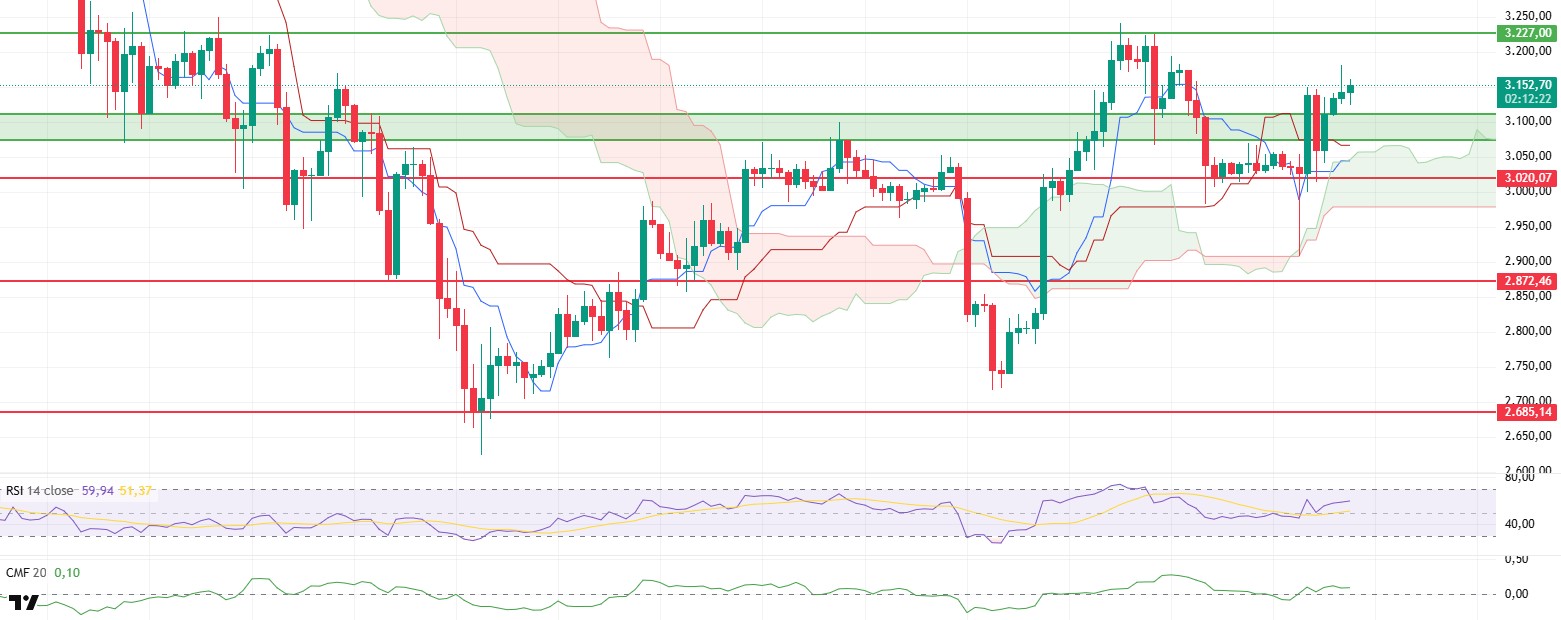
The ETH price managed to rise to the $3,180 level on the first trading day of the week, maintaining buyer support. Although a slight pullback emerged after this movement approached the resistance zone, the price still maintains its position in the high range. This picture shows that the upward momentum continues despite short-term fluctuations.
The positive outlook on the liquidity side continues. The CMF indicator remaining in positive territory indicates that capital inflows into the market are still strong. With spot sales declining, it can be said that upward attempts are beginning to gain firmer ground.
The positive trend is also maintained on the momentum side. The RSI indicator continues its upward structure, signaling that buyers’ influence in the market has not weakened. Although it is not yet very close to overbought territory, the upward momentum strengthens the possibility of resistance levels being retested in the short term.
The Ichimoku indicator confirms that the trend outlook remains intact. As long as the price stays above the cloud, the medium-term bullish scenario will remain on the table. Even if there are short-term pullbacks, the fact that both the Tenkan and Kijun lines are in a supportive position keeps the technical structure strong.
Looking at the overall picture of the market, it is clear that the bulls still hold control. The $3,227 level may be tested again during the day. If this region is broken, the $3,285 and $3,350 levels could quickly come into focus. On the downside, the $3,110 and then $3,020 levels are being monitored as key support areas that need to be defended. As long as prices remain above these levels, the trend will remain positive. In short, the bullish scenario for ETH is still strong, and each approach to the resistance area increases the likelihood of an upward breakout. If buyers maintain the current momentum, new peak attempts appear highly likely.
Supports: 3,070 – 3,020 – 2,872
Resistances: 3,227 – 3,436 – 3,672
XRP/USDT
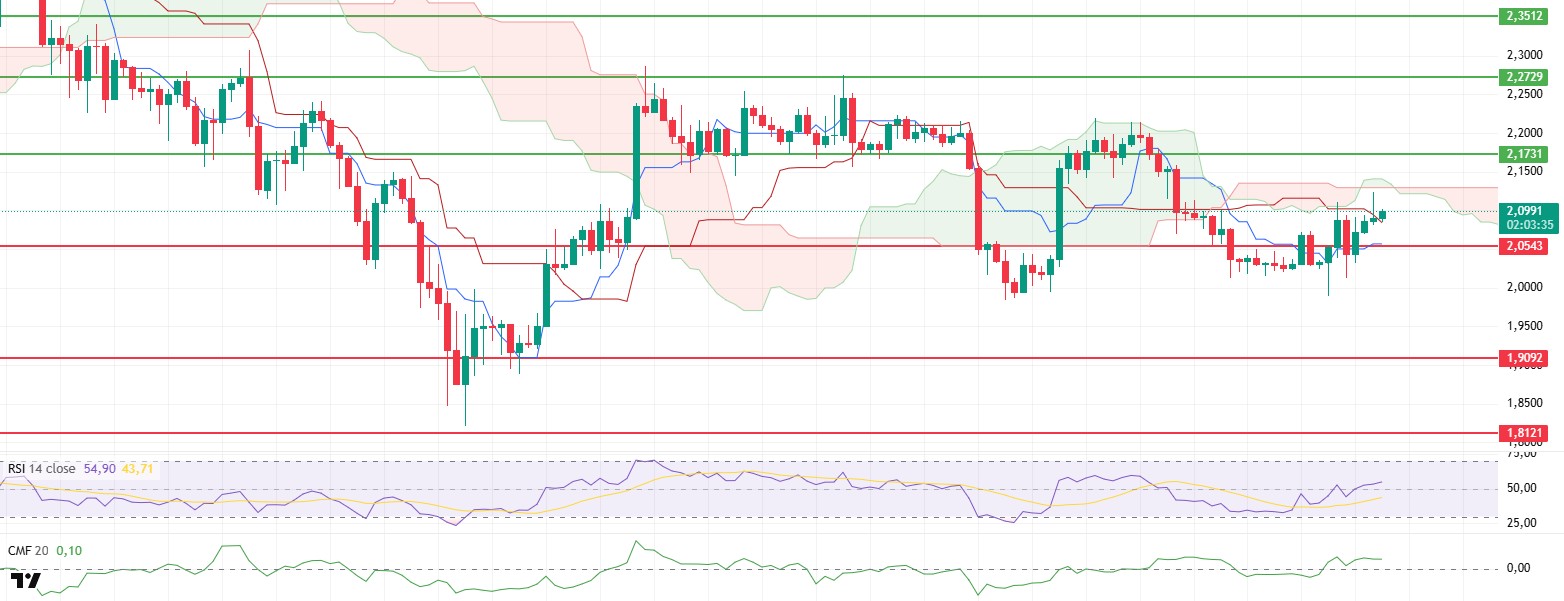
The XRP price continued its recovery attempt during the day, rising to the $2.12 level. This area is significant as a technical boundary, as it represents the lower band of the Kumo cloud. Buyers failed to produce a strong breakout at this level, and the price continues to attempt to stabilize around $2.10.
The supportive structure on the liquidity side remains intact. The Chaikin Money Flow (CMF) continues its trend in positive territory, indicating that capital entering the market is still present. This situation shows that reactions from low levels have not been in vain and that appetite has not completely disappeared.
On the momentum side, the Relative Strength Index (RSI) has moved away from weak levels and continues its upward movement. While it does not yet signal a strong trend reversal, it keeps the price’s upward potential alive.
In the trend outlook, caution is warranted. The Ichimoku structure remains seller-dominated. The price being below the cloud is causing upward attempts to remain under pressure. Confirming a medium-term directional shift without breaking through the cloud resistance appears challenging.
As the day draws to a close, XRP is trading in a short-term decision zone. If it breaks above the $2.12 level, volatility could pick up again, and the likelihood of testing the $2.17 resistance level increases. However, if the price remains weak below $2.10, the possibility of renewed downward pressure and a pullback towards the $2.05 level remains on the table. In summary, buyers are active, but the recovery is still fragile. For the trend to turn more clearly positive, both the cloud resistance must be broken and volume support must strengthen.
Supports: 2.0543 – 1.9092 – 1.8121
Resistances: 2.1731 – 2.2729 – 2.3512
SOL/USDT
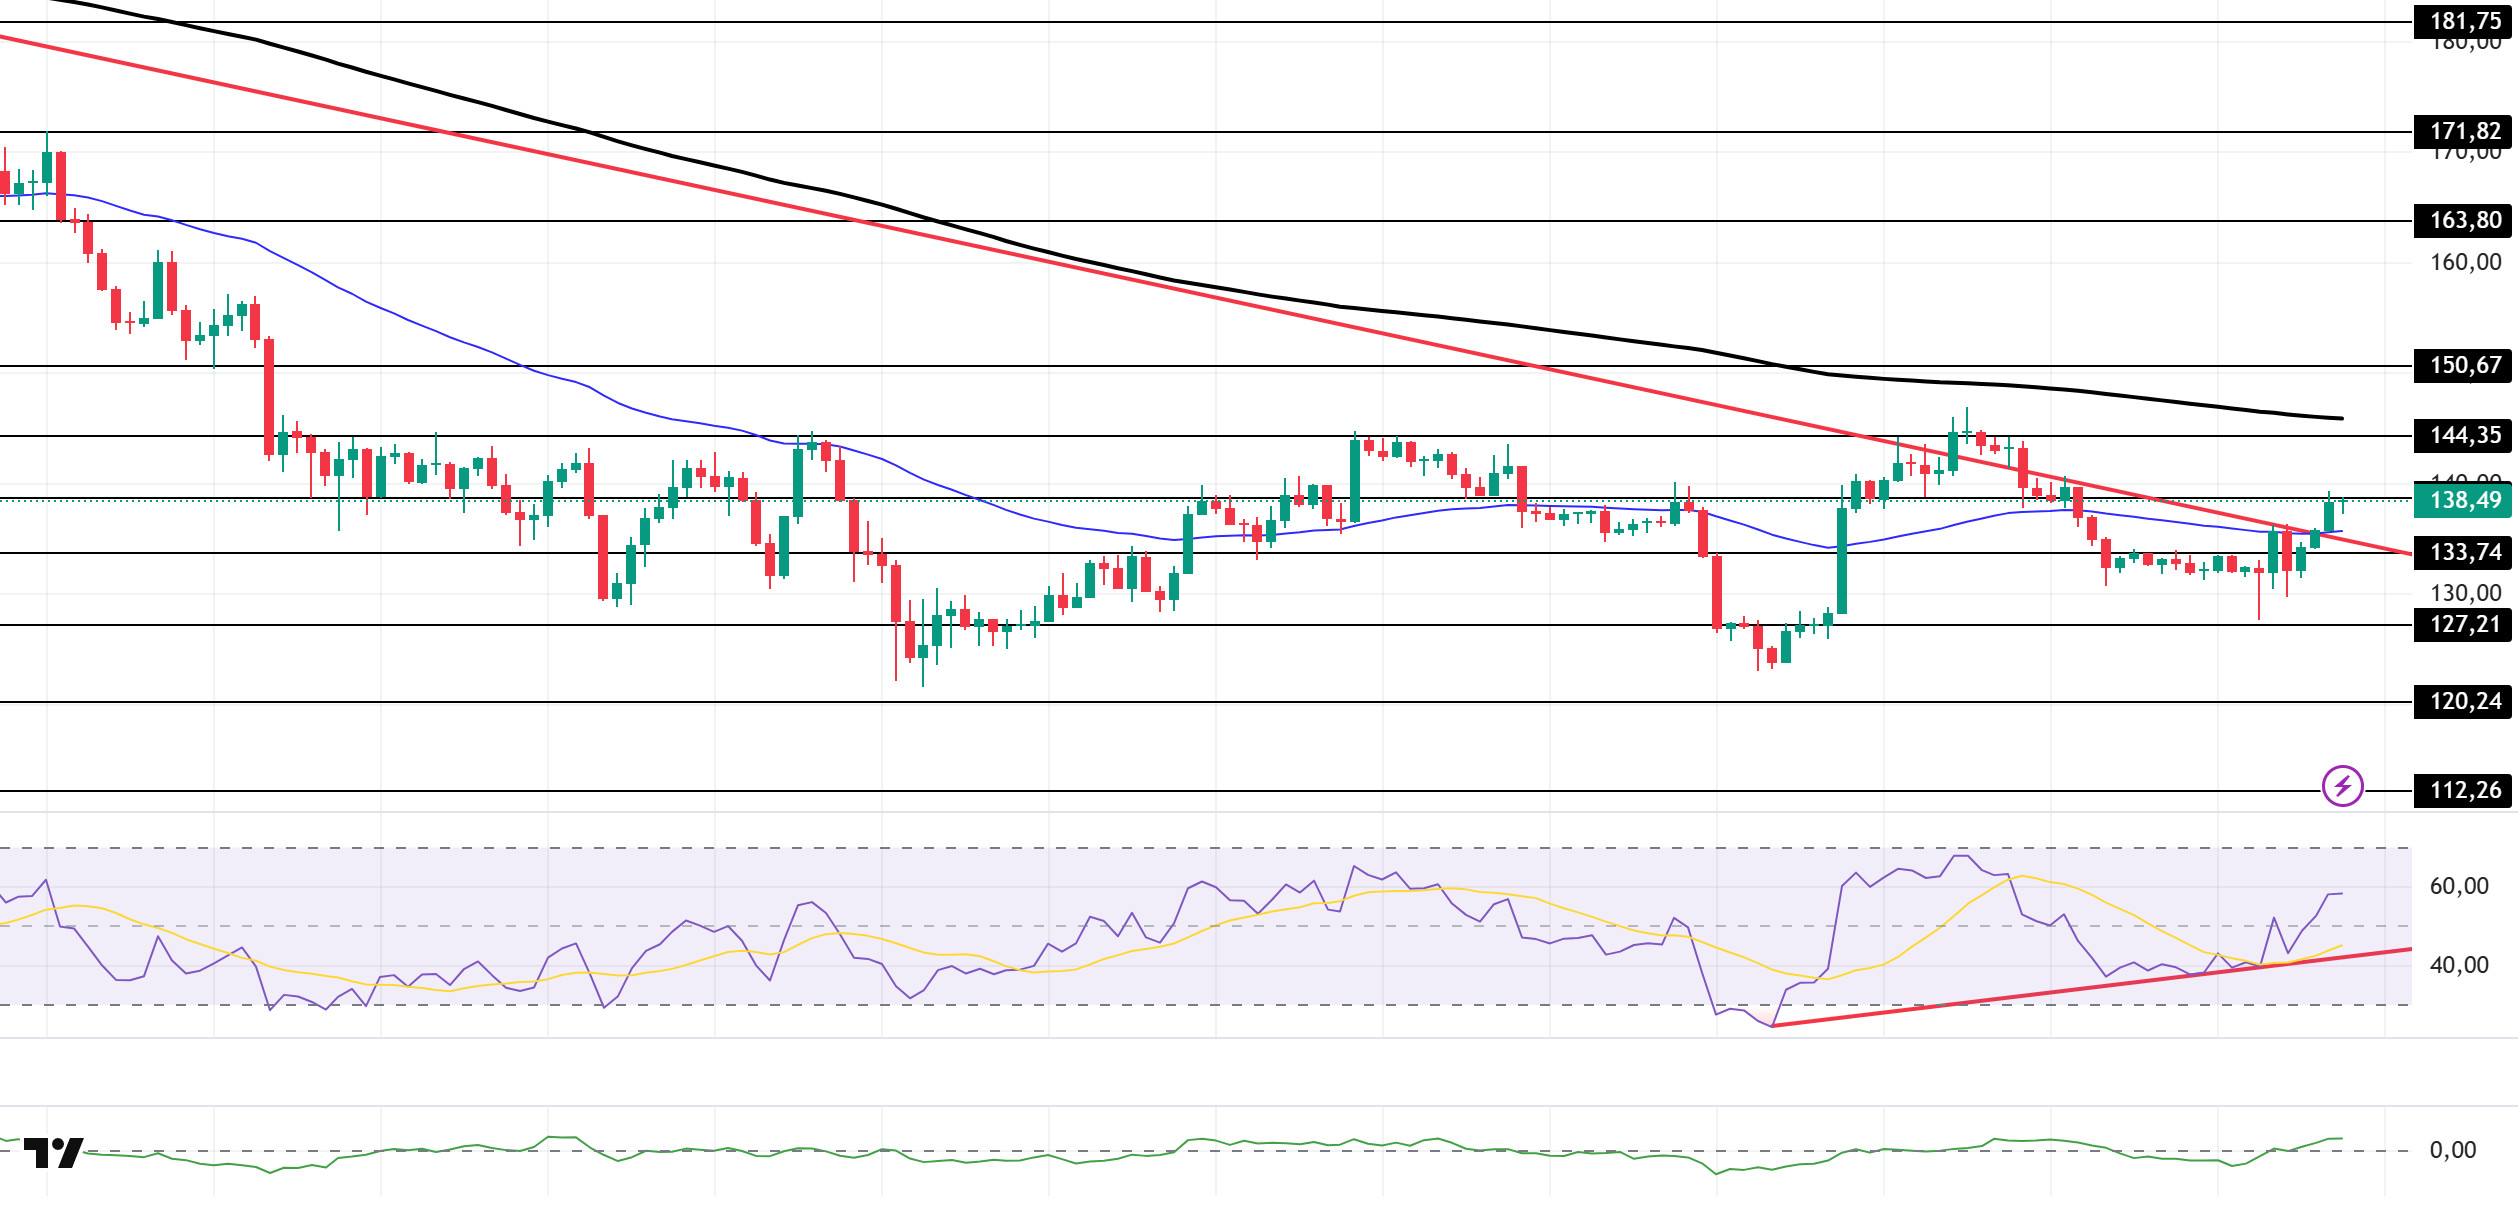
The SOL price experienced an increase during the day. The asset moved to the upper region of the downward trend that began on October 6. Breaking above the downward trend, which is a strong resistance level, and the 50 EMA (Blue Line) moving average, the price is currently testing the $138.73 level as resistance. If the upward movement continues, the 200 EMA (Black Line) moving average should be monitored. In the event of a pullback, the downward trend line and 50 EMA (Blue Line) could be triggered.
On the 4-hour chart, the price remained below the 50 EMA (Exponential Moving Average – Blue Line) and 200 EMA (Black Line). This indicates a possible downtrend in the medium term. At the same time, the price being between the two moving averages indicates that the asset is in a decision phase in the short term. The Chaikin Money Flow (CMF-20) remained at a positive level. However, balanced cash inflows and outflows may keep the CMF in positive territory. The Relative Strength Index (RSI-14) rose from the middle of the negative zone to the middle of the positive zone. It also continued to hold above the upper region of the upward trend that began on December 1. This may indicate that buying pressure continues. If there is an uptrend due to macroeconomic data or positive news related to the Solana ecosystem, the $163.80 level stands out as a strong resistance point. If this level is broken upwards, the uptrend is expected to continue. In the event of pullbacks due to developments in the opposite direction or profit-taking, the $120.24 level could be tested. A decline to these support levels could increase buying momentum, presenting a potential upside opportunity.
Supports: 133.74 – 127.21 – 120.24
Resistances: 138.73 – 144.35 – 150.67
DOGE/USDT
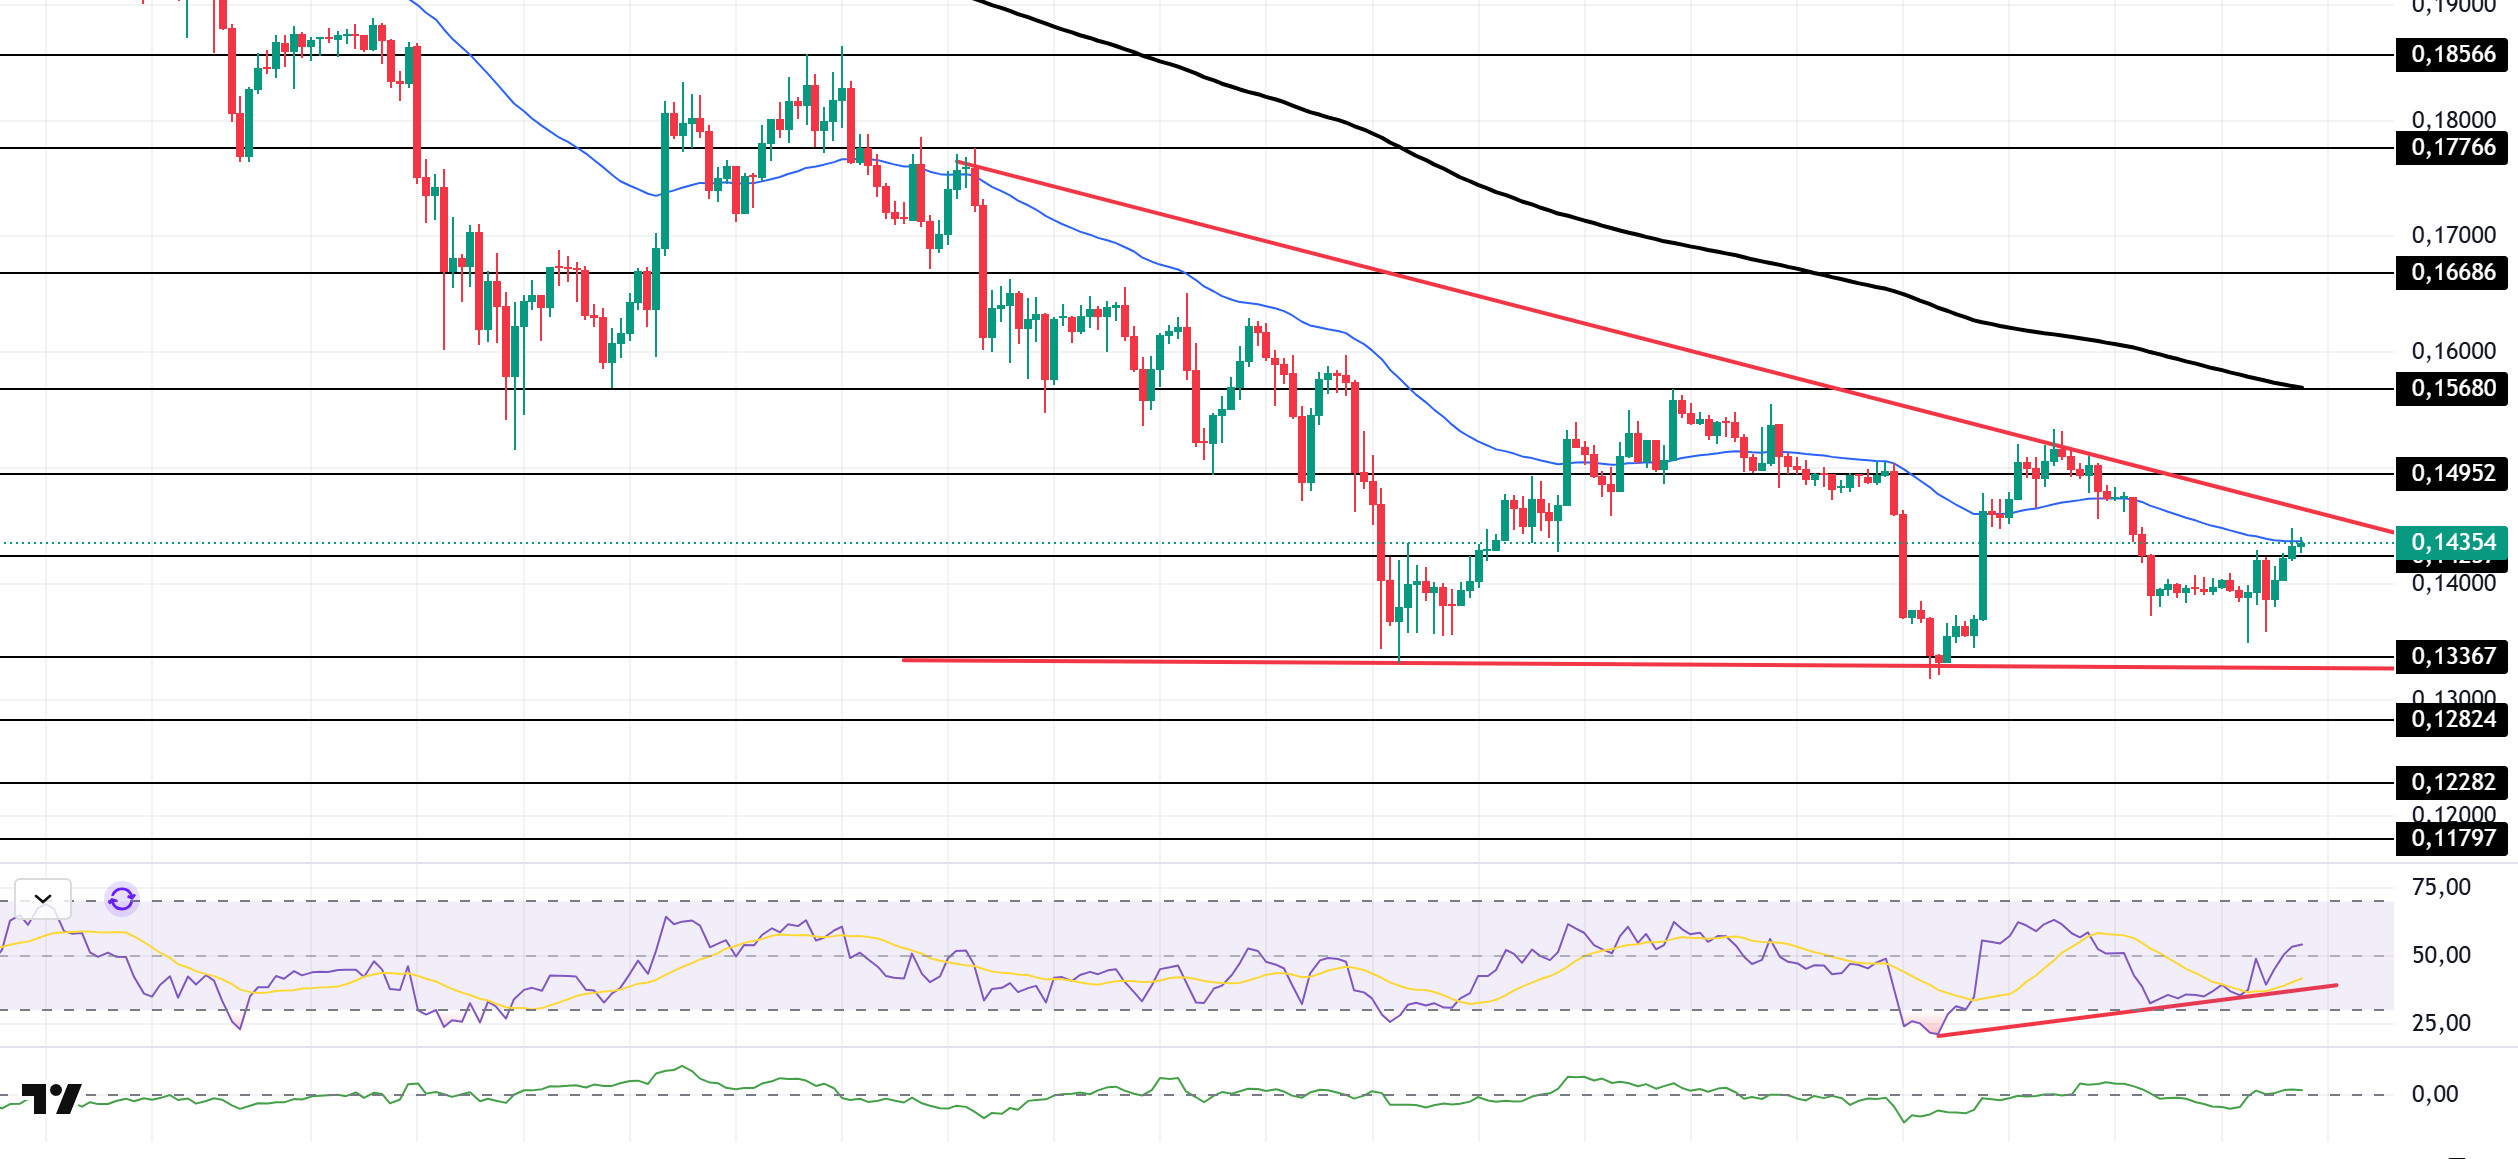
The DOGE price experienced an uptick during the day. The asset lost value after encountering direct resistance from the decline that began on November 13 and broke below the 50 EMA (Blue Line) moving average. Furthermore, the price, which continues to remain within the descending triangle formation, is currently testing the 50 EMA (Blue Line) moving average as resistance. In the event of a pullback, it may test the $0.13367 level and the base level of the descending triangle formation. If an uptrend begins, the ceiling level of the descending triangle formation should be monitored.
On the 4-hour chart, the 50 EMA (Exponential Moving Average – Blue Line) remained below the 200 EMA (Black Line). This indicates that the downtrend may continue in the medium term. The price being below both moving averages shows that the downward trend is continuing in the short term. The Chaikin Money Flow (CMF-20) has moved into positive territory. Additionally, the balance of money inflows and outflows may keep the CMF in positive territory. The Relative Strength Index (RSI-14) accelerated from the middle of negative territory to positive territory. At the same time, it remained above the rising line that began on December 1. This signaled that buying pressure could build. In the event of an upward movement driven by political developments, macroeconomic data, or positive news flow in the DOGE ecosystem, the $0.15680 level stands out as a strong resistance zone. Conversely, in the event of negative news flow, the $0.13367 level could be triggered. A decline to these levels could increase momentum and initiate a new wave of upward movement.
Supports: $0.14237 – $0.13367 – $0.12824
Resistances: 0.14952 – 0.15680 – 0.16686
AVAX/USDT
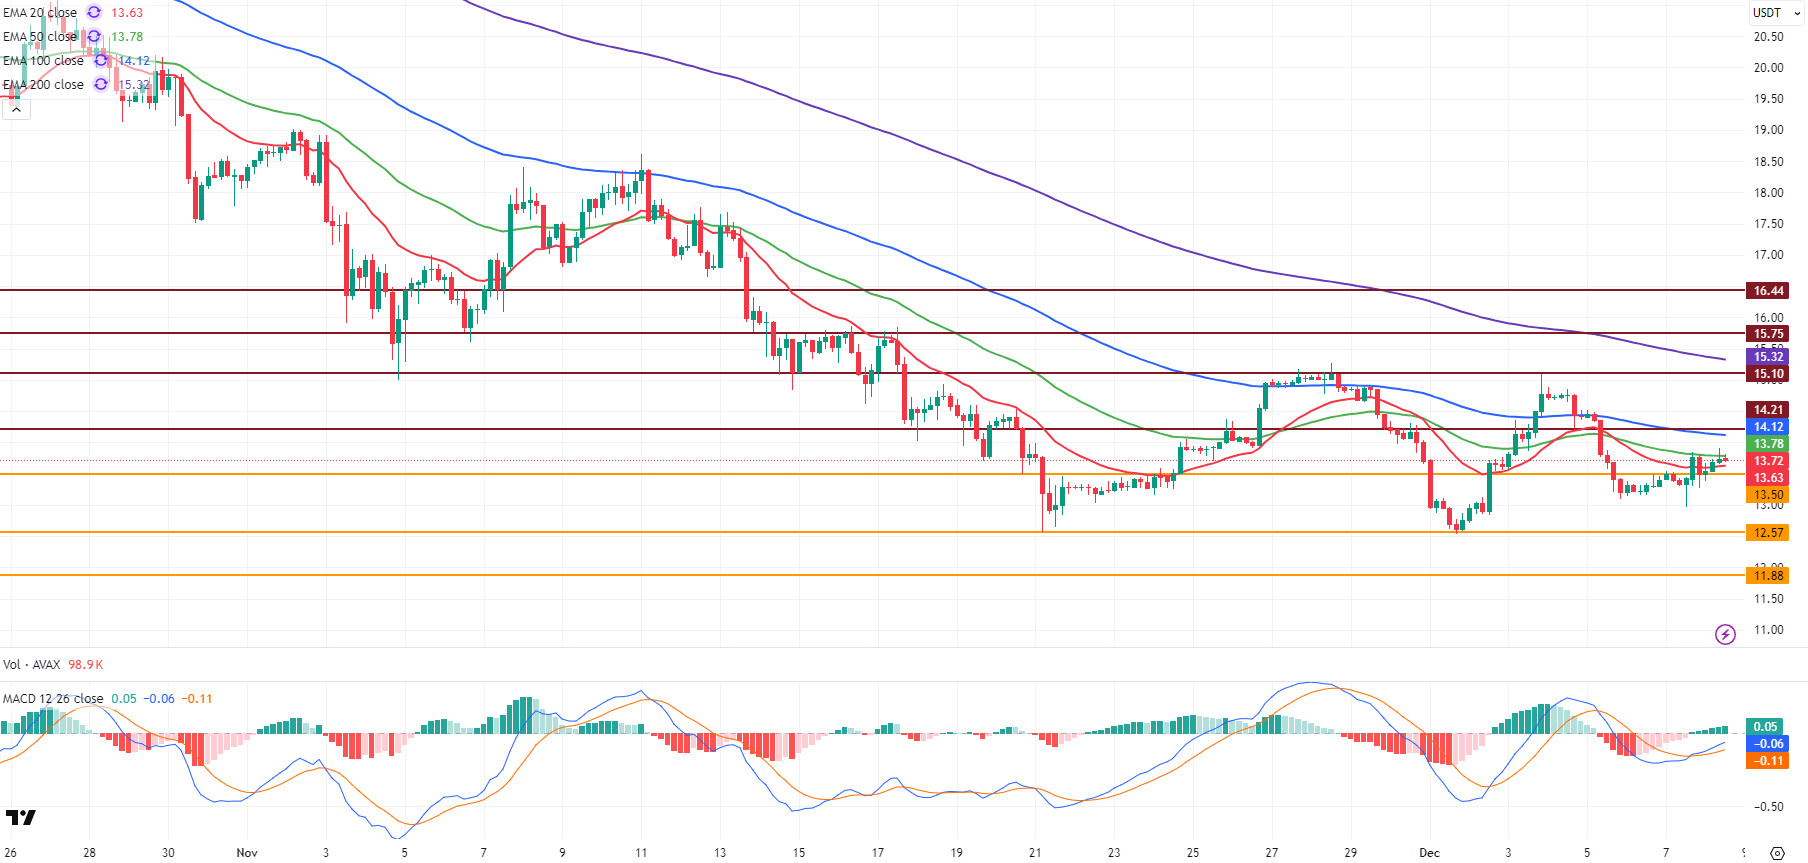
AVAX started the new day at $13.49 and continued its upward trend, first breaking through the $13.50 level and then the 20-period Exponential Moving Average (EMA20) level. AVAX continues to trade above the $13.70 level today with its upward movement. Throughout last week, AVAX showed weak momentum in line with the overall market, with the price frequently finding support in the $13.10-$13.50 range. This week’s rise indicates that the slight recovery seen in the crypto market has also reflected on AVAX. However, AVAX still faces strong selling pressure in resistance zones, and the rise appears to be limited.
On the 4-hour chart, the Moving Average Convergence/Divergence (MACD) line continues to trade above the signal line and is pointing upwards. While this is a positive sign indicating that the short-term recovery trend is continuing, the fact that the MACD is in negative territory shows that the rise is not accompanied by strong momentum. The MACD moving into positive territory could technically confirm a short-term trend reversal. Furthermore, while AVAX breaking through the EMA20 level is a positive signal, its continued trading below the EMA50 and EMA100 indicates that the trend reversal is not yet complete. For AVAX to gain momentum in its upward movement, it is important that it breaks through the EMA50 and then maintains stability above the EMA100.
From a technical perspective, the $14.21 level, along with the EMA50 and EMA100 levels, stands out as the first significant resistance zone for AVAX in the short term. A break above this zone could accelerate AVAX’s move toward the $15.10 resistance level. However, if strong momentum does not develop, it is likely that the upward movement will encounter selling pressure at resistance levels and will not be able to remain above this zone. In a downward scenario, the $13.50 level is the first critical support, and closing below this level could cause AVAX to fall back towards the $12.57 and then $11.88 support levels. Overall, the MACD trading in negative territory and AVAX remaining below the EMA50 and EMA100 maintain the short-term negative outlook. Therefore, without strong momentum, upward attempts may remain limited at resistance levels.
(EMA20: Red Line, EMA50: Green Line, EMA100: Blue Line, EMA200: Purple Line)
Supports: 13.50 – 12.57 – 11.88
Resistances: 14.21 – 15.10 – 15.75
LINK/USDT
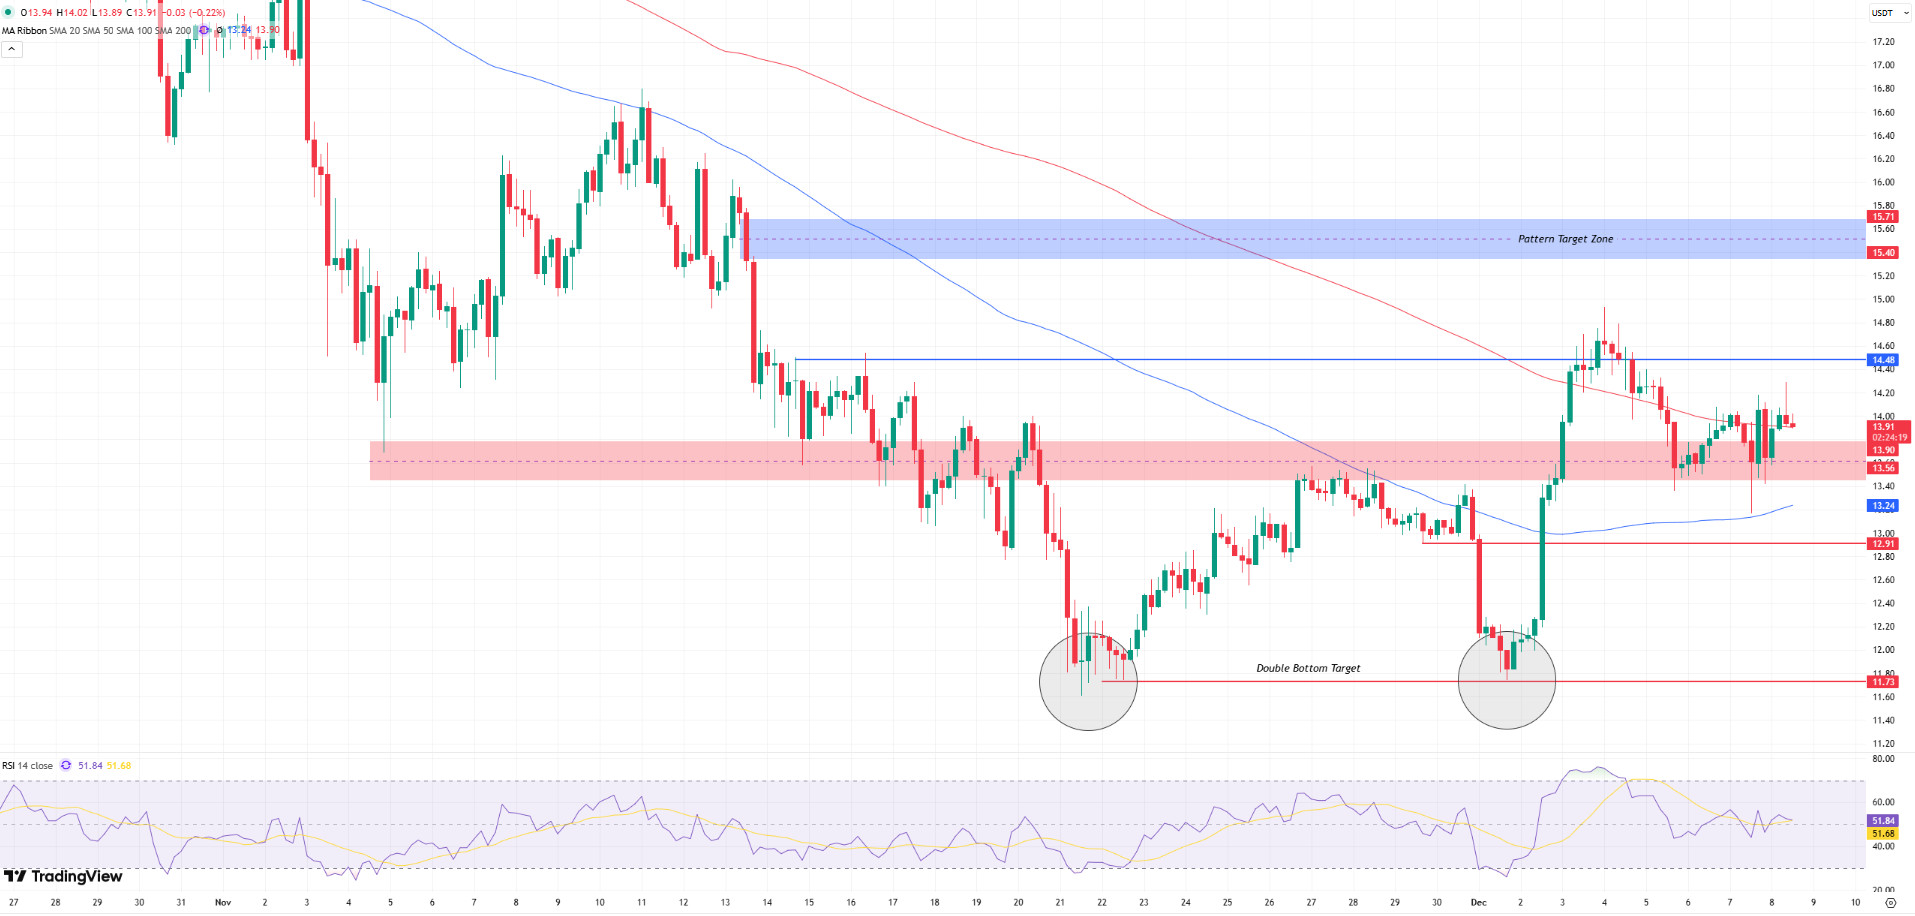
In our previous analysis, we mentioned that the double bottom formation in the 11.70 region was a critical turning point for the trend and pointed out that the price reaction from this level was structurally significant. After this dip formation, the price rose to the $14.48 resistance level and then brought profit-taking with it. Currently, Link is trading above the $13.56 – $13.90 support zone.
Although the price tested the 14.48 barrier in its latest rise, it has not yet managed to close above this level. On the chart, we see that as of today, the price is stuck between the 13.56 – 14.48 range and is in a decision phase. The fact that buyers are still active above 13.56 continues to support the positive structural outlook we mentioned in this morning’s analysis. A close above 14.48 could bring the 15.40 – 15.71 formation target zone, which we have marked as a target zone, back onto the technical agenda.
In an upward scenario, if the consolidation breaks and sustainability is achieved above the $14.48 level, the first area the price will encounter will be 15.40. This area carries the nature of a strong technical wall where profit-taking could occur, as it is both a previous supply zone and a formation target zone. Therefore, we must not forget the possibility that the rise may be limited at that point.
On the downside, the $13.56–$13.77 band remains our main reference zone. Losing this zone could cause short-term momentum to fade and initially pull the price towards the $12.91 support. However, as emphasized this morning, the critical threshold for a breakdown in structural positivity remains below $11.70. Breaking this zone invalidates the formation and could push the medium-term trend back to the negative side.
Although we see a short-term weakening in the Relative Strength Index (RSI), the current consolidation and positive technical structure make the possibility of an upward breakout much stronger. Closings above 14.48 could allow the trend to regain strength and initiate new momentum towards our target zone.
Supports: 13.56 – 12.91 – 11.73
Resistances: 14.48 – 15.40 – 15.71
Legal Notice
The investment information, comments, and recommendations contained herein do not constitute investment advice. Investment advisory services are provided individually by authorized institutions taking into account the risk and return preferences of individuals. The comments and recommendations contained herein are of a general nature. These recommendations may not be suitable for your financial situation and risk and return preferences. Therefore, making an investment decision based solely on the information contained herein may not produce results in line with your expectations.

