
Technical Analysis
BTC/USDT
The Fed’s November Beige Book revealed that economic activity remained flat, with signs of weakness in consumer spending and a noticeable softening in labor demand, while tariff-driven inflation pressures remained “moderate,” providing a backdrop that supports the possibility of a 25-basis-point cut in December. On the geopolitical front, Trump kept expectations alive that the parties could reach a preliminary agreement by extending the Thanksgiving deadline for Russia-Ukraine peace talks and allowing more time for negotiations. On the Asian front, Washington’s pursuit of a comprehensive trade agreement aimed at shifting semiconductor investments from Taiwan to the US brought the themes of supply chain security and strategic production relocation to the forefront of the week’s headlines.
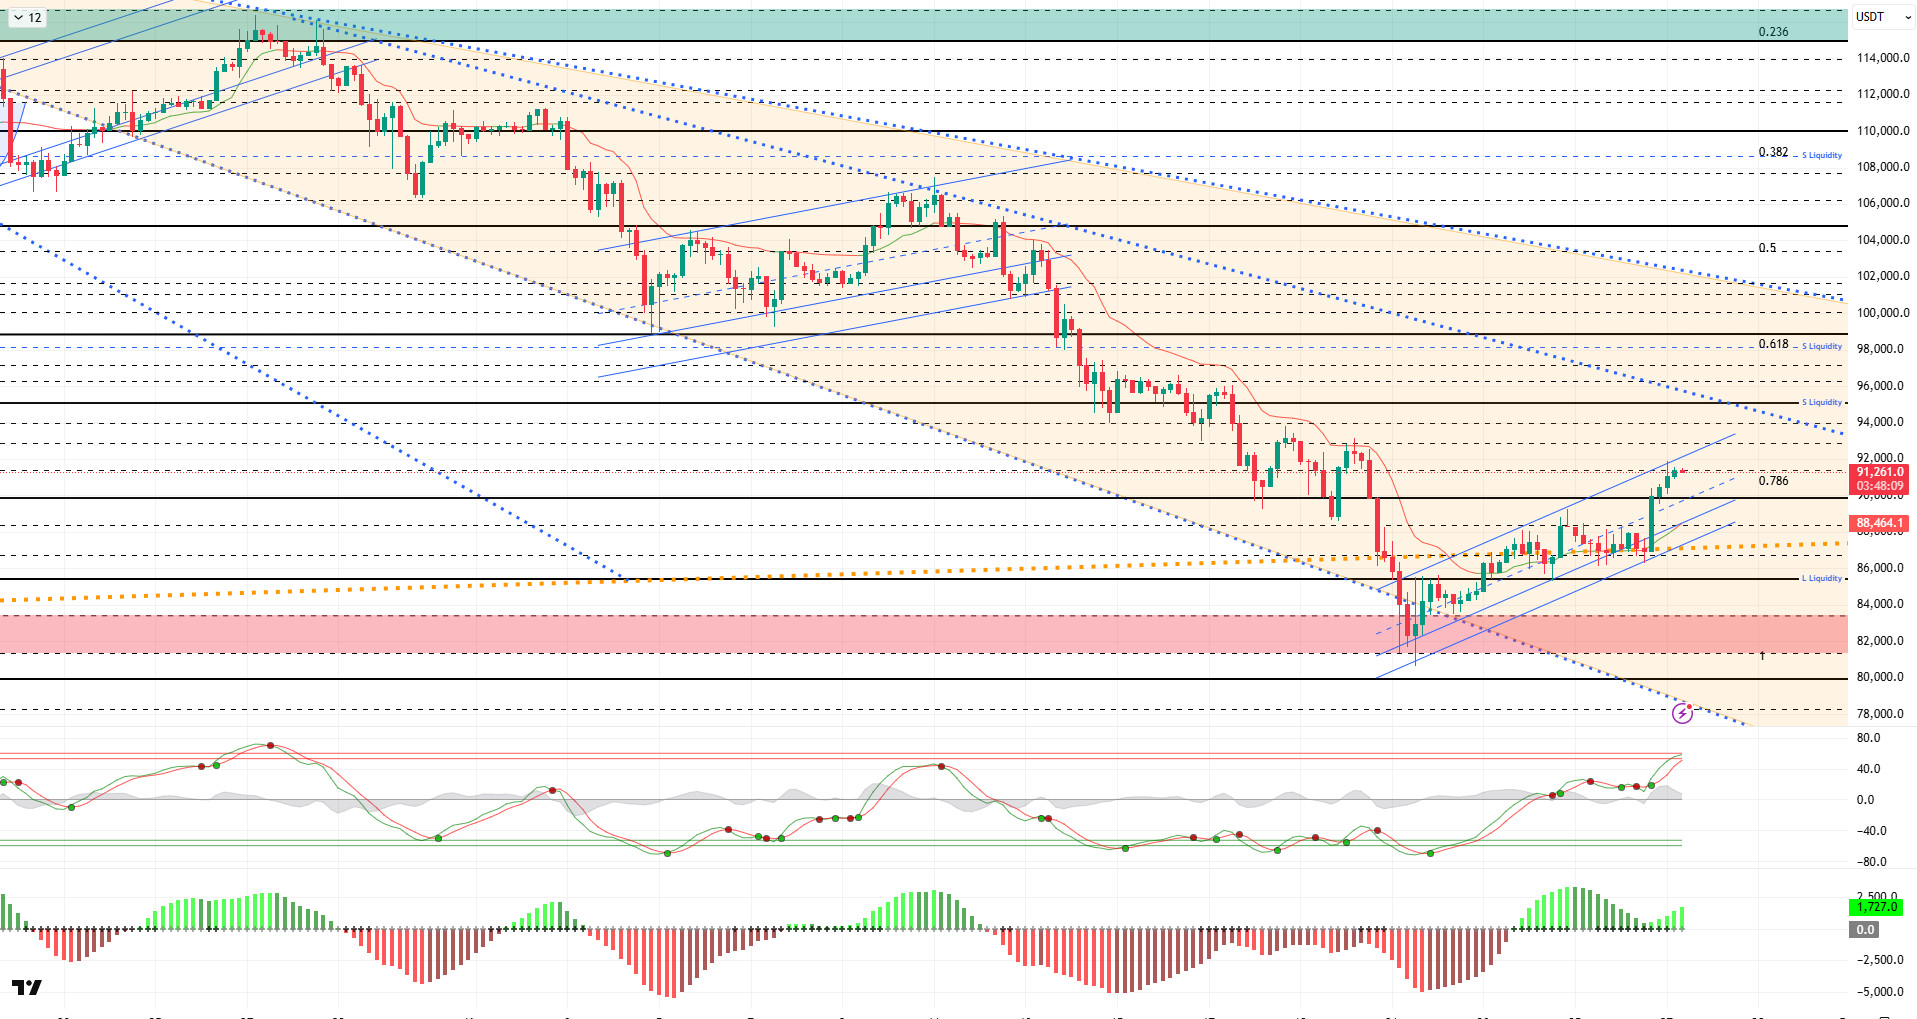
From a technical perspective, although the price occasionally dipped below the major trend line, it generally managed to stay above this line and created a suitable ground for regaining momentum. In parallel, the rebound that began after the horizontal price movements seen at the 87,000 level gave way to an upward channel. Catching the upward trend, BTC surpassed the 90,000 level and continued its upward momentum. Moving towards the major second descending trend line, the price continues to test the 91,400 resistance at the time of writing.
Technical indicators show that the Wave Trend (WT) oscillator, which had been giving indecisive buy/sell signals above the channel’s middle band, has now entered the overbought zone with its latest buy signal. The histogram on the Squeeze Momentum (SM) indicator has regained momentum within the positive zone.The Kaufman Moving Average (KAMA) is currently at the $88,500 level, positioned below the price.
According to liquidation data, investors are repositioning themselves in the buy zone with the latest rise, with 85,000 emerging as the short-term congestion level. The partial short-term sell zone is being liquidated at the 89,000 level, while the next sell zone maintains its accumulation at the 94,100 level.
In summary, following the rise driven by expectations of an interest rate cut in BTC, positive developments on the Russia-Ukraine front eased selling pressure, bringing the price into a consolidation phase and supporting it at current levels. Finally, the Beige Book’s background supporting interest rate cuts was a significant driving force in the price regaining momentum. Technically, the price successfully continued its attempt to form an upward channel with upward momentum, recovering from the 80,500 bottom and settling back above the 90,000 band. Liquidity data confirmed that target zones have regained importance and that a partial rebalancing has occurred in the market. For the uptrend to become sustainable in the coming period, closes above the 90,000 level, where the major uptrend line passes, are critical. Should demand regain strength and potential catalysts come into play, the 94,000 level emerges as an important liquidity zone, with 95,000 as the next reference zone. Conversely, should selling pressure increase, 90,000 remains a critical support level.
Supports: 90,000 – 89,000 – 87,000
Resistances: 91,400 – 92,600 – 94,000
ETH/USDT
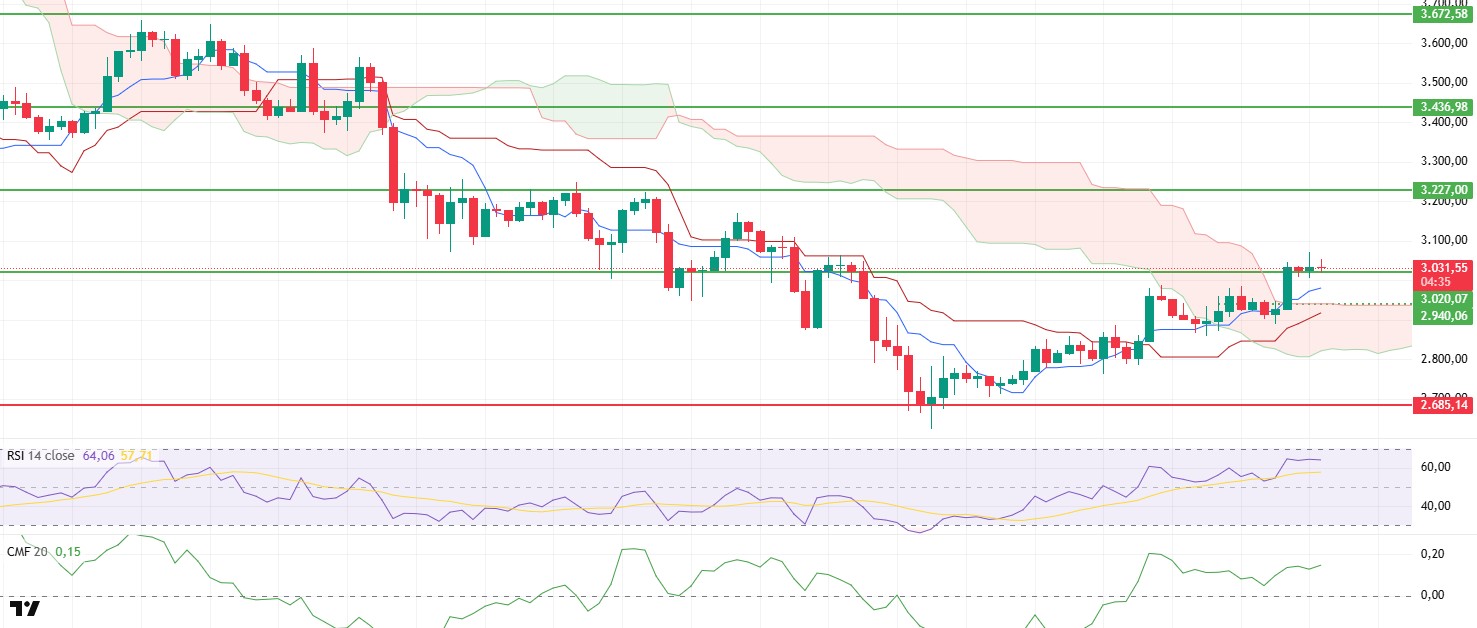
The Ethereum price broke out strongly yesterday evening, rising above the upper band of the cloud and quickly reaching $3,020, then $3,070 overnight. It is currently trading at $3,030 after a slight correction. This movement indicates that the upward momentum has regained strength.
The $1 billion increase in open interest, bringing total open positions to $16.6 billion, confirms that the rally is being fueled by the futures market. The CVD data also showing a weak structure on the spot side reveals that the price movement was triggered more by leveraged transactions. This situation indicates that the rise, despite being aggressive, may also have a fragile structure.
The Chaikin Money Flow (CMF) indicator has responded positively again, signaling increased liquidity inflows. The return of buyers to the market stands out as one of the key factors supporting the upward trend.
The Relative Strength Index (RSI) indicator quickly recovered from yesterday’s loss of strength and rose again. However, the RSI approaching the overbought zone signals an overheated market structure. This outlook increases the likelihood of volatility and interim corrections in the short term.
In the Ichimoku indicator, the price rising above the kumo cloud is considered a critical development from a technical perspective. This structure signals that a medium-term trend reversal may have begun, and as long as the price remains above the cloud, the positive technical outlook may continue to strengthen.
Looking at the overall picture, the $3,020 level is now an important short-term support position. Closings above this level could support the continuation of the upward movement towards the $3,085 and $3,150 targets. However, if the price falls below the $3,020 level again, profit-taking could accelerate and pullbacks towards the $2,980 region could be seen. For the bullish structure to be maintained, staying above the cloud and strengthening liquidity support on the spot side are of great importance.
Below the Form
Supports: 3,020 – 2,870 – 2,685
Resistances: 3,227 – 3,436 – 3,672
XRP/USDT
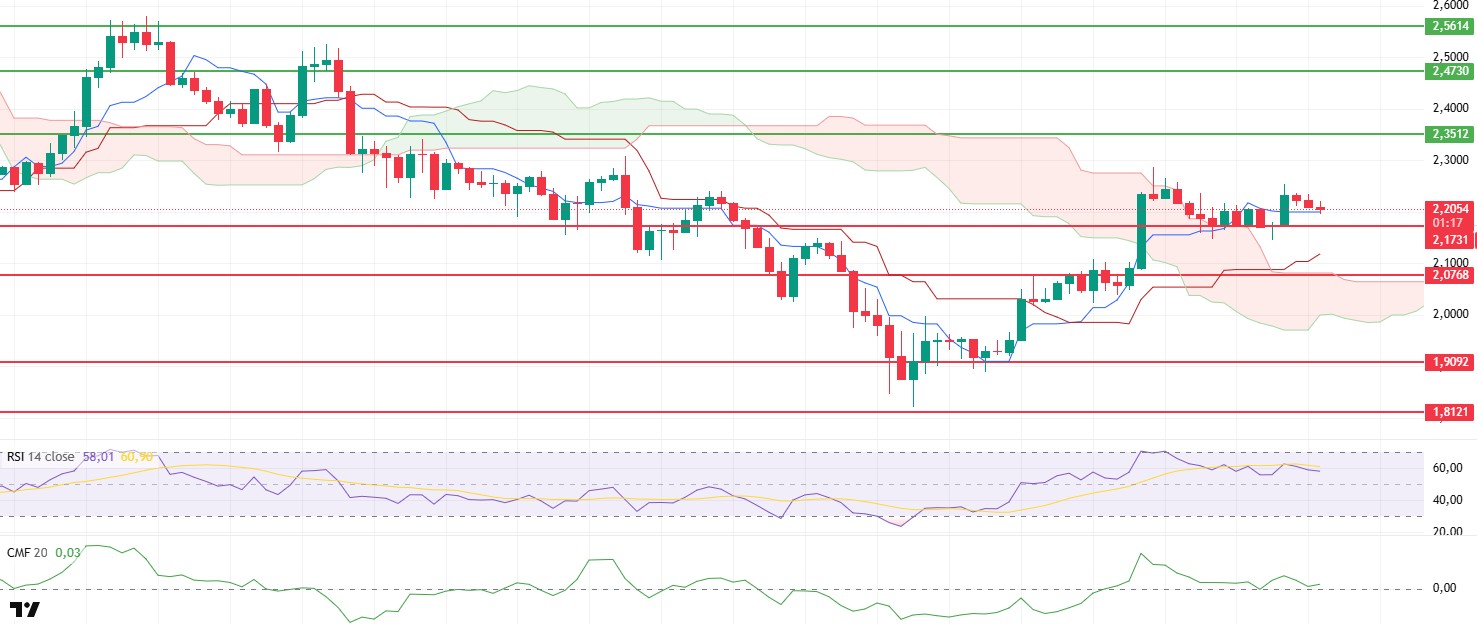
The XRP price regained the $2.17 level yesterday evening, strengthening its short-term positive outlook and, as expected, carried the upward movement to the $2.25 level. However, the selling pressure encountered in this region caused the price to ease slightly, and it is currently trading steadily around $2.20. This structure indicates that the market is still searching for direction.
The Chaikin Money Flow (CMF) indicator is showing a slight upward trend by managing to stay above the zero line. The fact that liquidity inflows are continuing, albeit at a limited level, indicates that buyers have not completely withdrawn from the market.
The Relative Strength Index (RSI) indicator continues to show a trend that can still be considered weak. The failure of momentum to gain clear strength confirms the continued reluctance in the price’s upward movement. The RSI rising above the 63 level will be critical for the uptrend to regain strength in the short term.
Although the price has not fully crossed the Tenkan level in the Ichimoku indicator, trading above the kumo cloud indicates that the positive technical structure is maintained in the medium term. As long as the cloud acts as support during the trend reversal process, the positive outlook will prevail.
The $2.17 level is an important intraday price threshold. If the price manages to stay above this support level, it is expected to test the $2.25 resistance again and attempt to rise towards the $2.35 level. However, if the price falls below the $2.17 level, selling pressure may increase, and a pullback towards the $2.07 level may come into play. In summary, there is cautious optimism in the XRP market in the morning hours. For the uptrend to gain momentum, both a recovery in momentum and a more pronounced liquidity inflow on the CMF side are needed.
Supports: 2.1731 – 2.0768 – 1.9092
Resistances: 2.3512 – 2.4730 – 2.5614
SOL/USDT
A South Korean-based centralized exchange suffered a $37 million hack attack on its Solana assets.
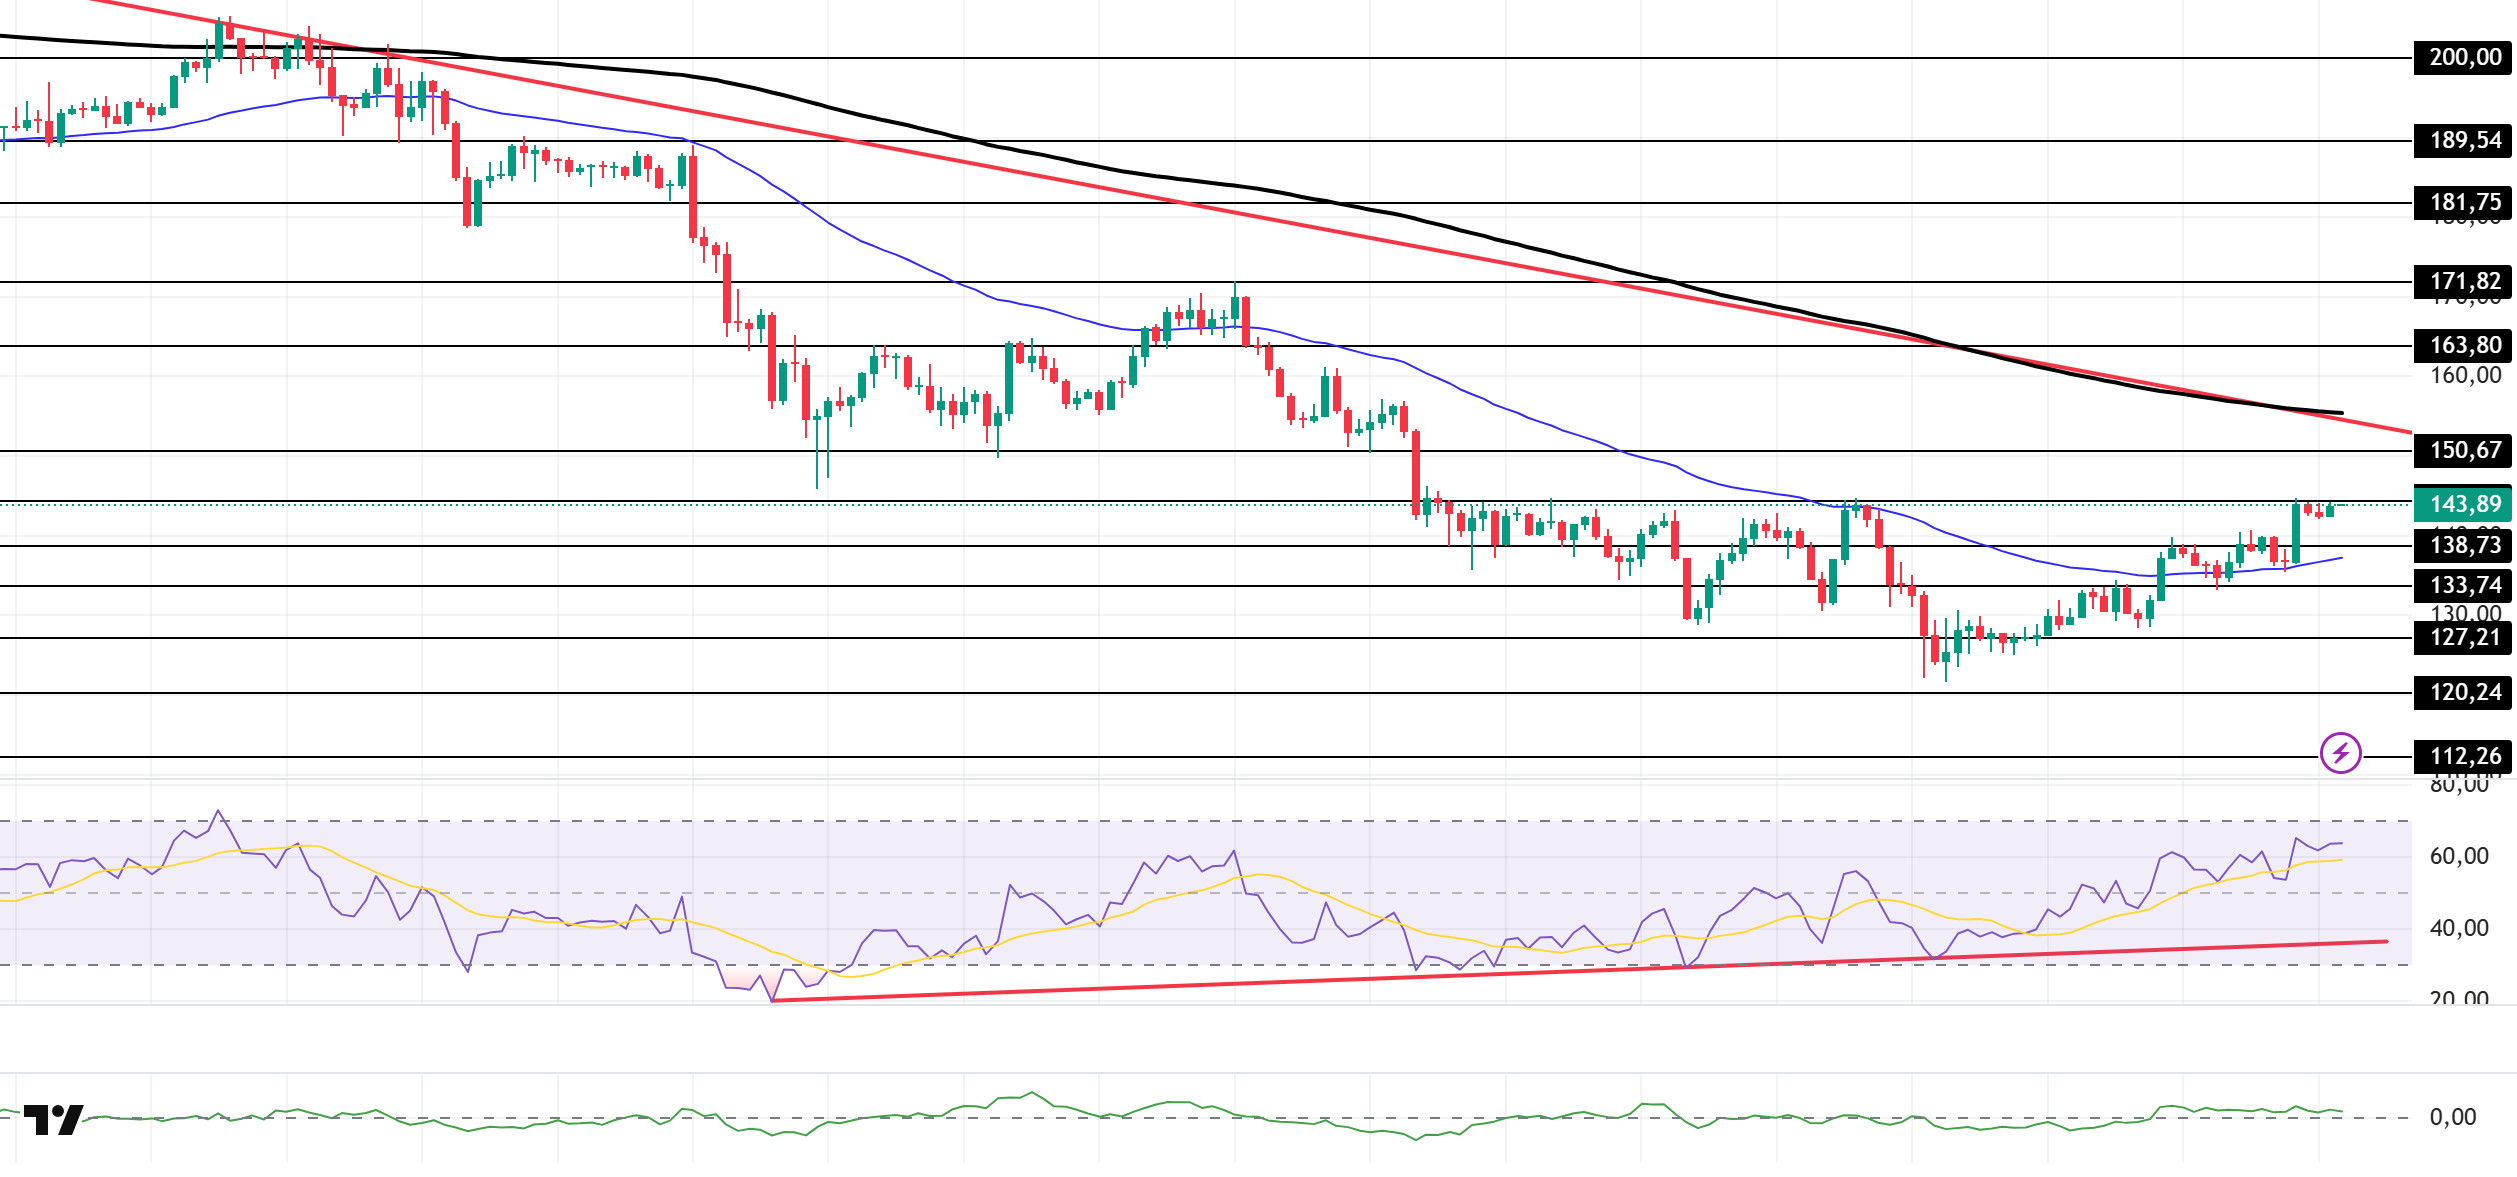
The SOL price continues to gain momentum. The asset remained in the lower region of the downtrend that began on October 6. Breaking above the strong resistance level of $133.74 and the 50 EMA (Blue Line) moving average with a strong candle, the asset continues its rise and is testing the $144.35 level as resistance. If the uptrend continues, it may test the $150.67 level and the downtrend line as resistance. If a pullback begins, it may test the 50 EMA (Blue Line) moving average as support.
On the 4-hour chart, it remained below the 50 EMA (Exponential Moving Average – Blue Line) and 200 EMA (Black Line). This indicates that it may be in a medium-term downtrend. At the same time, the price being between the two moving averages shows us that the asset is in a decision phase in the short term. The Chaikin Money Flow (CMF-20) remained in positive territory. However, increased outflows could push the CMF into negative territory. The Relative Strength Index (RSI-14) rose to the upper level of positive territory. It also remained above the upward trend that began on November 4. In the event of an uptrend driven by macroeconomic data or positive news related to the Solana ecosystem, the $150.67 level stands out as a strong resistance point. If this level is broken upwards, the uptrend is expected to continue. In the event of pullbacks due to developments in the opposite direction or profit-taking, the $127.21 level could be tested. A decline to these support levels could increase buying momentum, presenting a potential opportunity for an upward move.
Supports: 138.73 – 133.74 – 127.21
Resistances 144.35 – 150.67 – 163.80
DOGE/USDT
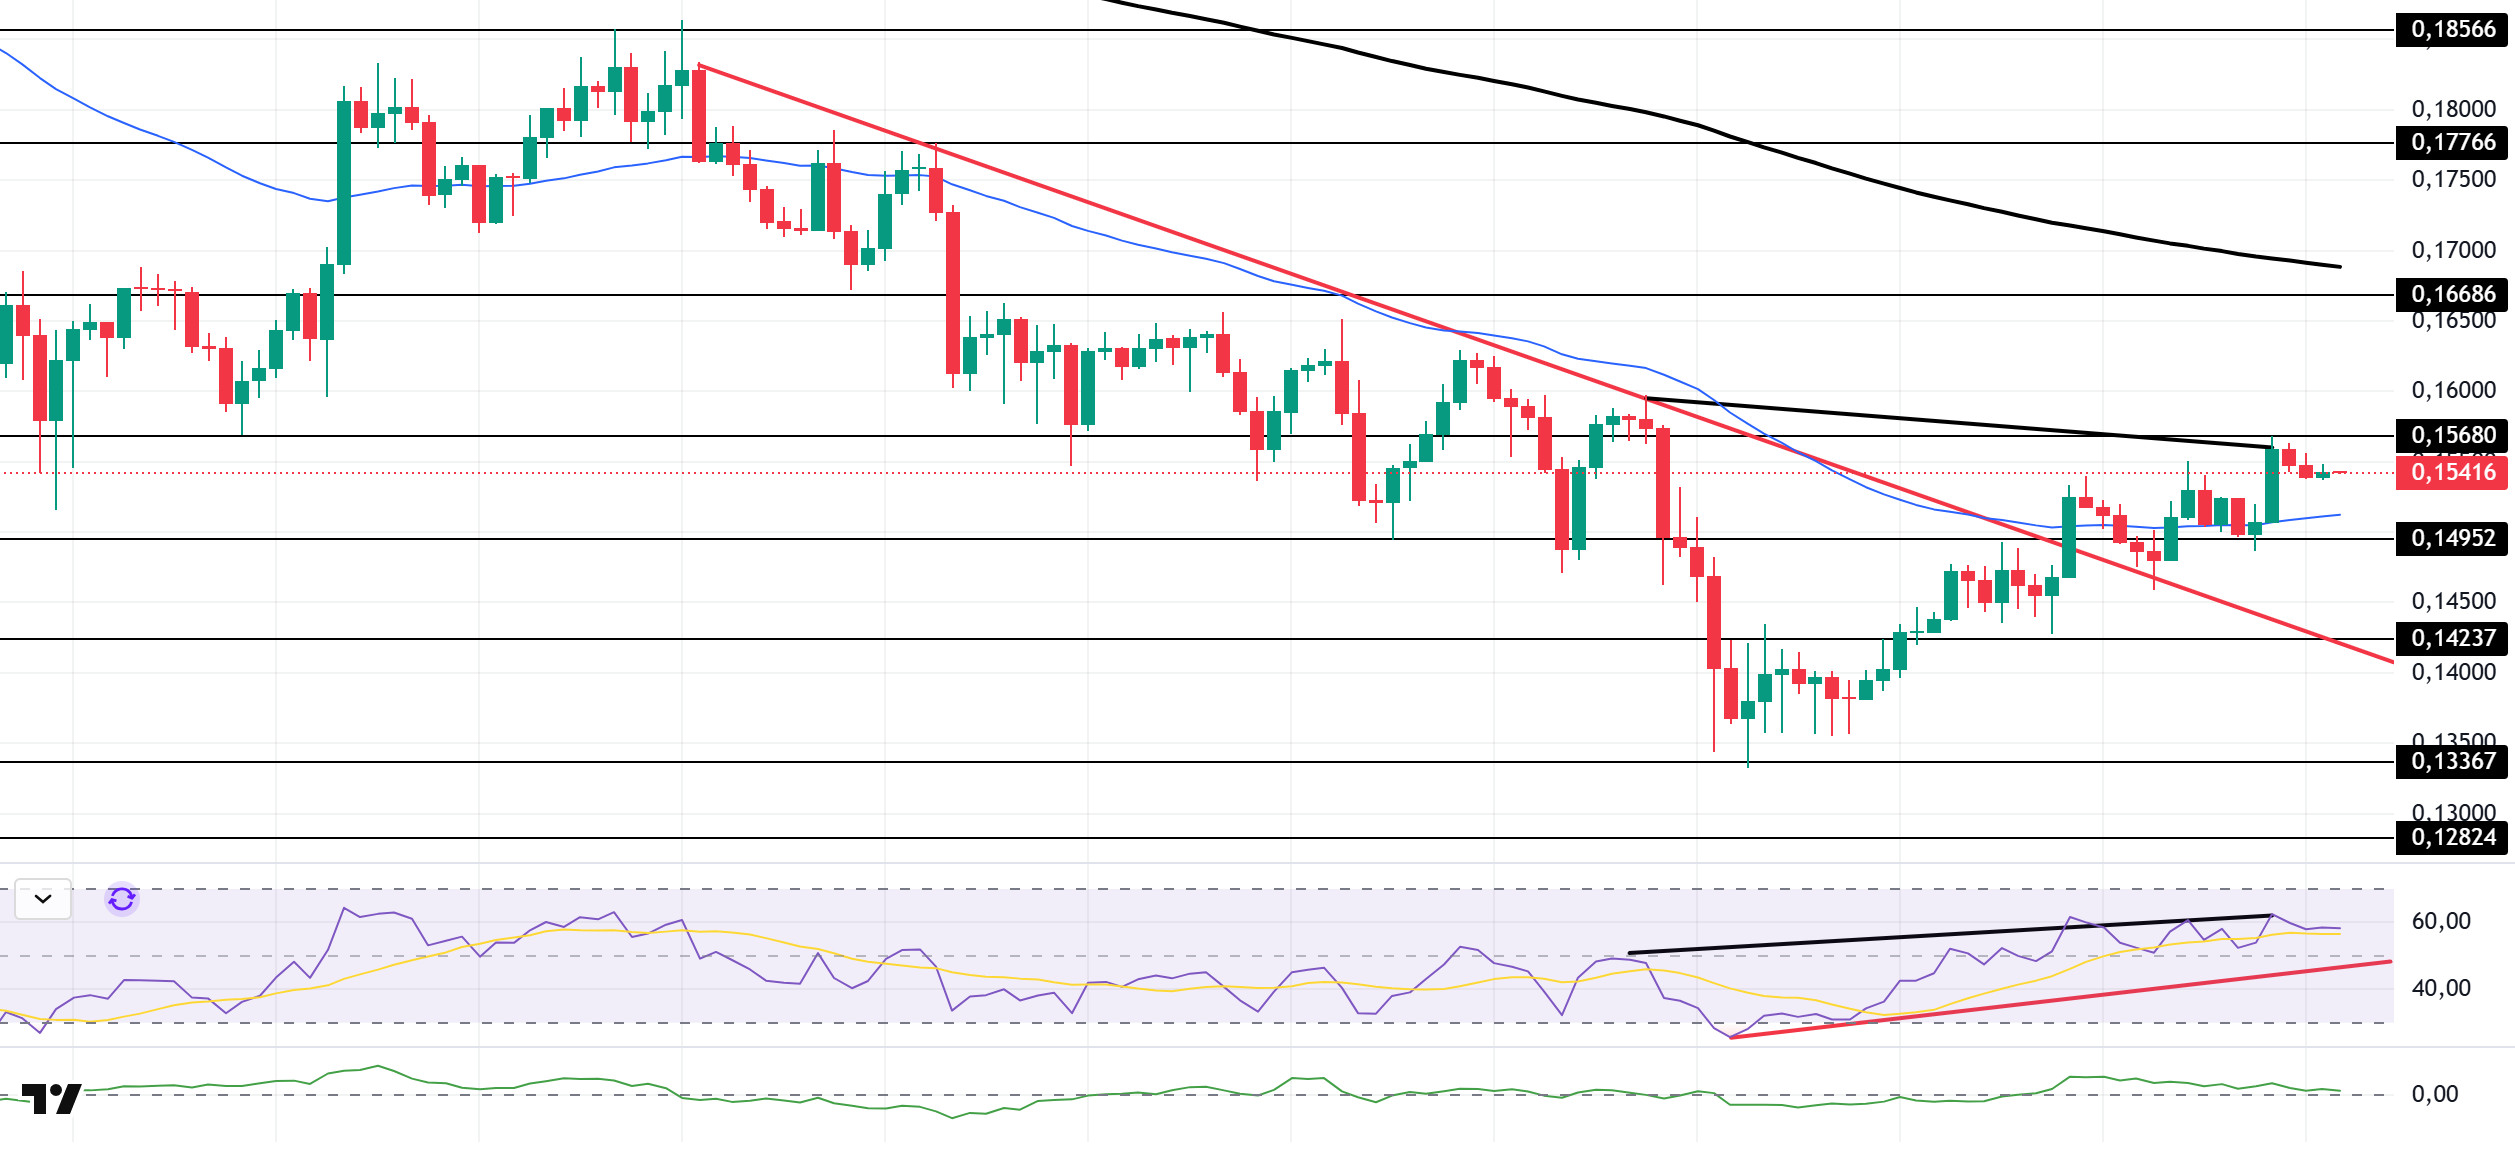
The DOGE price experienced an increase. The asset continued to remain in the upper region of the downward trend that began on November 11. The price, which remained above the $0.14952 level, gained momentum with support from the 50 EMA (Blue Line) moving average and experienced an increase. As of now, it tested the strong resistance level of $0.15680 and experienced a slight pullback. If it closes above this level, it may test the 200 EMA (Black Line) moving average. If it experiences a pullback, it may test the 50 EMA (Blue Line) moving average as support.
On the 4-hour chart, the 50 EMA (Exponential Moving Average – Blue Line) remained below the 200 EMA (Black Line). This indicates that a downtrend may begin in the medium term. The price being between the two moving averages indicates that the price is in a decision phase in the short term. The Chaikin Money Flow (CMF-20) remained in positive territory. Additionally, a decrease in cash inflows could push the CMF into negative territory. The Relative Strength Index (RSI-14) remained in positive territory. It also continued to trade above the rising line that began on November 21. This increased buying pressure. However, negative divergence should be monitored. In the event of an uptrend driven by political developments, macroeconomic data, or positive news flow in the DOGE ecosystem, the $0.16686 level stands out as a strong resistance zone. Conversely, in the event of negative news flow, the $0.14237 level could be triggered. A decline to these levels could increase momentum and initiate a new wave of growth.
Supports: 0.14952 – 0.14237 – 0.13367
Resistances: 0.15680 – 0.16686 – 0.17766
SHIB/USDT
The new Shiba-themed mini-app project, developed in collaboration with TokenPlay AI within the Shiba Inu ecosystem, has become one of the standout products on the project roadmap. Built around gamified tasks and a token-based reward system, this structure is designed as a model that aims to create a recurring participation cycle that keeps community members engaged within the ecosystem. On the project side, this step is seen as a strategic move that will make the Shiba Inu brand more visible in the Web3 and AI-powered gaming space. Lead developer Shytoshi Kusama stated that the mini-app symbolizes a new phase for the ecosystem in terms of AI integration and community interaction. TokenPlay AI’s projects on the Neiro Tron and Solana networks are additional references demonstrating the platform’s field experience in working with game-focused and highly interactive communities.
This collaboration also serves as a framework supporting Shiba Inu’s goal of going beyond simply expanding its gaming narrative to create real and recurring use cases for SHIB. Thanks to the integration established with Unity Nodes, SHIB has taken on the role of an auxiliary asset used in node management license acquisition and operational processes within the project’s blockchain-based mobile infrastructure network. This creates a meaningful foundation for the potential to add new revenue streams to the project in different verticals such as gaming, telecommunications, and decentralized finance. The team has communicated this move to the public as an important step in its long-term strategy, aligned with the goal of moving Shiba Inu beyond being merely a speculative investment vehicle to a functional and multi-layered digital asset.
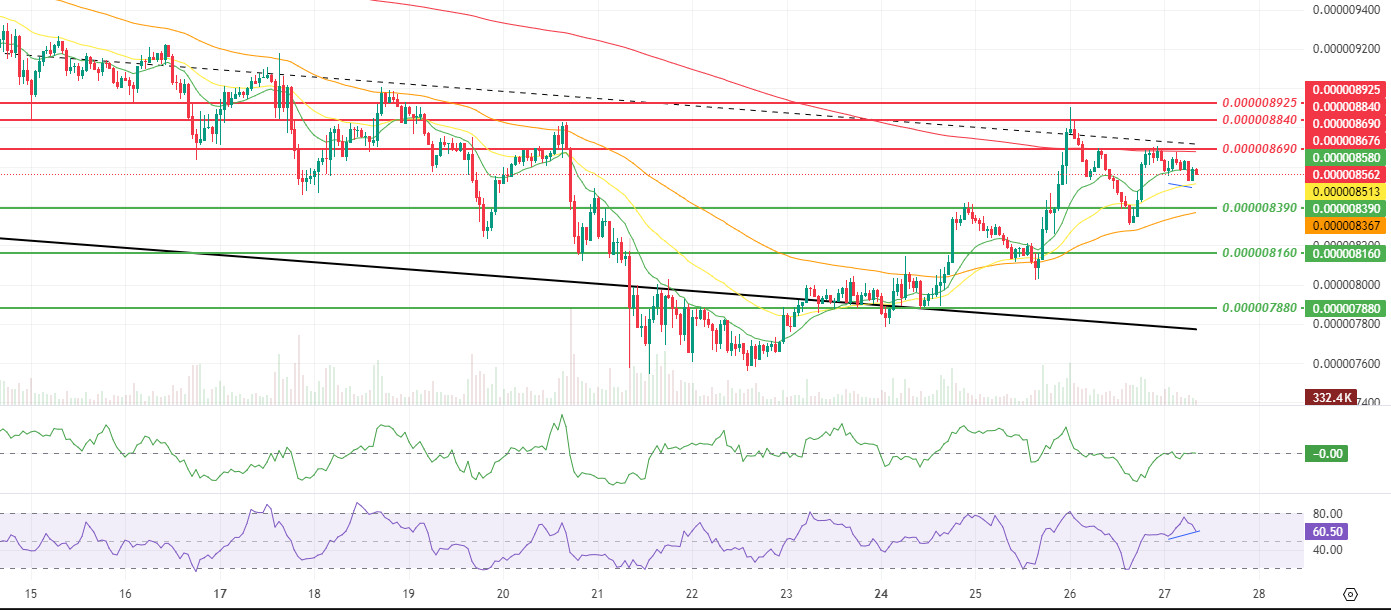
The technical picture shows that, following the dynamic reaction process highlighted in the previous report, price action is currently more balanced but advancing under pressure at the upper band. The recent increase in volume and momentum suggests that buyers have not completely exited the pullback phase and have taken a more assertive position, particularly in the support zone. Conversely, the decline in volatility indicates that the current movement is more of a controlled consolidation and repositioning process than an aggressive trend reversal. The rise of the Chaikin Money Flow (CMF) indicator into neutral territory signals a balancing of capital inflows compared to the previous weakening phase, while the positive divergence (Blue Line) between price and Money Flow Index (MFI) stands out as a complementary signal supporting the possibility of a gradual accumulation in the bottom zone.
The positioning of the Smoothed Moving Average (SMMA) 9 and SMMA 21 periods above the SMMA 50 period indicates that the positive structure in favor of the short-term trend is maintained. The price’s failure to break through the SMMA 200 period and the resistance zone at the $0.000008690 level in its latest attempt reveals that the rebound process continues to struggle at a critical technical barrier. Nevertheless, the fact that the support band passing through $0.000008390 and $0.000008160 is still functioning is an important factor indicating that the bullish defense has not completely collapsed and that the rebound attempt remains valid. In the coming period, if the price breaks the $0.000008690 resistance with a volume-supported move, the $0.000008840 and $0.000008925 levels will be the next technical targets to watch in the short term. Conversely, a sustained close below the $0.000008160 support and a deepening pullback towards the $0.000007880 region would reposition the recent upward attempt around the SMMA 200 as a limited correction area within the medium-term primary downtrend. If the price settles above the SMMA 200 period in the coming period and the Chaikin Money Flow (CMF) indicator shows a structure expanding from the neutral zone to the positive area, the possibility of a more structured and gradual recovery within the falling channel will regain strength.
(SMMA9: Green Line, SMMA21: Yellow Line, SMMA50: Orange Line, SMMA 200: Red Line)
Supports: 0.000008390 – 0.000008160 – 0.000007880
Resistances: 0.000008690 – 0.000008840 – 0.000008925
Legal Notice
The investment information, comments, and recommendations contained herein do not constitute investment advice. Investment advisory services are provided individually by authorized institutions taking into account the risk and return preferences of individuals. The comments and recommendations contained herein are of a general nature. These recommendations may not be suitable for your financial situation and risk and return preferences. Therefore, making an investment decision based solely on the information contained herein may not produce results in line with your expectations.

