Technical Analysis
BTC/USDT
In the US, the Trump administration is accelerating the legal process to remove Fed Chairman Cook, with Rick Rieder emerging as a frontrunner for the Fed chairmanship. President Trump has stated that he expects the Fed to cut interest rates “significantly.” During Trump’s visit to the UK, deals worth billions of dollars are expected to be signed in the technology sector, including artificial intelligence and semiconductors. On-chain data showed that a whale transferred 1,176 BTC to Hyperliquid. The Bitcoin network announced that its daily transaction revenue had fallen below $500,000.
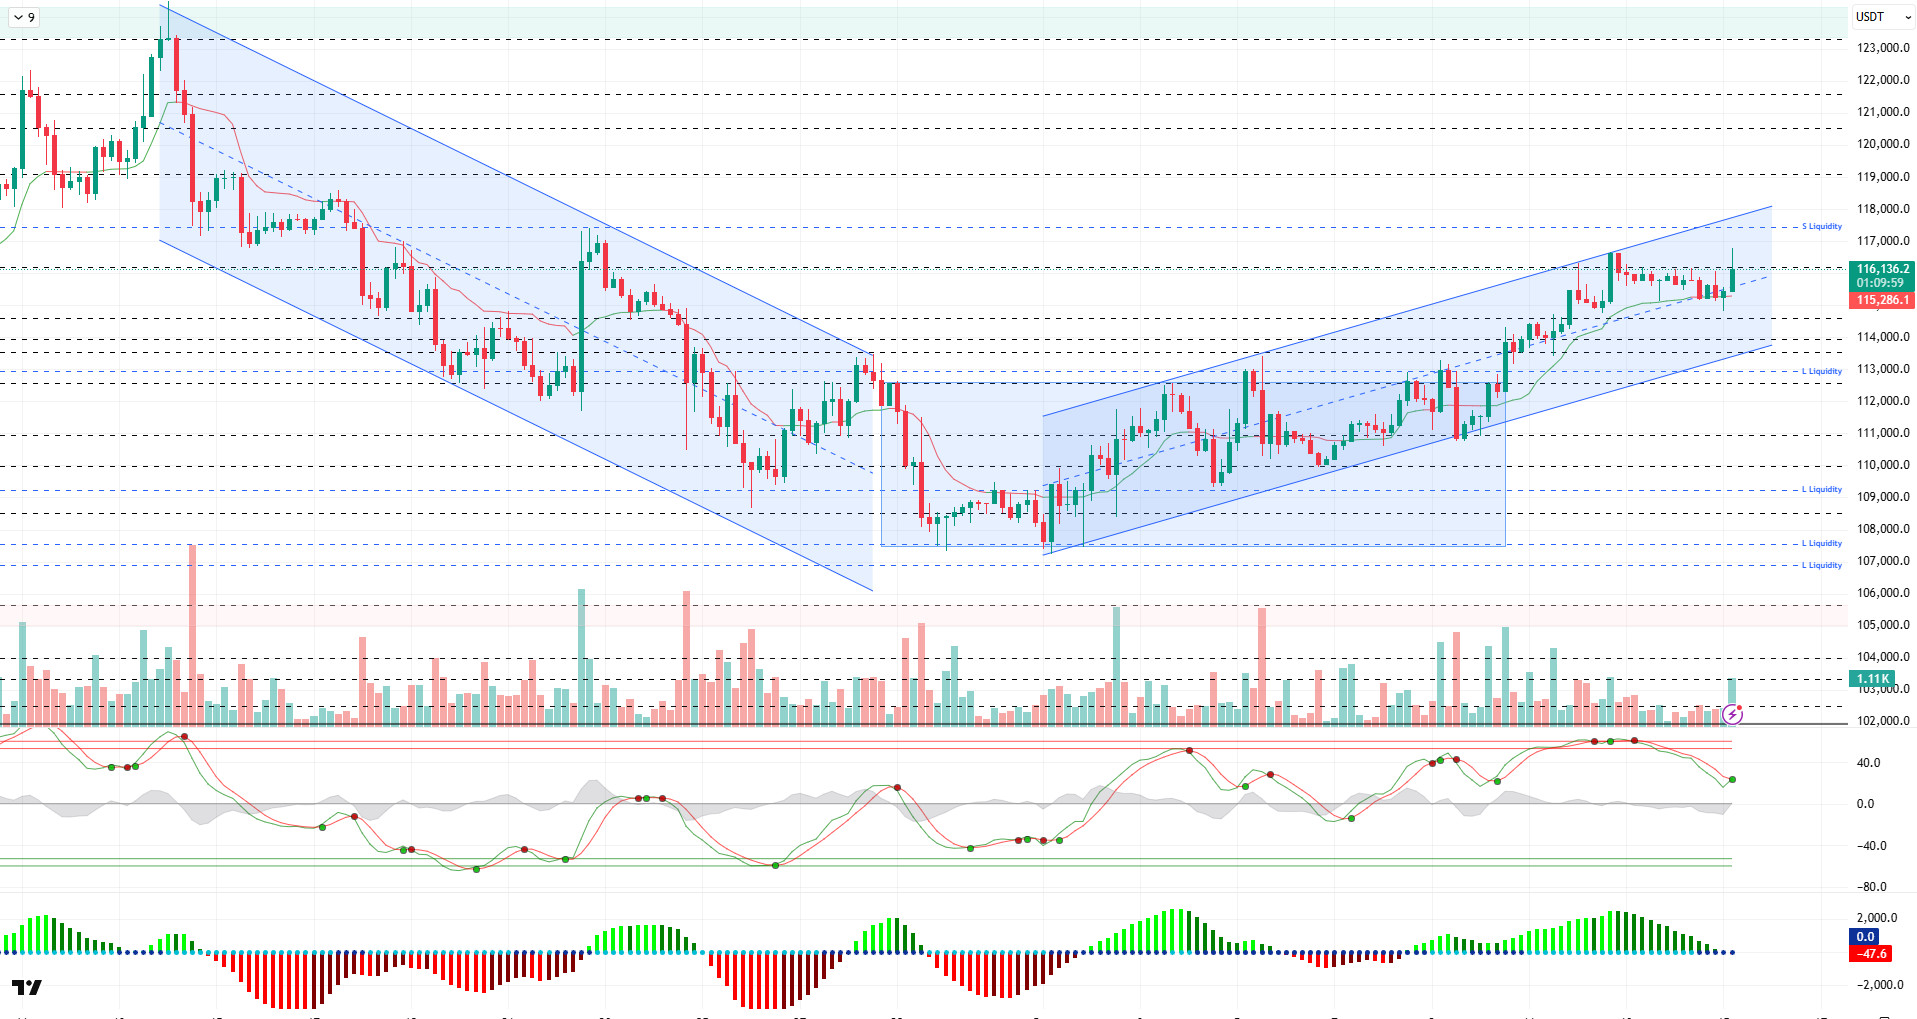
Looking at the technical picture, BTC, which continued its upward trend after the horizontal trend, tested the upper trend line at 116,700. BTC, which showed a slight sell-off over the weekend, fell to 114,800 but recovered again. At the time of writing, it continues to trade at 116,200.
Technical indicators show that after the Wave Trend oscillator (WT) gave a sell signal in the overbought zone, it reversed its direction back up with a buy signal above the channel’s middle band following the trend reversal. The Squeeze Momentum (SM) indicator’s histogram is losing momentum in the positive zone. The Kaufman moving average is currently trading below the price at 115,300.
Looking at liquidity data, we see that short-term heavy selling has accumulated just above the 117,000 level, while the buying level is gaining weight in the short term at 114,000 and in the long term in the 112,500-113,000 band.
In summary, the optimistic mood that had been lost in recent times due to fundamental developments regained strength ahead of the upcoming meeting, as US macro data was released and expectations of an interest rate cut became almost certain. Following the favorable conditions provided by the technical outlook, the price completed its consolidation within the horizontal band it had been in for a long time and tested the 116,700 level along with the minor upward channel. An examination of liquidity data reveals that sell positions have been liquidated, while buy transactions have gained weight, confirming the upward trend. In the coming period, it will be critical for the price to maintain the upward channel it has formed in order for the rise to be sustainable. Closings above the 115,000 level will be monitored as an important reference point for the continuation of the upward trend. In the event of potential selling pressure, the 113,500 – 113,000 band will be tracked as the first support and liquidity zone.
Supports 115,000 – 114,000 – 113,500
Resistances 116,100 – 117,400 – 119,000
ETH/USDT
After rising to $4,769 over the weekend, the ETH price retreated to $4,580 on Sunday due to selling pressure in this region. However, following the weekly close, buyers re-entered the market, pushing the price above $4,650 and maintaining its upward momentum.
The Relative Strength Index (RSI) indicator is painting a picture that supports price movements. The RSI, which rose to the overbought zone last week, then fell back to the 50 level during the subsequent correction. The RSI, which rose again from this level with rebound buying, indicates that the market has regained momentum and buyers are starting to gather strength. These signals support the expectation of a short-term rise.
On the liquidity side, the Chaikin Money Flow (CMF) indicator is noteworthy. With the pullback starting at $4,769, the CMF retreated to the zero line. This movement indicates that buyers and sellers have reached equilibrium and that there has been a brief pause in market liquidity. However, a sustained recovery above the zero line could confirm that capital inflows into the market have resumed.
Looking at the Ichimoku indicator, the price moving above the kumo cloud shows that the trend is still strong. Furthermore, remaining above the Tenkan and Kijun levels indicates that buyers are in control of the market. This structure allows the price to maintain its positive outlook despite corrections.
In the short-term technical outlook, the Tenkan line at the $4,635 level stands out as a critical threshold. If the price manages to hold above this level, upward attempts are expected to continue. In the event of a potential downward break, the $4,551 level could act as a strong short-term support point. In the bigger picture, it can be said that ETH is trying to stay above the $4,365 level to gather strength and that the positive trend is still intact.
Top of Form
Below the Form
Support levels: 4,551 – 4,308 – 4,196
Resistance levels: 4,769 – 4,857 – 5,000

XRP/USDT
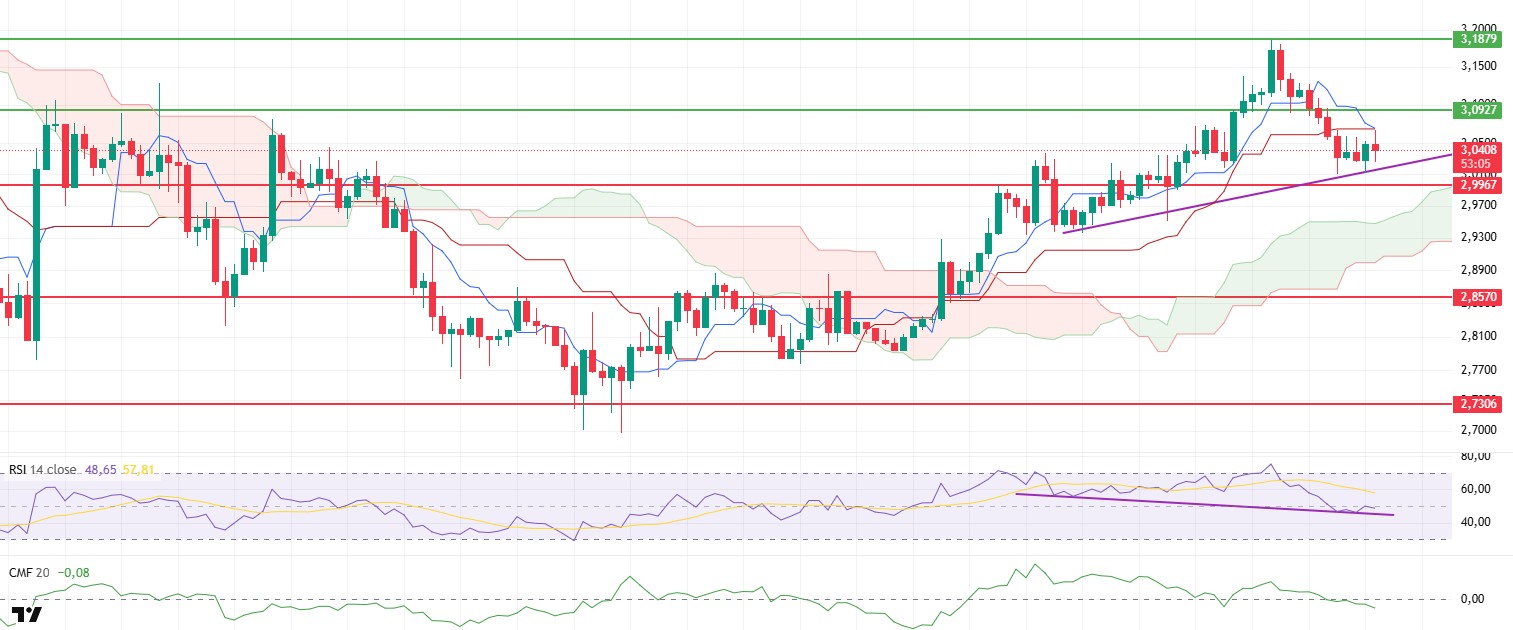
The XRP price maintained its upward momentum on Friday, rising to the $3.18 resistance level after breaking through the $3.08 mark. However, selling pressure from this region triggered a sharp pullback, and the price retreated to the key support level at $2.99. In the current outlook, the price is attempting to hold this critical zone, and the importance of this level is increasing in terms of the market’s short-term direction.
When examining technical indicators, it is observed that the price has lost the Tenkan and Kijun levels in the Ichimoku indicator. Furthermore, the Tenkan level cutting below the Kijun level clearly demonstrates the strength of the short-term negative trend forming in the market. However, the price still moving above the kumo cloud confirms that the main trend remains positive and that buyers maintain their long-term advantage. This outlook indicates that the main direction has not yet been broken, despite short-term weaknesses.
The Relative Strength Index (RSI) indicator also provides important signals supporting price movements. The RSI, which rose to the overbought zone with the recent uptrend, fell back below the 50 level with selling pressure, indicating a weakening momentum. However, the positive divergence in the indicator is noteworthy. This divergence signals that the price may attempt to move upward again, drawing strength from the current support level.
On the liquidity side, the Chaikin Money Flow (CMF) indicator has fallen into negative territory, indicating capital outflows from the market. This signal suggests that buyers may continue to struggle on the liquidity side for a while, but if supported by the positive divergence in the RSI, the price could react upward despite the liquidity loss.
The $2.99 level stands out as a critical threshold in the overall outlook. If this support holds, the price is likely to attempt a recovery towards the $3.09 level during the day, accompanied by positive divergence in the RSI. However, a break below the $2.99 support could trigger heavy selling pressure and cause the price to enter a deeper correction. The short-term direction of the market largely depends on whether this support level holds or not.
Support levels: 2.9967 – 2.8570 – 2.7306
Resistance levels: 3.0927 – 3.1879 – 3.3058
SOL/USDT
Galaxy Digital purchased an additional $78 million worth of Solana tokens.
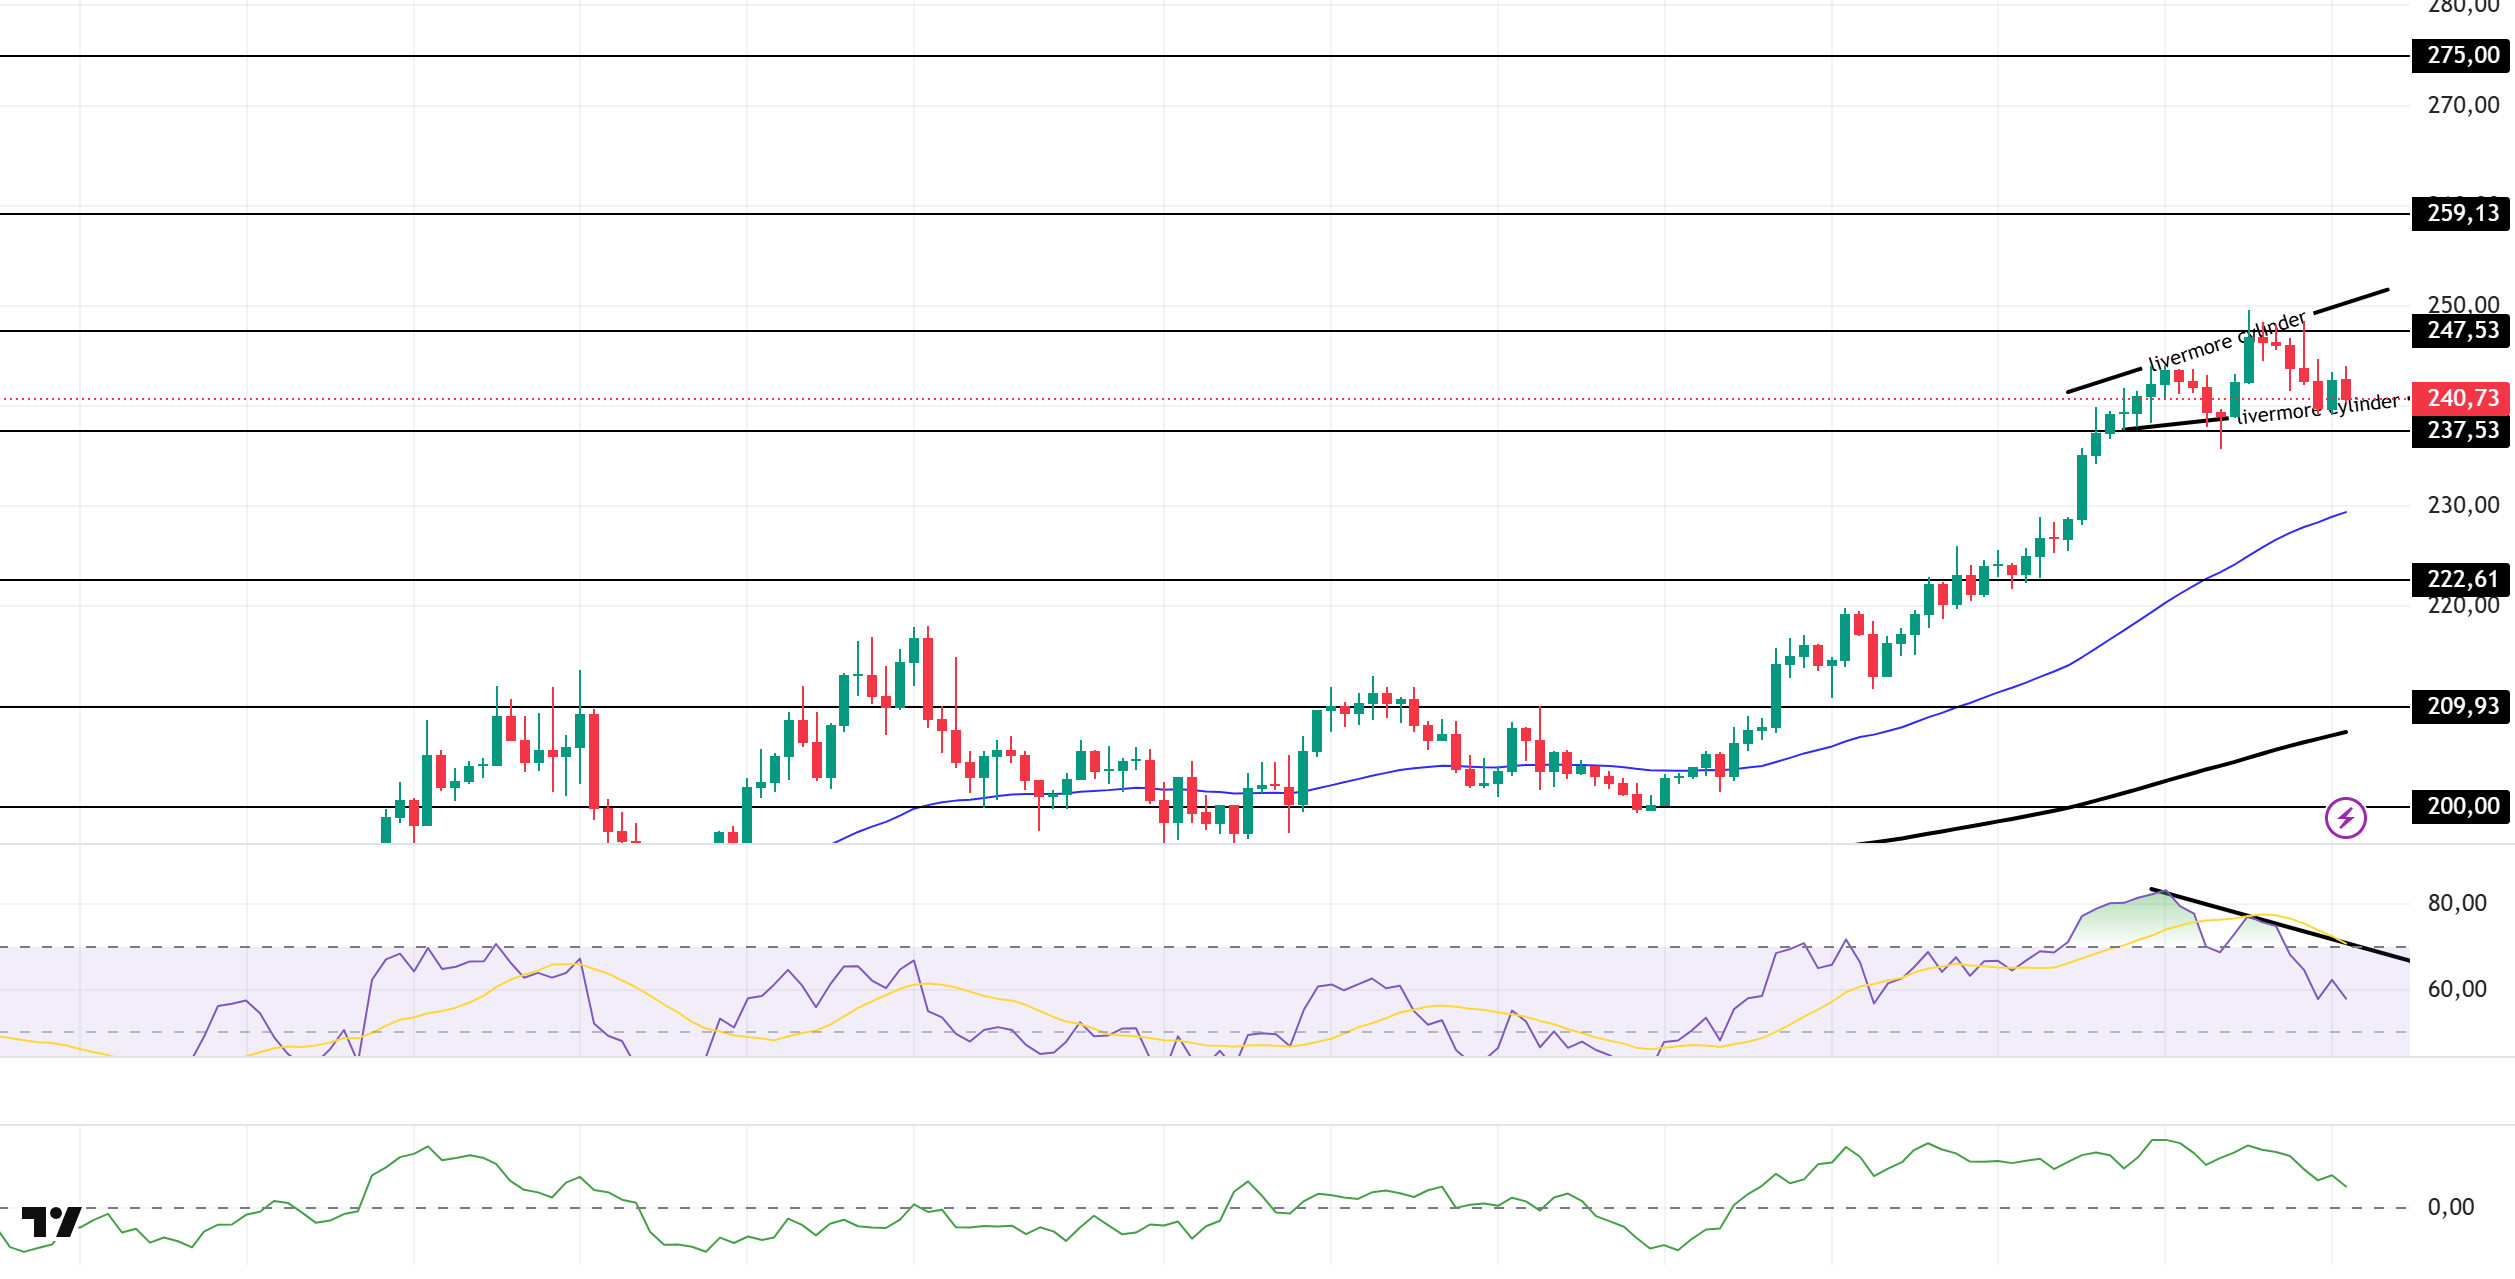
The SOL price is maintaining its horizontal trend. The asset continued to trade within the livermore cylinder pattern formation that began on September 12. The price, which encountered resistance at the $247.53 level, experienced a pullback from there and showed a slight acceleration, supported by the formation’s base level. Currently trading within the pattern, the asset could test the $259.13 level on bullish candle closes above the pattern. In pullbacks, the $237.53 level can be monitored.
On the 4-hour chart, it remained above the 50 EMA (Exponential Moving Average – Blue Line) and 200 EMA (Black Line). This indicates that the medium-term upward trend may continue. At the same time, the price being above both moving averages shows us that the market is trending upward in the short term. The large difference between the two moving averages indicates that the asset may be in a sideways or downward trend. Chaikin Money Flow (CMF-20) remained in positive territory. However, an increase in cash inflows could keep the CMF at the upper levels of the positive zone. The Relative Strength Index (RSI-14) remained in positive territory. However, its position in the lower region of the downward trend that began on September 12 indicated selling pressure. At the same time, negative divergence could cause a pullback. If there is an uptrend due to macroeconomic data or positive news related to the Solana ecosystem, the $259.13 level stands out as a strong resistance point. If this level is broken upwards, the uptrend is expected to continue. If pullbacks occur due to developments in the opposite direction or profit-taking, the $222.61 level could be tested. A decline to these support levels could increase buying momentum, presenting a potential upside opportunity.
Supports: 237.53 – 222.61 – 209.93
Resistances 247.53 – 259.13 – 275.00
DOGE/USDT
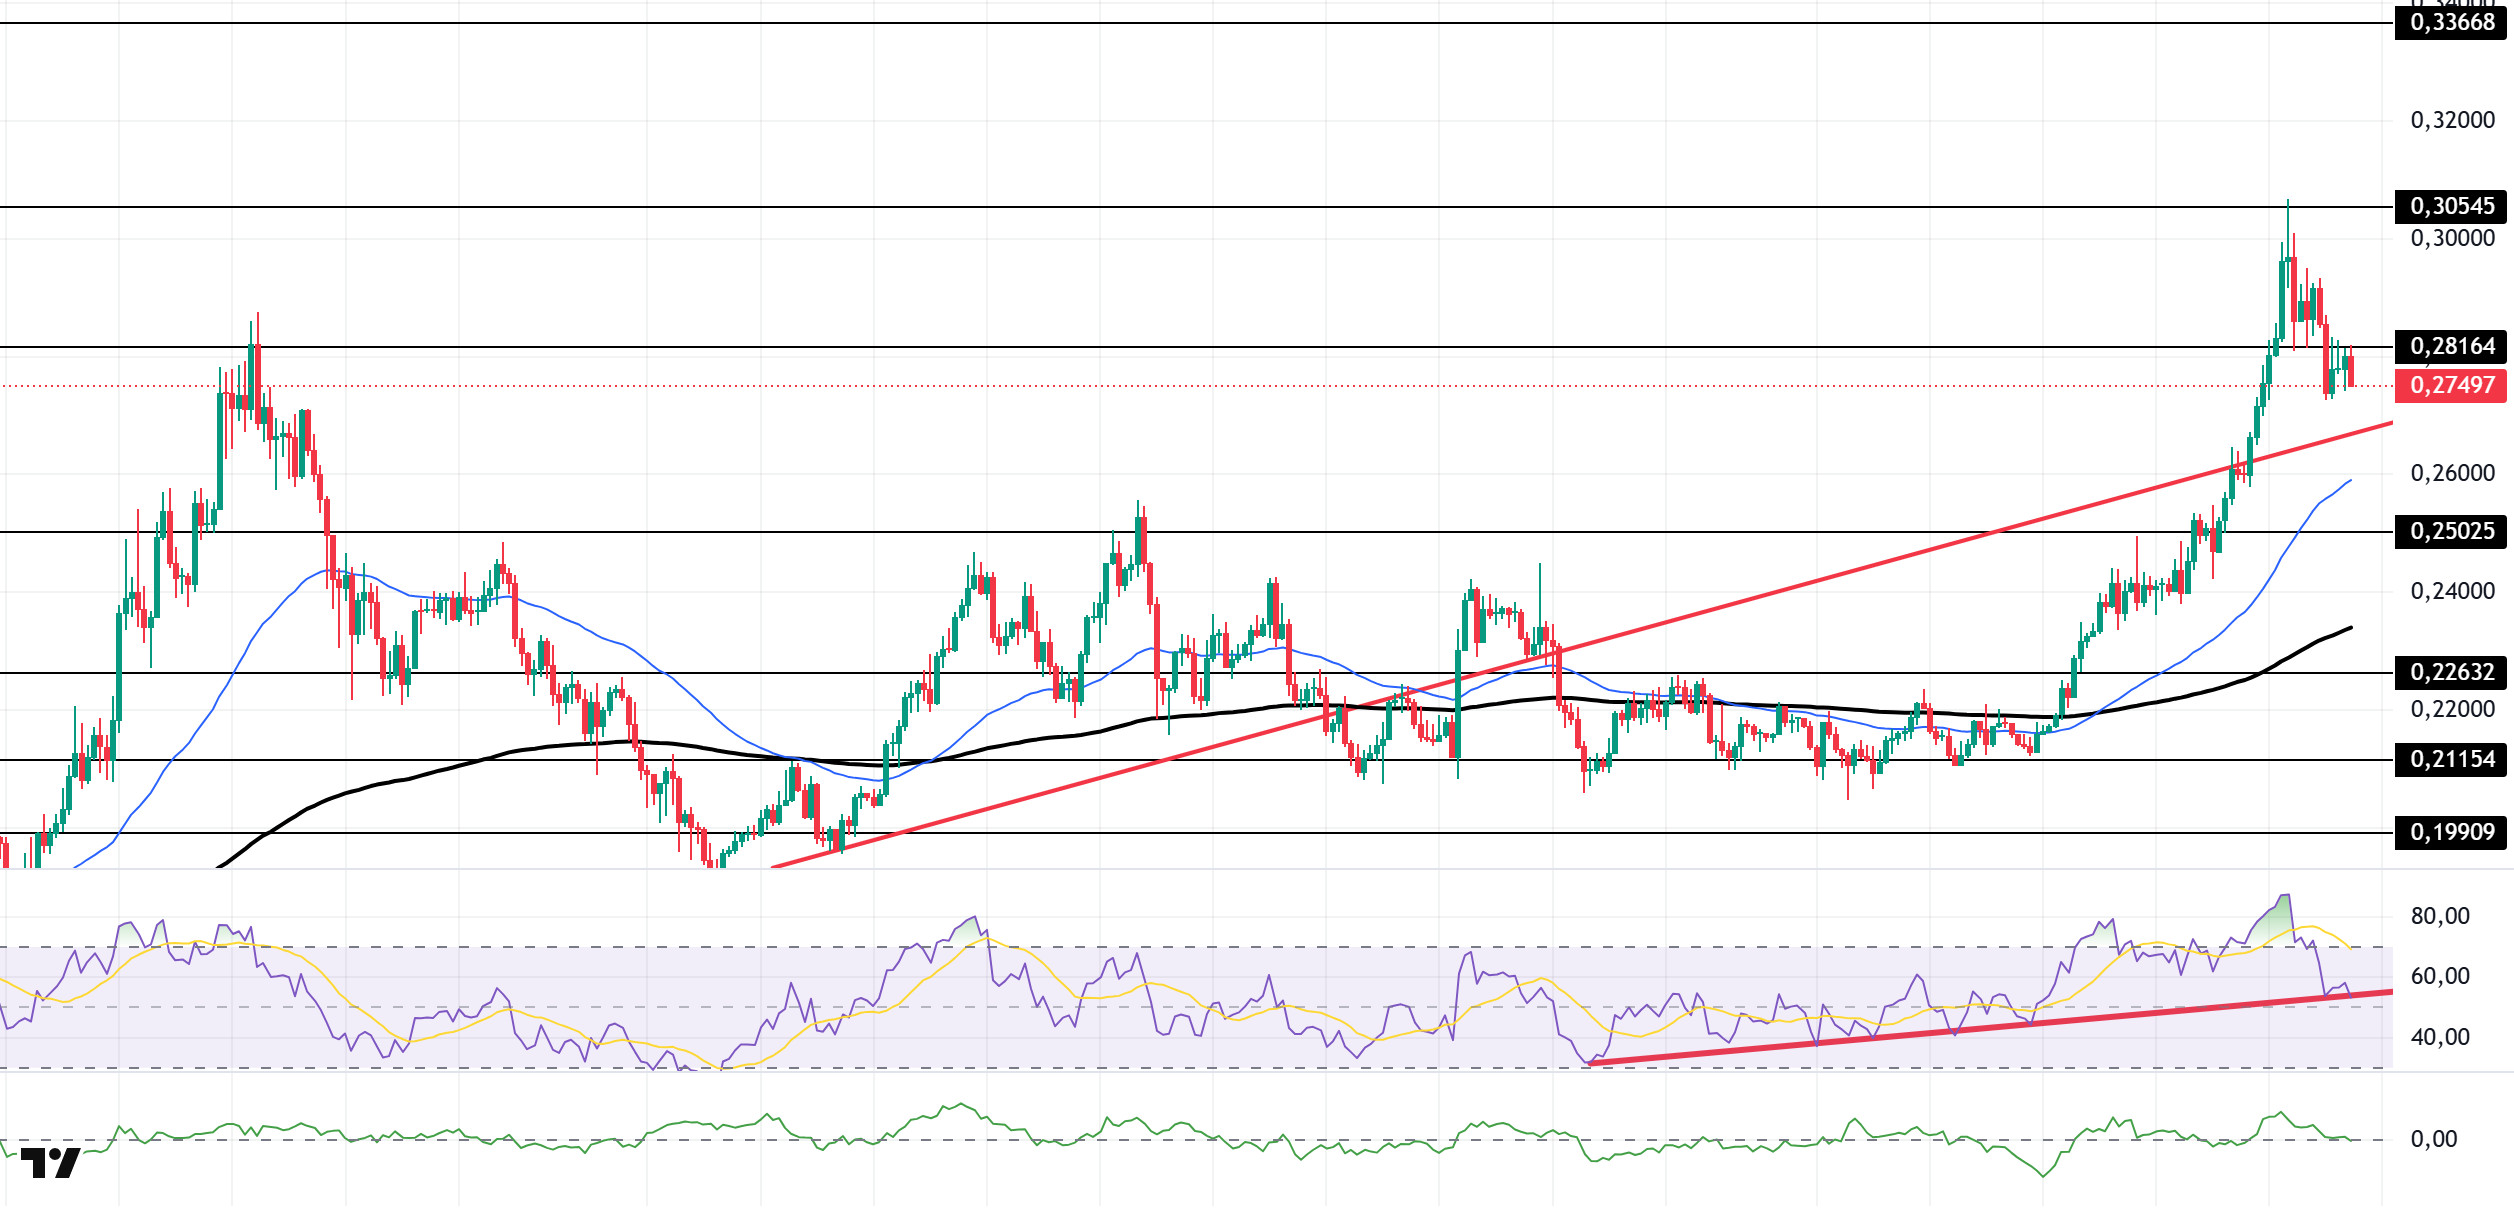
The DOGE price continued its upward trend. The asset tested the resistance level of the upward trend that began on August 3 and managed to break through it, holding above the trend line. The price, which is above the 50 EMA (Exponential Moving Average – Blue Line) and 200 EMA (Black Line) moving averages, tested the strong resistance level of $0.30545 but failed to break through and experienced a pullback. Currently testing the $0.28164 level as resistance, the price may retest the $0.30545 level if it closes above this level. In the event of a potential pullback, the rising trend line could act as support.
On the 4-hour chart, the 50 EMA (Blue Line) remained above the 200 EMA (Black Line). This indicates that the medium-term upward trend continues. The price being above both moving averages shows that the short-term upward trend is strong. A large gap between the two moving averages could cause the asset to pull back or move sideways. The Chaikin Money Flow (CMF-20) also remained at a neutral level. Additionally, a decrease in money inflows could push the CMF into negative territory. The Relative Strength Index (RSI-14) experienced a pullback from the overbought zone. Although it continues to be in the upper region of the rising trend that began on August 26, it is currently testing this level as support. In the event of a rise due to political developments, macroeconomic data, or positive news flow in the DOGE ecosystem, the $0.30545 level stands out as a strong resistance zone. Conversely, in the event of negative news flow, the $0.25025 level could be triggered. A decline to these levels could increase momentum and potentially initiate a new upward wave.
Supports: $0.25025 – $0.22632 – $0.21154
Resistances: 0.28164 – 0.30545 – 0.33668
AVAX/USDT
AVAX, which started last week at $24.69, closed the week at $29.44, marking an approximate 19.3% increase in value. As the upward momentum gained speed, AVAX surpassed the $31 level but then retreated back to the $29 level due to subsequent profit-taking. The strongest daily increase was recorded on September 10, 2025. This movement occurred in parallel with the widespread surge in altcoins seen before the Fed’s interest rate decision. Blockchain Center’s Altseason Index (76/100) rose to its strongest level since December 2024, while capital rotation shifted to high-beta assets. AVAX’s outperformance relative to Bitcoin over the last 90 days has made it one of the leading actors in this trend. AVAX rose above the $31 level, its highest since February 2025, with market expectations pointing to a break above the $40 level if the momentum continues.
On the technical indicators side, the Moving Average Convergence/Divergence (MACD) line crossed below the signal line on the 4-hour chart. While the MACD line continues to trade below the signal line, the 20-period Exponential Moving Average (EMA20) and the $29.32 support zone came to the fore, preventing a decline. AVAX continues to trade above critical Exponential Moving Average (EMA) levels. While this points to a positive outlook, positive momentum has not yet formed on the MACD side. After the decline caused by weakening momentum, it is currently trading within a horizontal band with buying pressure and has not yet found a clear direction.
AVAX started the new day neutral. If AVAX, whose clear direction is still uncertain, resumes its upward trend with positive momentum, it could test the $31.12 resistance level. If it closes above this level, the $32.79 and then $34.56 resistance levels could come into play. On the contrary, if momentum continues to weaken and selling pressure increases, causing AVAX to decline, the EMA20 and $29.32 support levels come to the fore first. If these levels are broken, AVAX could retreat to the $28.28 and $27.34 support levels. If it falls below these levels, the critical $26.02 support level comes to the fore. If it falls below the critical $26.02 level, the downward momentum could increase significantly ( ). The overall outlook for AVAX is neutral on the first day of the new week. AVAX has not yet found its direction. If it regains its upward momentum, there could be potential for a gradual rise towards the $40 level in the short term. However, if momentum weakens significantly, a gradual decline towards the critical $26.02 support level could be seen.
(EMA20: Pink Line, EMA50: Green Line, EMA100: Blue Line, EMA200: Purple Line)
Supports: 29.32 – 28.28 – 27.34
Resistances: 31.12 – 32.79 – 34.56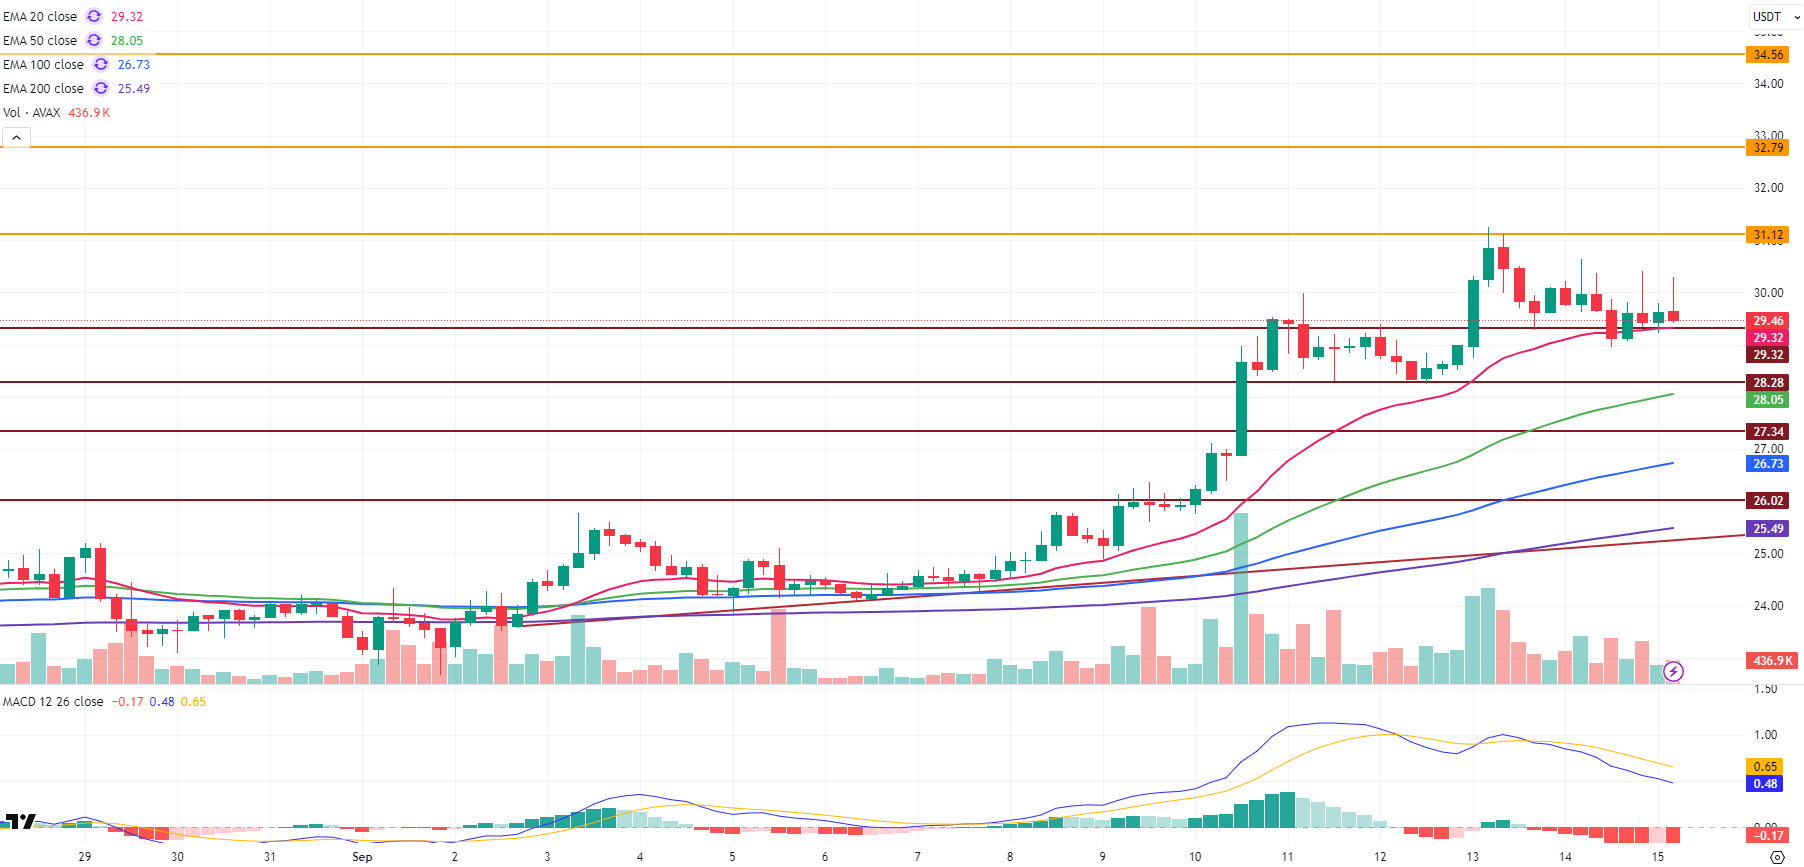
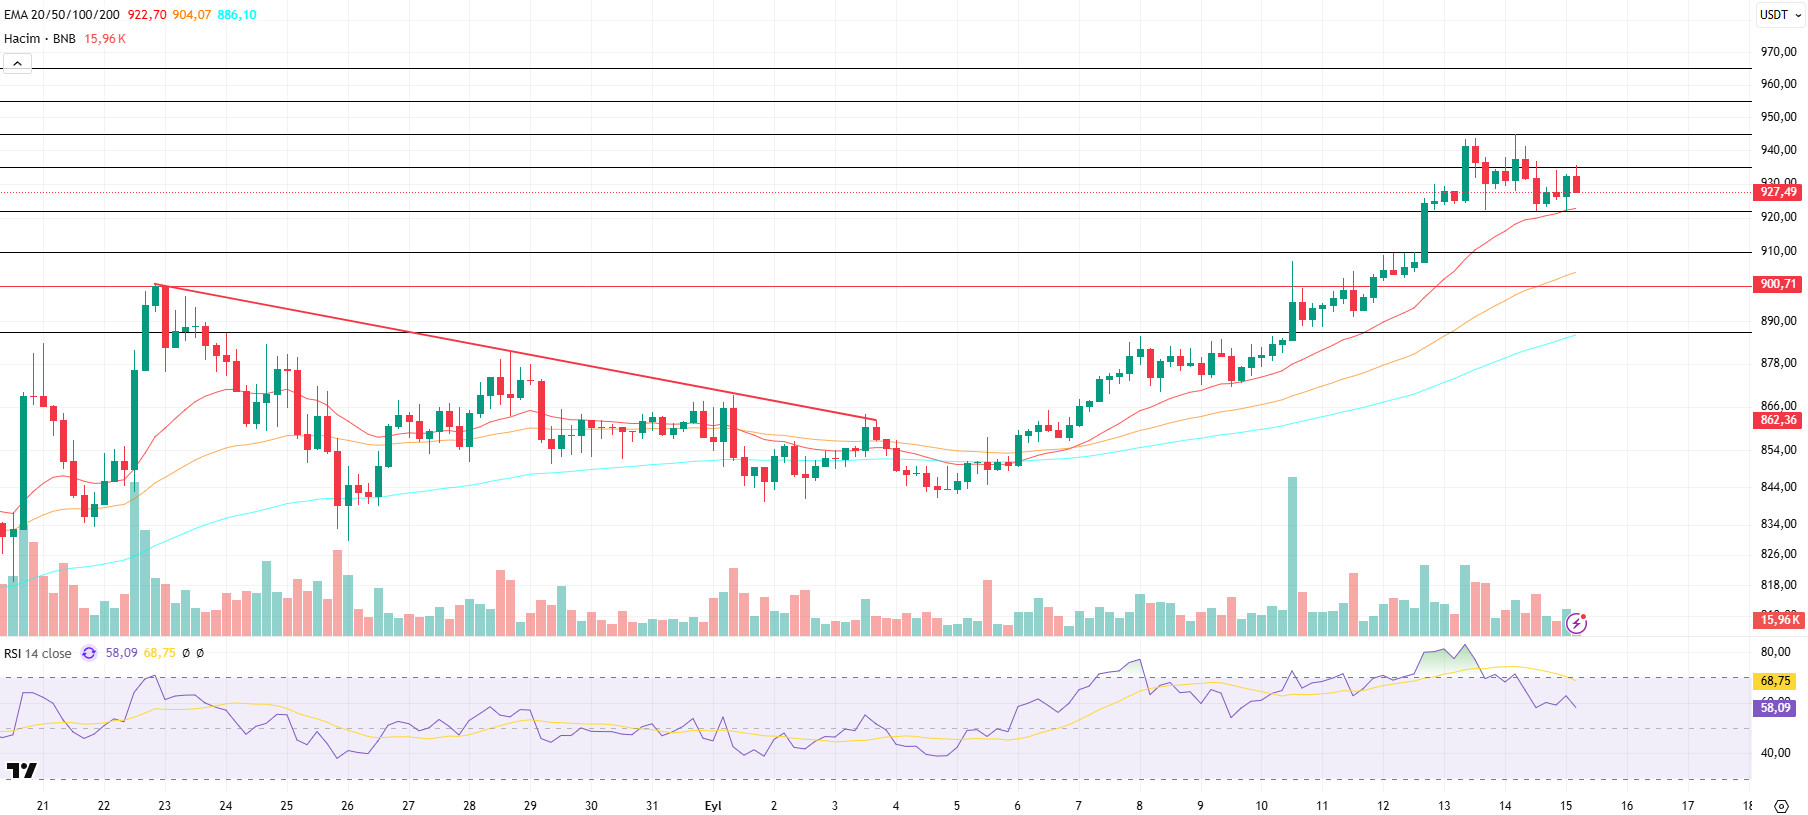
BNB/USDT
From a technical perspective, BNB/USDT, which ended its correction movement starting from the previous peak level of $900 at the $840 level, continued its rise with strong support from this region and recorded new historical highs. In this direction, BNB, which approached the $950 level, experienced a correction down to the $920 level and then started the new day with a positive opening. This rise continued up to the $935 level, after which the price went back into correction with the following candle.
Technical indicators for BNB/USDT, currently trading in the $920–$935 range, suggest that recent changes in trading volume indicate the asset has entered a short-term decision phase.
Additionally, the Relative Strength Index (RSI) has risen above the 70 level with recent increases, but has been suppressed by resistance at this level. In this context, the RSI turning downward indicates that the possibility of a short-term correction persists.
Within the current outlook, if selling pressure increases, the price is likely to retreat back to the $920 support level. If this level is broken downward, the price is expected to move towards the $910 and $900 levels, respectively. On the other hand, if buying appetite is maintained, BNB is expected to test the $935 resistance level first ( ). If this level is breached, the price could potentially move towards the $945 and $955 levels.
Supports: 935 – 945 – 955
Resistances: 920 – 910 – 900
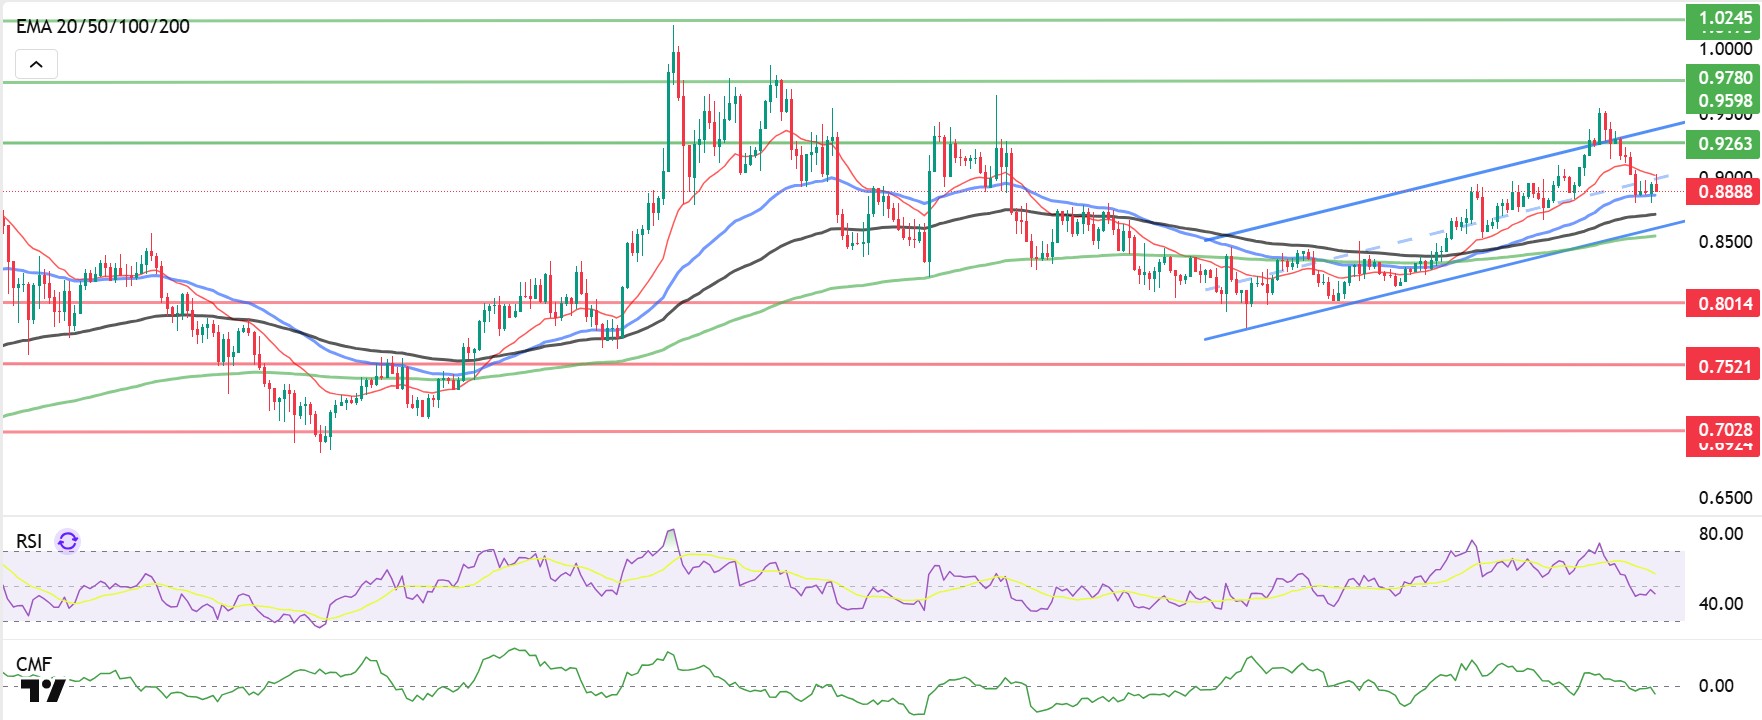
ADA/USDT
Cardano price started the week with strong upward signals and continues its course at 0.8892 levels on the 4-hour chart. The number of open positions on the ADA network increased by 3.7% to $1.92 billion. Whale wallets added 20 million ADA within 24 hours. Derivative data indicates that 72% of investors’ positions are long. This situation increases upward confidence.
In the major range, ADA continues to move within the rising channel band. In this context, the price is expected to reach the $0.9176 level, where approximately $808,000 worth of leveraged long positions are expected to be liquidated. This movement could cause the price to head towards the first resistance level of $0.9176, accompanied by reactionary buying during the day. If this level is exceeded, it appears likely that the price will reach the $0.9280 level, which is the peak of the rising channel within the major trend. The fact that the price is currently trading above all moving averages indicates that the uptrend is strengthening. Remaining above the 20-day exponential moving average (EMA-20, Red Line) and 50-day exponential moving average (EMA-50, Blue Line) levels is critical for the sustainability of the uptrend. The Relative Strength Index (RSI) has fallen to 46, approaching negative territory. On the other hand, the Chaikin Money Flow (CMF-20) indicator has fallen to -0.02, indicating that the selling potential in the market continues strongly. The decline in cash inflows supports the CMF remaining in negative territory and creates a downward correlation with the RSI. Momentum indicators are also producing negative signals. This alignment increases the likelihood of the downward trend continuing.
In terms of fundamental factors, potential statements by US President Donald Trump or possible corporate/strategic purchases within the Cardano ecosystem are among the elements that could support the price moving towards the strong resistance level of $0.9280 . However, in the event of potential selling pressure in the markets, the $0.7851 level should be monitored as a critical support point.
Supports: 0.7851 – 0.7566 – 0.7170
Resistances: 0.9982 – 0.9636 – 0.9280
Legal Notice
The investment information, comments, and recommendations contained herein do not constitute investment advice. Investment advisory services are provided individually by authorized institutions taking into account the risk and return preferences of individuals. The comments and recommendations contained herein are of a general nature. These recommendations may not be suitable for your financial situation and risk and return preferences. Therefore, making an investment decision based solely on the information contained herein may not produce results in line with your expectations.