
Technical Analysis
BTC/USDT
The US Federal Reserve (Fed) kept its policy rate steady at 4.25-4.50% and did not change interest rates for the fifth consecutive meeting. For the first time since 1993, two Fed members voted against the decision. Fed Chair Jerome Powell stated that economic indicators point to moderate growth and that inflation remains elevated. The White House released a 166-page official report on digital assets, recommending that regulatory agencies’ authorities be clarified. No clear information was provided on the government’s Bitcoin reserve strategy. President Trump announced the signing of a trade agreement with South Korea worth $350 billion in investments and $100 billion in LNG purchases. Under the agreement, a 15% tariff will be imposed on South Korea. Today’s data set will include US Jobless Claims and Inflation data.
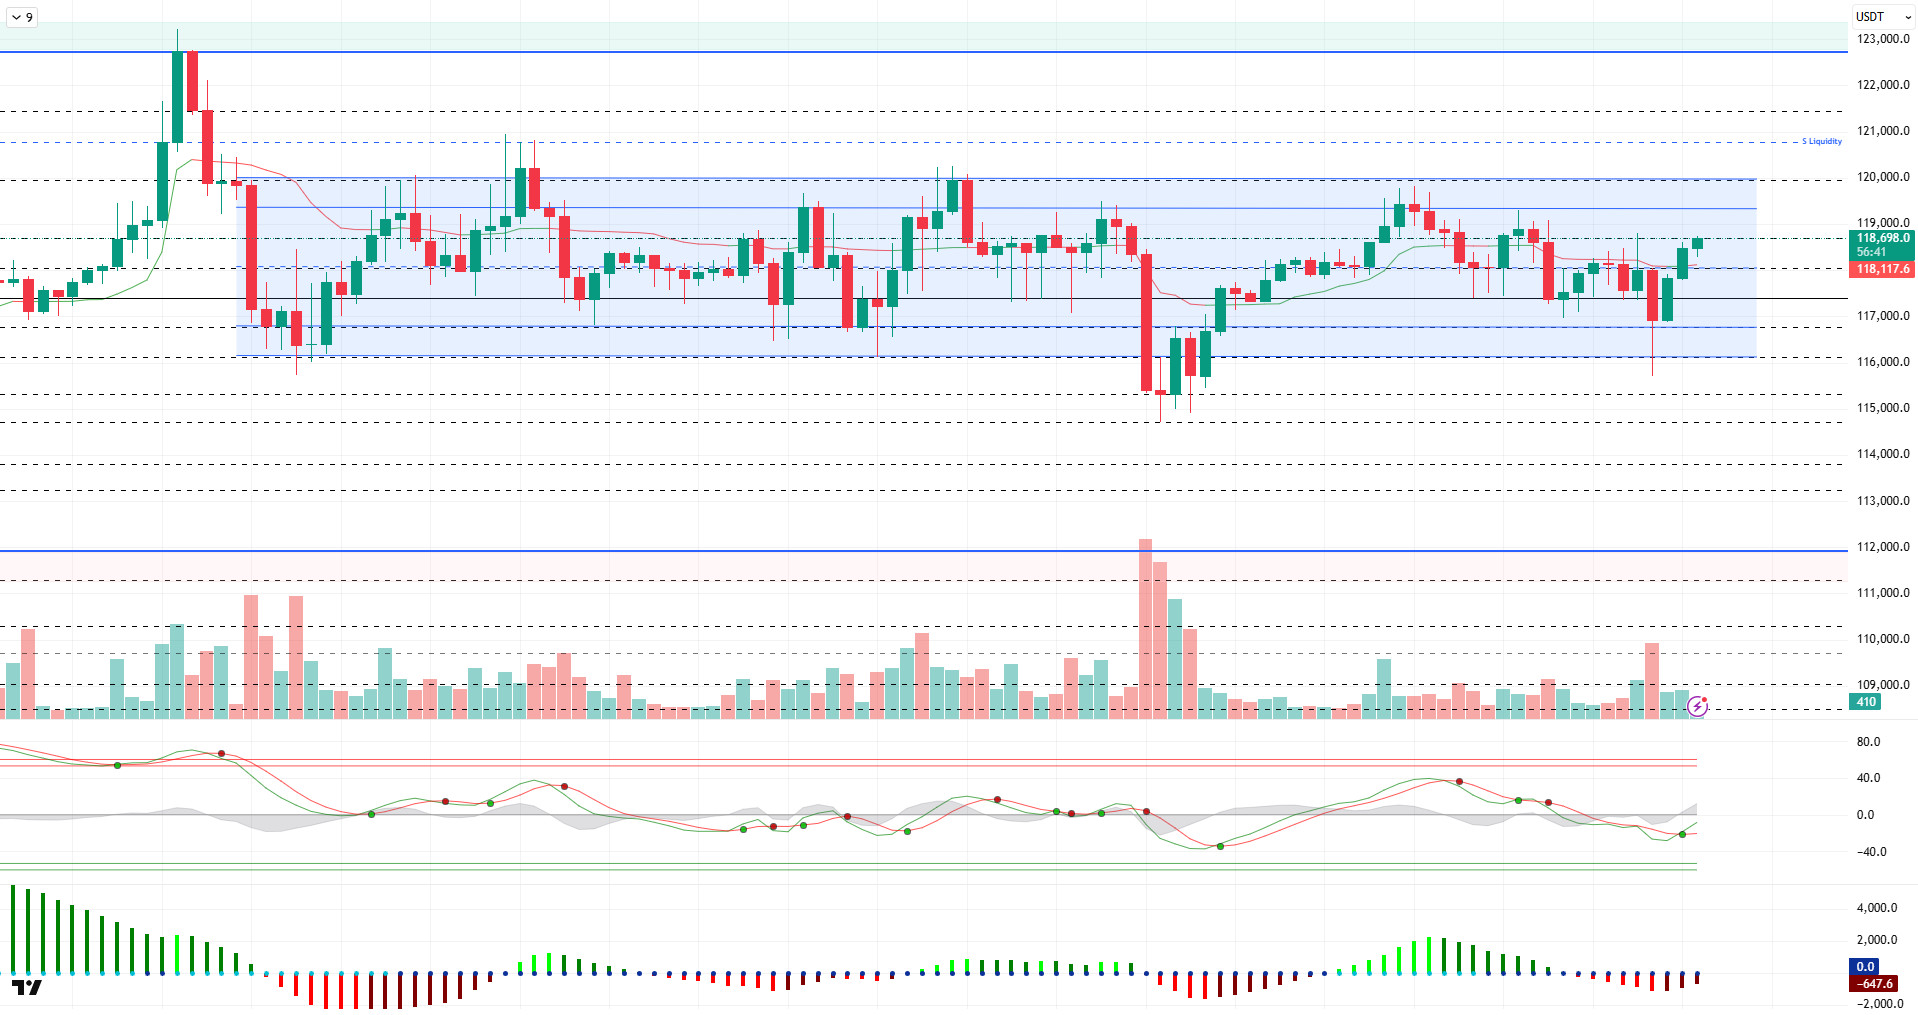
Looking at the technical picture, BTC fell to 115,900 as a result of the developments mentioned above. The price, which did not remain in this region, recorded a rapid recovery and continues to trade at 118,700 at the time of writing.
On the technical indicators front, the Wave Trend (WT) oscillator has been showing an indecisive pattern within the channel’s middle band for an extended period but has once again turned upward, confirming the upward trend. The Squeeze Momentum (SM) indicator is attempting to regain momentum in the negative zone. The Kaufman moving average is currently below the price level at 118,100.
Looking at liquidity data, buy-side transactions that accumulated at 117,000 and 116,300 levels were liquidated. Meanwhile, intense sell-side transactions continued to increase above the 120,000 level, maintaining their accumulation.
In summary, with the fundamental developments, the BTC price continues to remain in a band close to the ATH level, while the consolidation process has been ongoing since July 14. The technical outlook has shifted to the overbought zone after an indecisive period. Liquidity data continues to point to the 120,000 level. If the price acquires liquidity, it is expected to test above the 120,000 level, while the 117,500 support level can be monitored in the event of a potential sell-off. In the event of a breakout and hourly closes below this level, the 115,000 reference zone will continue to emerge.
Support levels: 118,000 – 117,500 – 116,800
Resistance levels: 118,600 – 120,000 – 120,600
ETH/USDT
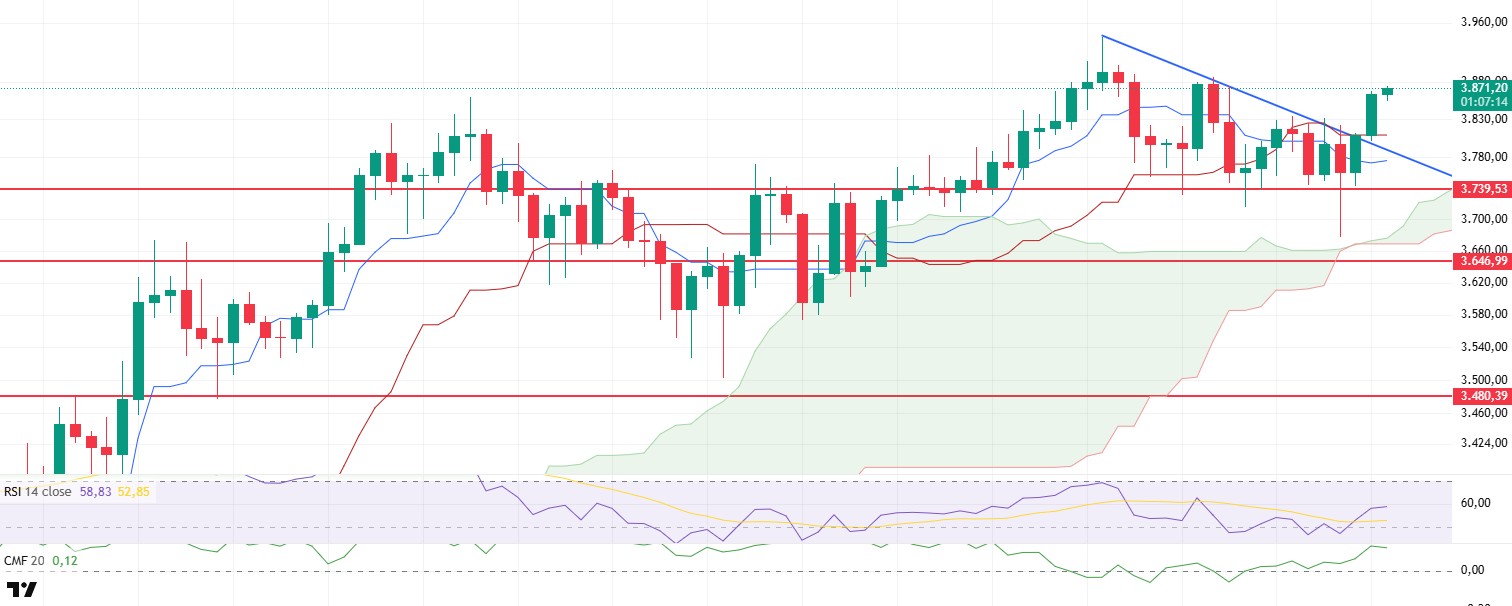
ETH lost value rapidly after breaking below the $3,739 support level amid growing uncertainty in the markets following Fed Chairman Powell’s statements yesterday, falling to the $3,670 level, which is the lower limit of the Ichimoku cloud. At this point, buyers stepped in, triggering a strong rebound, and the price gained upward momentum by the morning, breaking above the blue trend line. Driven by this momentum, the price climbed to the $3,870 level.
When technical indicators are examined, the fact that the price has risen above both the Tenkan and Kijun levels on the Ichimoku indicator indicates that the short-term positive structure has regained strength. However, the fact that the Kijun line is still above the Tenkan line shows that, although the upward trend is gaining stability, the short-term downward risk has not completely disappeared. This structure provides an important signal that, despite an increase in upward momentum in the market, it is necessary to maintain cautious optimism.
On the Relative Strength Index (RSI) side, the indicator has risen above the MA line following the break of the previous downtrend, indicating that momentum has begun to recover. This breakout on the RSI confirms that buying pressure is gaining strength and that the market is returning to an upward trend.
The Chaikin Money Flow (CMF) indicator, on the other hand, has started to move upward after remaining close to zero for a long time. This indicates that liquidity is returning to the market and that the upward movement is not just a technical reaction but is also supported by capital movements. Such structural liquidity inflows form an important foundation for sustaining the upward price movement.
Looking at the overall picture, there is potential for the price to rise towards the $3,900 level, along with the recovery in technical indicators. However, it should be remembered that this region has acted as strong resistance in the past, so caution is advised in the face of possible profit-taking and short-term corrections. A sustained price movement above 3,900 with significant volume is critical for the continuation of the upward trend.
Top of Form
Below the Form
Supports: 3,739 – 3,646 – 3,480
Resistances: 4,084 – 4,381 – 4,857
XRP/USDT
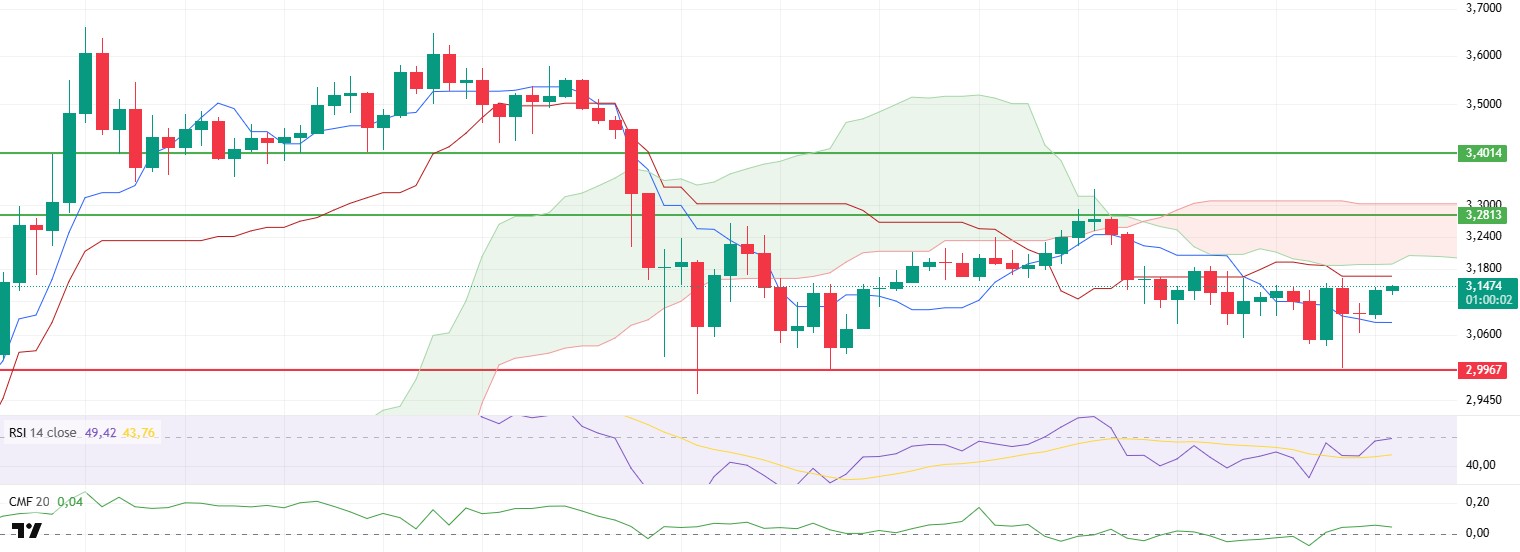
XRP fell to the support level of $2.99 in line with market expectations yesterday evening, testing the strong buying response in this region. Thanks to the intense demand from this level, the price reversed its direction upward and managed to rise above the $3.10 level in a short period of time. This movement revealed that buyers are still active and that this region continues to act as a strong support.
Upon closer examination of technical indicators, it can be seen that the Chaikin Money Flow (CMF) indicator has moved into positive territory, accompanied by a significant influx of liquidity. This structural change in the CMF suggests that the uptrend is not merely a technical correction, but rather a sustained recovery supported by strong capital inflows. The return of liquidity to the market in this manner supports the healthy upward development of the price structure.
A meaningful recovery is also noticeable on the Relative Strength Index (RSI). After breaking above the downward trend line, the RSI rose above the MA level, indicating that the momentum slowdown has slowed and buyers are regaining strength. This breakout can be considered an important technical signal confirming the price’s upward movement in the short term.
In the Ichimoku indicator, the fact that the price is still moving between the Kijun and Tenkan lines indicates an unclear picture in terms of direction. This situation shows that the market is in a state of uncertainty and that any breakouts that may occur in these areas should be closely monitored. Which of these two lines the price breaks through will be decisive for short-term price movements in the coming period.
Overall, XRP’s ability to stay above the $2.99 level has somewhat mitigated short-term downside risks. However, technical indicators suggest that cautious optimism still prevails in the market. For the upward movement to gain momentum, the $3.28 level needs to be broken with strong volume. If this level is broken, a scenario could emerge where the upward movement accelerates and new resistance levels are targeted. On the other hand, if the $2.99 level is broken downward again, the possibility of increased selling pressure and more severe pullbacks should not be overlooked.
Supports: 2.9967 – 2.8471 – 2.6513
Resistances: 3.2813 – 3.4014 – 3.8615
SOL/USDT
21Shares submitted an updated S-1 filing for its spot Solana ETF. Invesco Galaxy filed an application with CBOE for a Solana ETF.
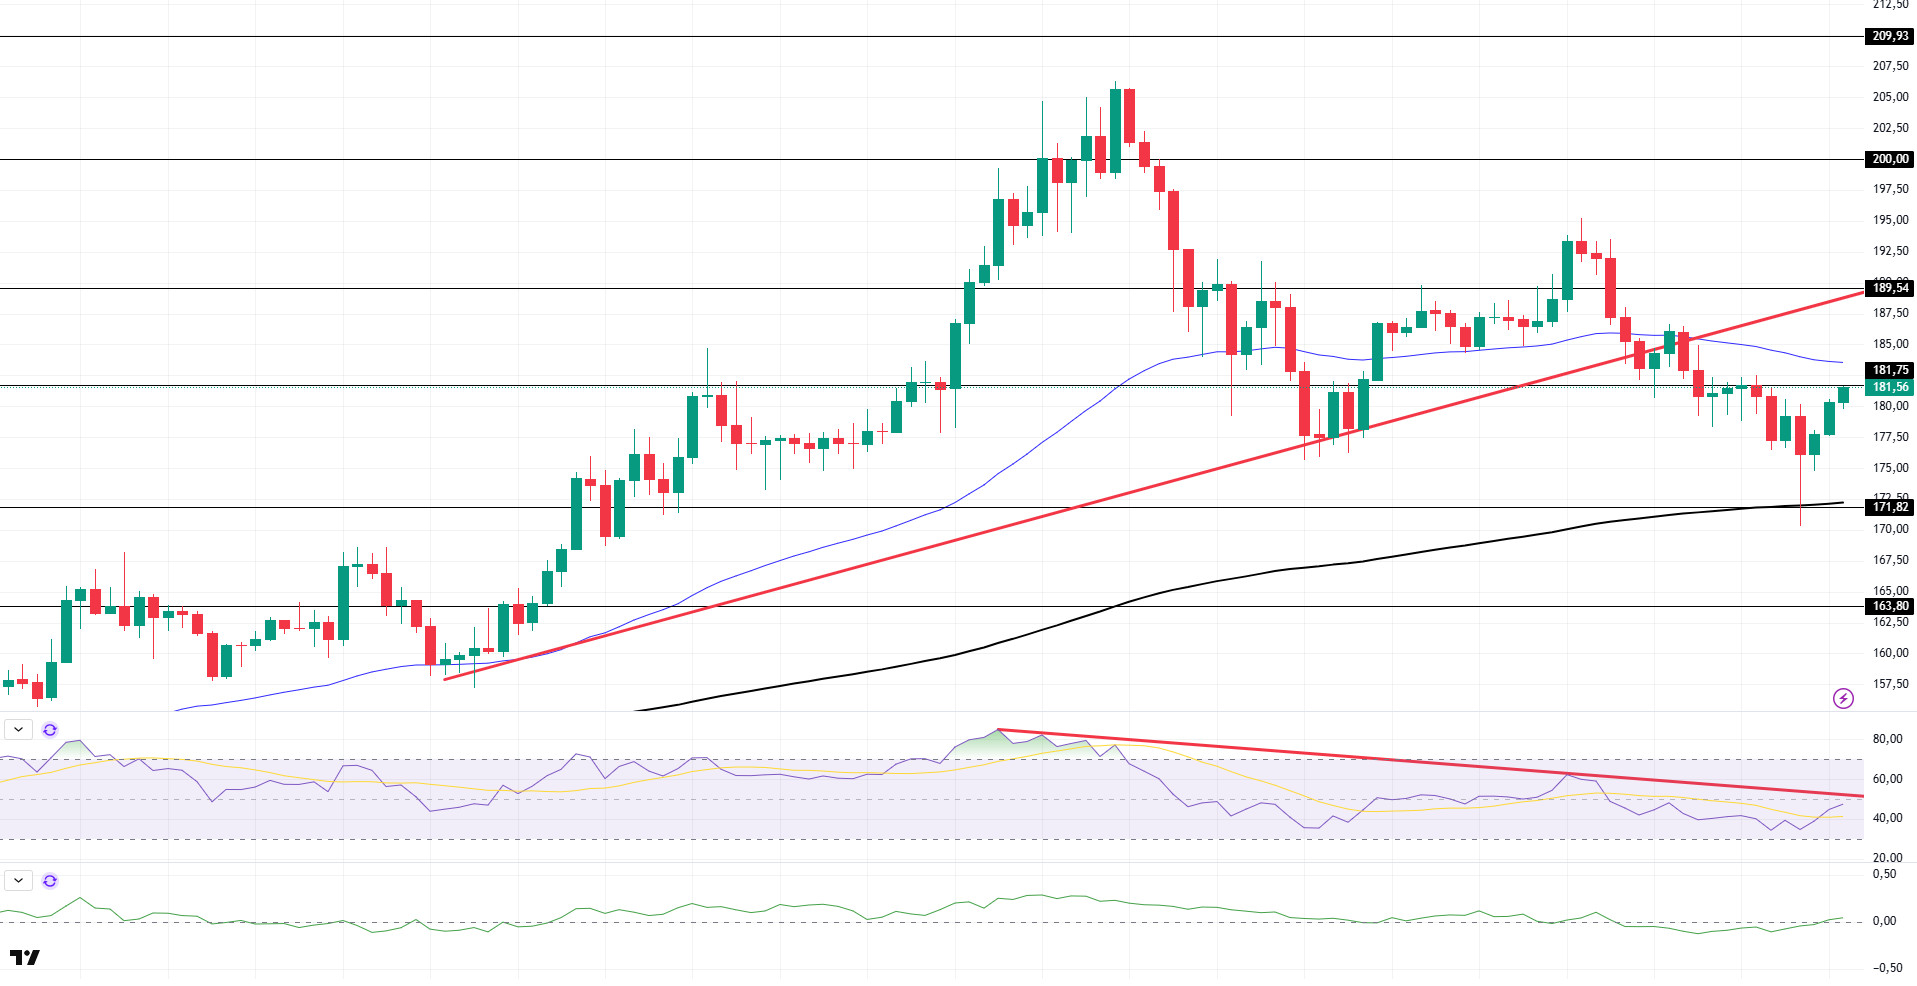
The SOL price gained value. The asset continued to remain below the upward trend that began on July 15. The price tested the strong resistance level of $171.82 and the 200 EMA (Black Line) levels, gained momentum from this point, and showed an upward movement. If the upward trend continues, the $189.54 level could be targeted. If the downward trend persists, the 200 EMA (Black Line) moving average could be monitored.
On the 4-hour chart, the 50 EMA (Blue Line) remains above the 200 EMA (Black Line). This indicates that the upward trend may continue in the medium term. Additionally, the price being between the two moving averages suggests that the market is currently in a decision phase. Chaikin Money Flow (CMF-20) has started to move toward neutral levels. However, an increase in money inflows could push the CMF into positive territory. The Relative Strength Index (RSI-14) continues to remain below the downward trend that began on July 21. In the event of an uptrend driven by macroeconomic data or positive news related to the Solana ecosystem, the $189.54 level emerges as a strong resistance point. If this level is broken upward, the uptrend is expected to continue. In the event of a pullback due to adverse developments or profit-taking, the 171.82 dollar level ( ) could be tested. A decline to these support levels could see an increase in buying momentum, potentially presenting an opportunity for an upward move.
Support levels: 171.82 – 163.80 – 150.67
Resistance Levels: 181.75 – 189.54 – 200.00
DOGE/USDT
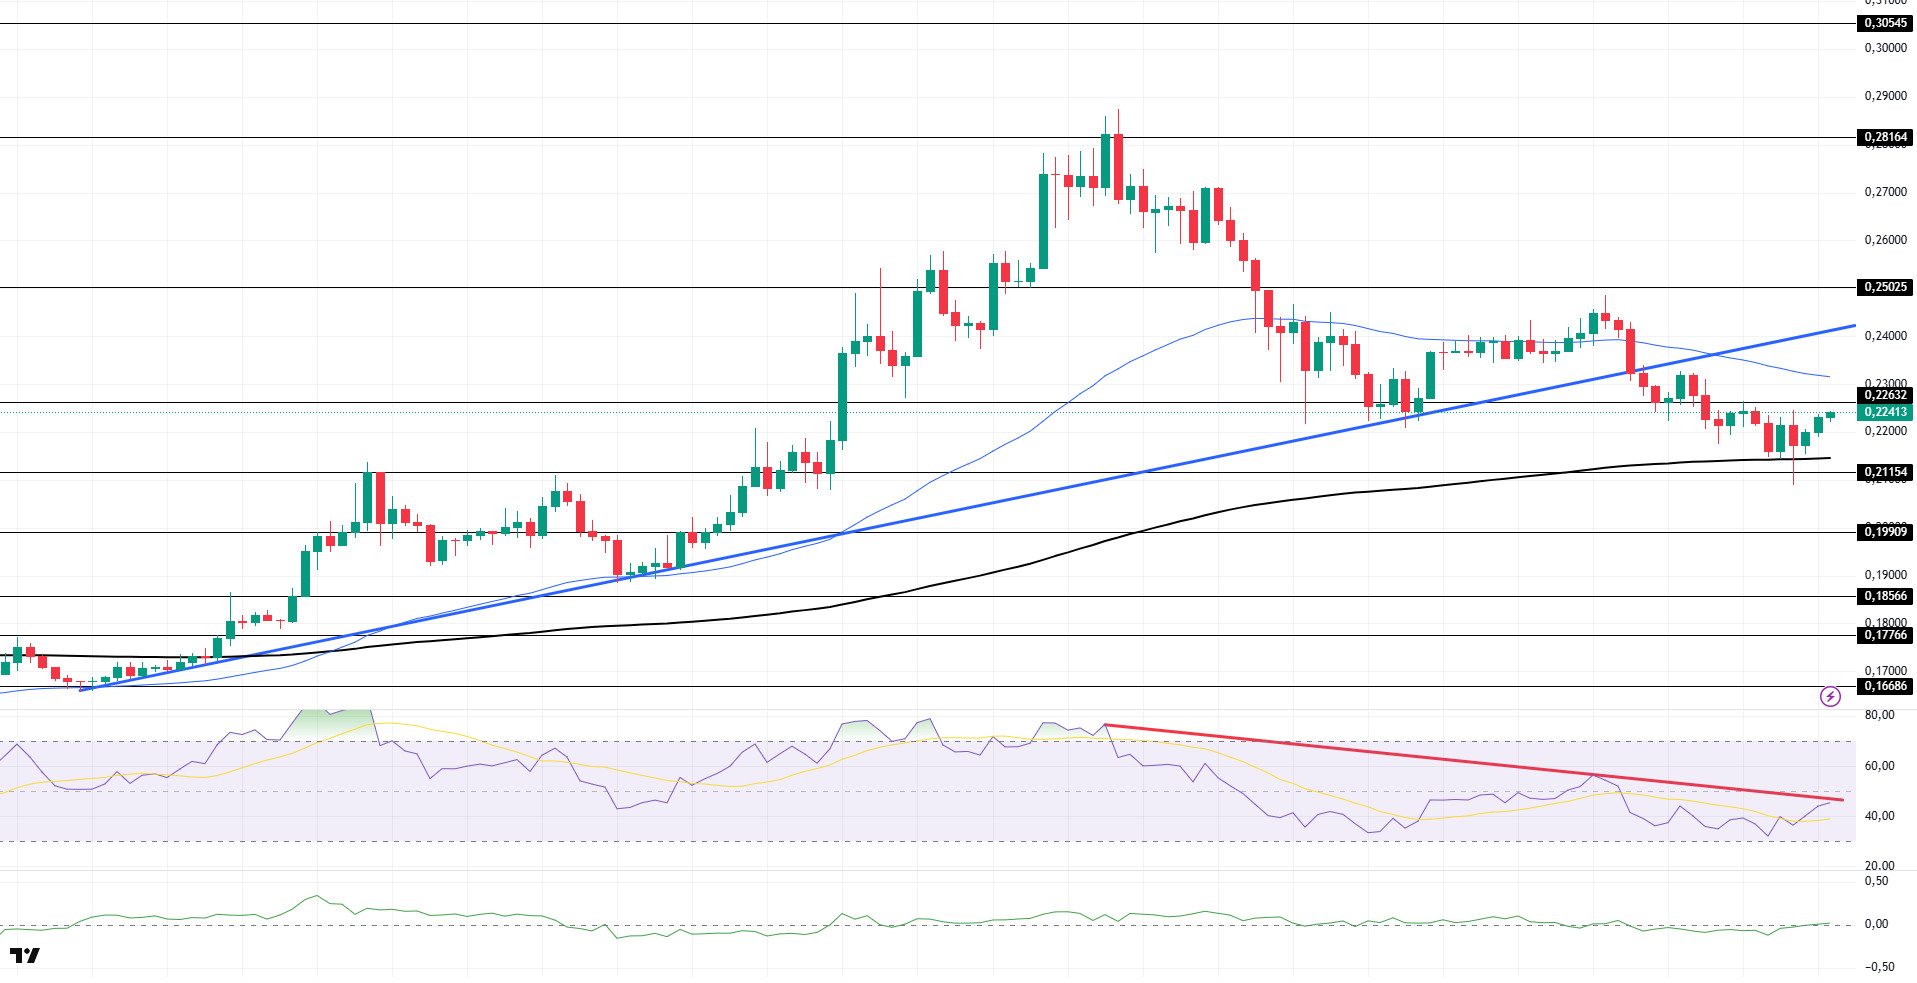
The DOGE price continued its sideways movement. The asset remained below the 50 EMA (Blue Line) moving average, which began on July 7. The price tested the 0.21154 dollar level and the 200 EMA (Black Line) moving average as support but did not break through, instead showing an upward trend. If the pullback continues, the 0.21154 dollar level should be monitored as support. If the upward trend resumes, the 0.22632-dollar level should be monitored.
On the 4-hour chart, the 50 EMA (blue line) remains above the 200 EMA (black line). This indicates that the asset is in an upward trend in the medium term. The price being between the two moving averages indicates that the asset is in a decision phase in the short term. Chaikin Money Flow (CMF-20) remained in negative territory. Additionally, negative cash inflows could push the CMF further into the negative zone. The Relative Strength Index (RSI-14) remains in the negative zone. Furthermore, it remains below the downward trend that began on July 21. This could continue the downward movement. In the event of upward movements driven by political developments, macroeconomic data, or positive news flow within the DOGE ecosystem, the $0.25025 level emerges as a strong resistance zone. In the opposite scenario or in the event of negative news flow, the 0.19909-dollar level could be triggered. A decline to these levels could increase momentum and potentially initiate a new upward wave.
Support levels: 0.21154 – 0.19909 – 0.18566
Resistance levels: 0.22632 – 0.25025 – 0.28164
Legal Notice
The investment information, comments, and recommendations contained herein do not constitute investment advice. Investment advisory services are provided individually by authorized institutions taking into account the risk and return preferences of individuals. The comments and recommendations contained herein are of a general nature. These recommendations may not be suitable for your financial situation and risk and return preferences. Therefore, making an investment decision based solely on the information contained herein may not produce results in line with your expectations.

