
BTC/USDT
US President Donald Trump’s announcement that he has selected a candidate for Fed Chair but will reveal the name later has sparked curiosity in the markets. Bank of Japan Governor Kazuo Ueda stated that following the increase in interest rates to 0.75%, they aim to clarify the future path of rate hikes. According to CME FedWatch data, the probability of the Fed cutting interest rates by 25 basis points in December reached 87.4%. Furthermore, in line with Fed Chair Powell’s statements, quantitative tightening ended as of today.
From a technical perspective, although BTC managed to hold above the 90,000 level over the weekend, it faced selling pressure in the first hours of the week and month. The price, which lost the upward channel it started from the bottom level of 80,000, fell back to the 85,600 level. After a voluminous and sharp pullback, the price fell below the major rising line and entered a search for equilibrium once again. At the time of writing, the price is trading at the 86,500 level and is once again seeking to move towards the major trend line.
Technical indicators show that the Wave Trend (WT) oscillator retreated to the channel’s middle band with a sell signal after an indecisive buy signal in the overbought zone. The histogram on the Squeeze Momentum (SM) indicator is gaining momentum in negative territory again. The Kaufman moving average (KAMA) is currently positioned above the price at the $89,100 level.
According to liquidation data, the recent decline saw buy orders liquidated at the 89,000 and 85,000 levels, while activity continues to be concentrated in the 83,000–84,000 band. In contrast, sell orders have accumulated once again above the 92,000 level.
In summary, the momentum gained in BTC due to expectations of a Fed interest rate cut has come to an end. While the Bank of Japan’s tightening monetary policy messages put pressure on the markets, it was reported that Trump has nominated his candidate for Fed chair.Technically, the price managed to form an upward channel by increasing its upward momentum with support from the 80,500 bottom region and settled above the 90,000 band for a short time. However, increased selling pressure caused the price to turn downward again and lose the upward channel. Liquidity data indicates that target zones are regaining importance and that the market continues to seek equilibrium. After this stage, the price’s move back above the 87,000 level, where the major uptrend line passes, will be closely monitored, as a sustained gain above this level could create upward momentum. On the other hand, if selling pressure deepens, the 85,000 level emerges as a critical reference point. Losing this level is considered the final threshold that could strengthen the possibility of the price forming a double bottom pattern in the 80,000 range.
Supports: 85,000 – 84,000 – 83,300
Resistances: 87,000 – 89,000 – 90,000

ETH/USDT
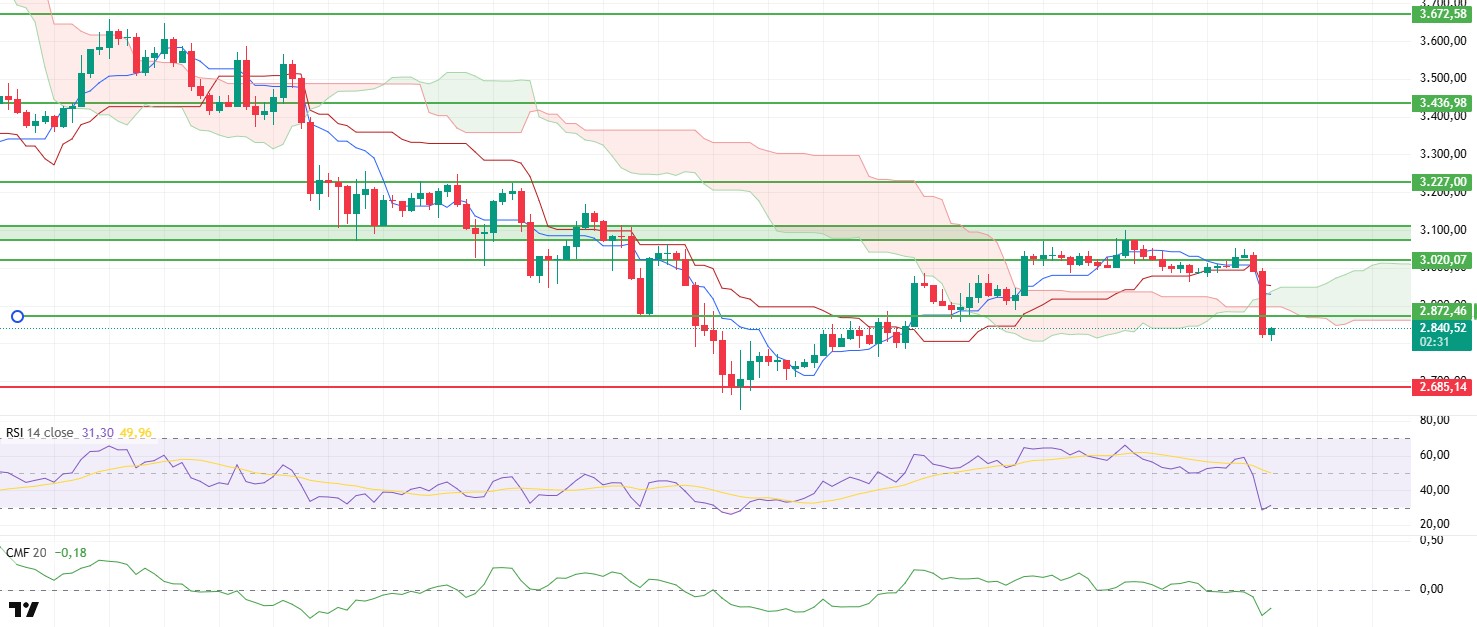
The Ethereum price rose over the weekend to the resistance level marked by the green rectangle on the chart on Friday, but then faced rejection from this area and fell below the $3,020 level. The price, which moved sideways below this level over the weekend, briefly rose above $3,020 with a short-term fake out, but a sharp bearish trend began with the weekly close, and the price fell back to the $2,806 level. This selling pressure indicates that buyers have not yet regained control.
The Chaikin Money Flow (CMF) indicator deepening into negative territory alongside the price indicates that liquidity outflows from the market are accelerating. This outlook suggests that pressure on the price may continue unless strong buying support emerges.
The Relative Strength Index (RSI) falling to the oversold zone signals serious weakness in momentum. However, the slight rebound in this zone keeps alive the possibility of a short-term upward test. If the RSI increases its upward momentum, short-term recoveries are likely.
In the Ichimoku indicator, the price breaking below the Kumo cloud and the Tenkan and Kijun levels indicates that the trend has re-entered negative territory. Additionally, the Tenkan line cutting below the Kijun provides further technical confirmation of the downtrend.
The overall picture shows that most indicators suggest the decline is not yet over. In the short term, thanks to reversal signals in the RSI, the price may attempt to recover to the $2,870 level. However, if there is a strong selling reaction from this level, the downward movement will continue. Breaking above the $2,870 level with volume support could weaken the negative outlook and allow the price to rise above the $3,000 level again. In the event of developments in the opposite direction, the $2,720 – $2,685 band will be monitored as the next support area.
Below the Form
Supports: 2,685 – 2,550 – 2,375
XRP/USDT
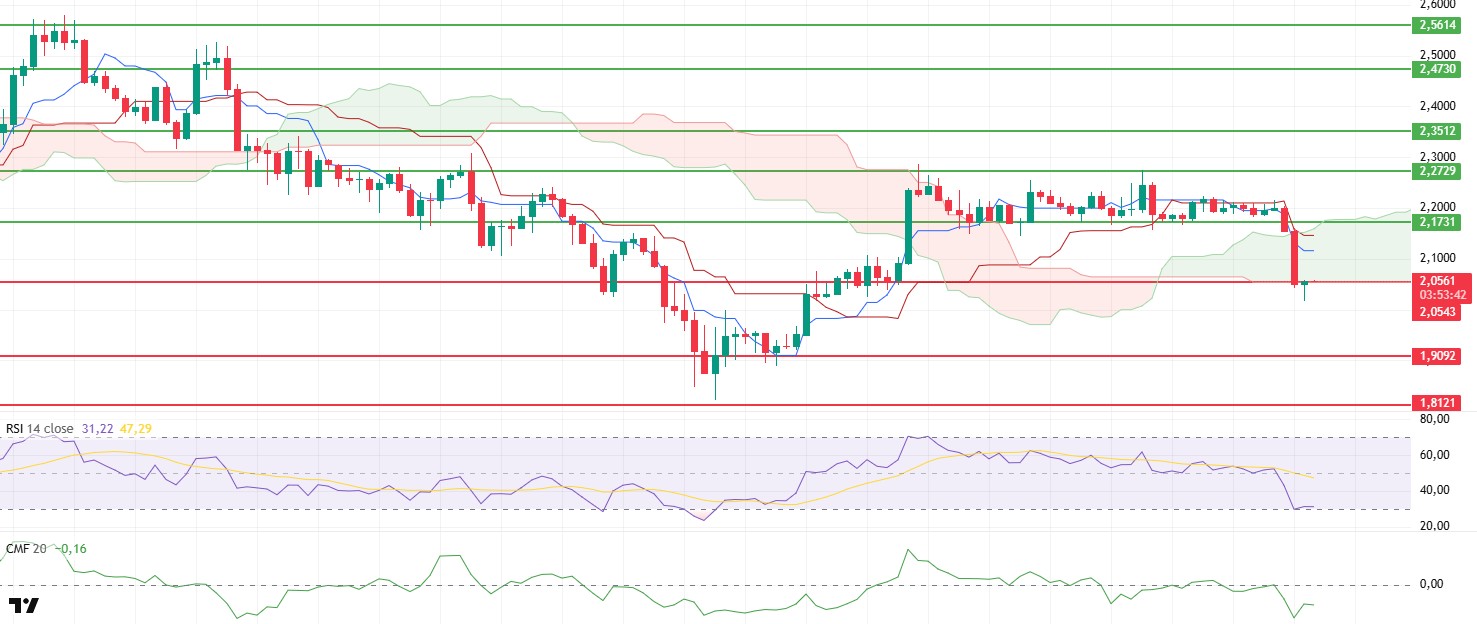
The XRP price experienced a sharp decline after losing the $2.17 support level following the weekly close and briefly traded below the $2.05 level, which is the lower band of the cloud. Subsequently, the price is attempting to stabilize around the cloud’s lower band again with rebound buying from this area. The current structure indicates that buyers are attempting to establish support in the critical zone, despite the selling pressure remaining strong.
The Chaikin Money Flow (CMF) indicator has fallen sharply into negative territory. The acceleration of liquidity outflows may limit upward reactions for now and confirms that sellers are in control.
The Relative Strength Index (RSI) indicator has also fallen to the oversold zone threshold. While this indicates that momentum has weakened significantly, it also signals that conditions may be ripe for a short-term rebound.
The loss of the Tenkan and Kijun levels in the Ichimoku indicator shows that the short-term trend has completely turned negative. The price’s struggle to stay above the Kumo cloud is the only positive point, indicating that the trend reversal potential has not completely disappeared.
The $2.05 level is currently the most critical support level. Closing below this level could accelerate the downtrend and bring the price down to the $1.90 level. However, if the price manages to hold above $2.05, short-term recovery signals from the RSI could lead to a short-term rebound, pushing the price towards the $2.12–$2.17 range. In short, pressure continues on XRP. For seller strength to weaken, both liquidity needs to recover and efforts to push the price back above the cloud need to gain momentum.
Supports: 2.0543 – 1.9092 – 1.8121
Resistances: 2.1731 – 2.2729 – 2.3512
SOL/USDT
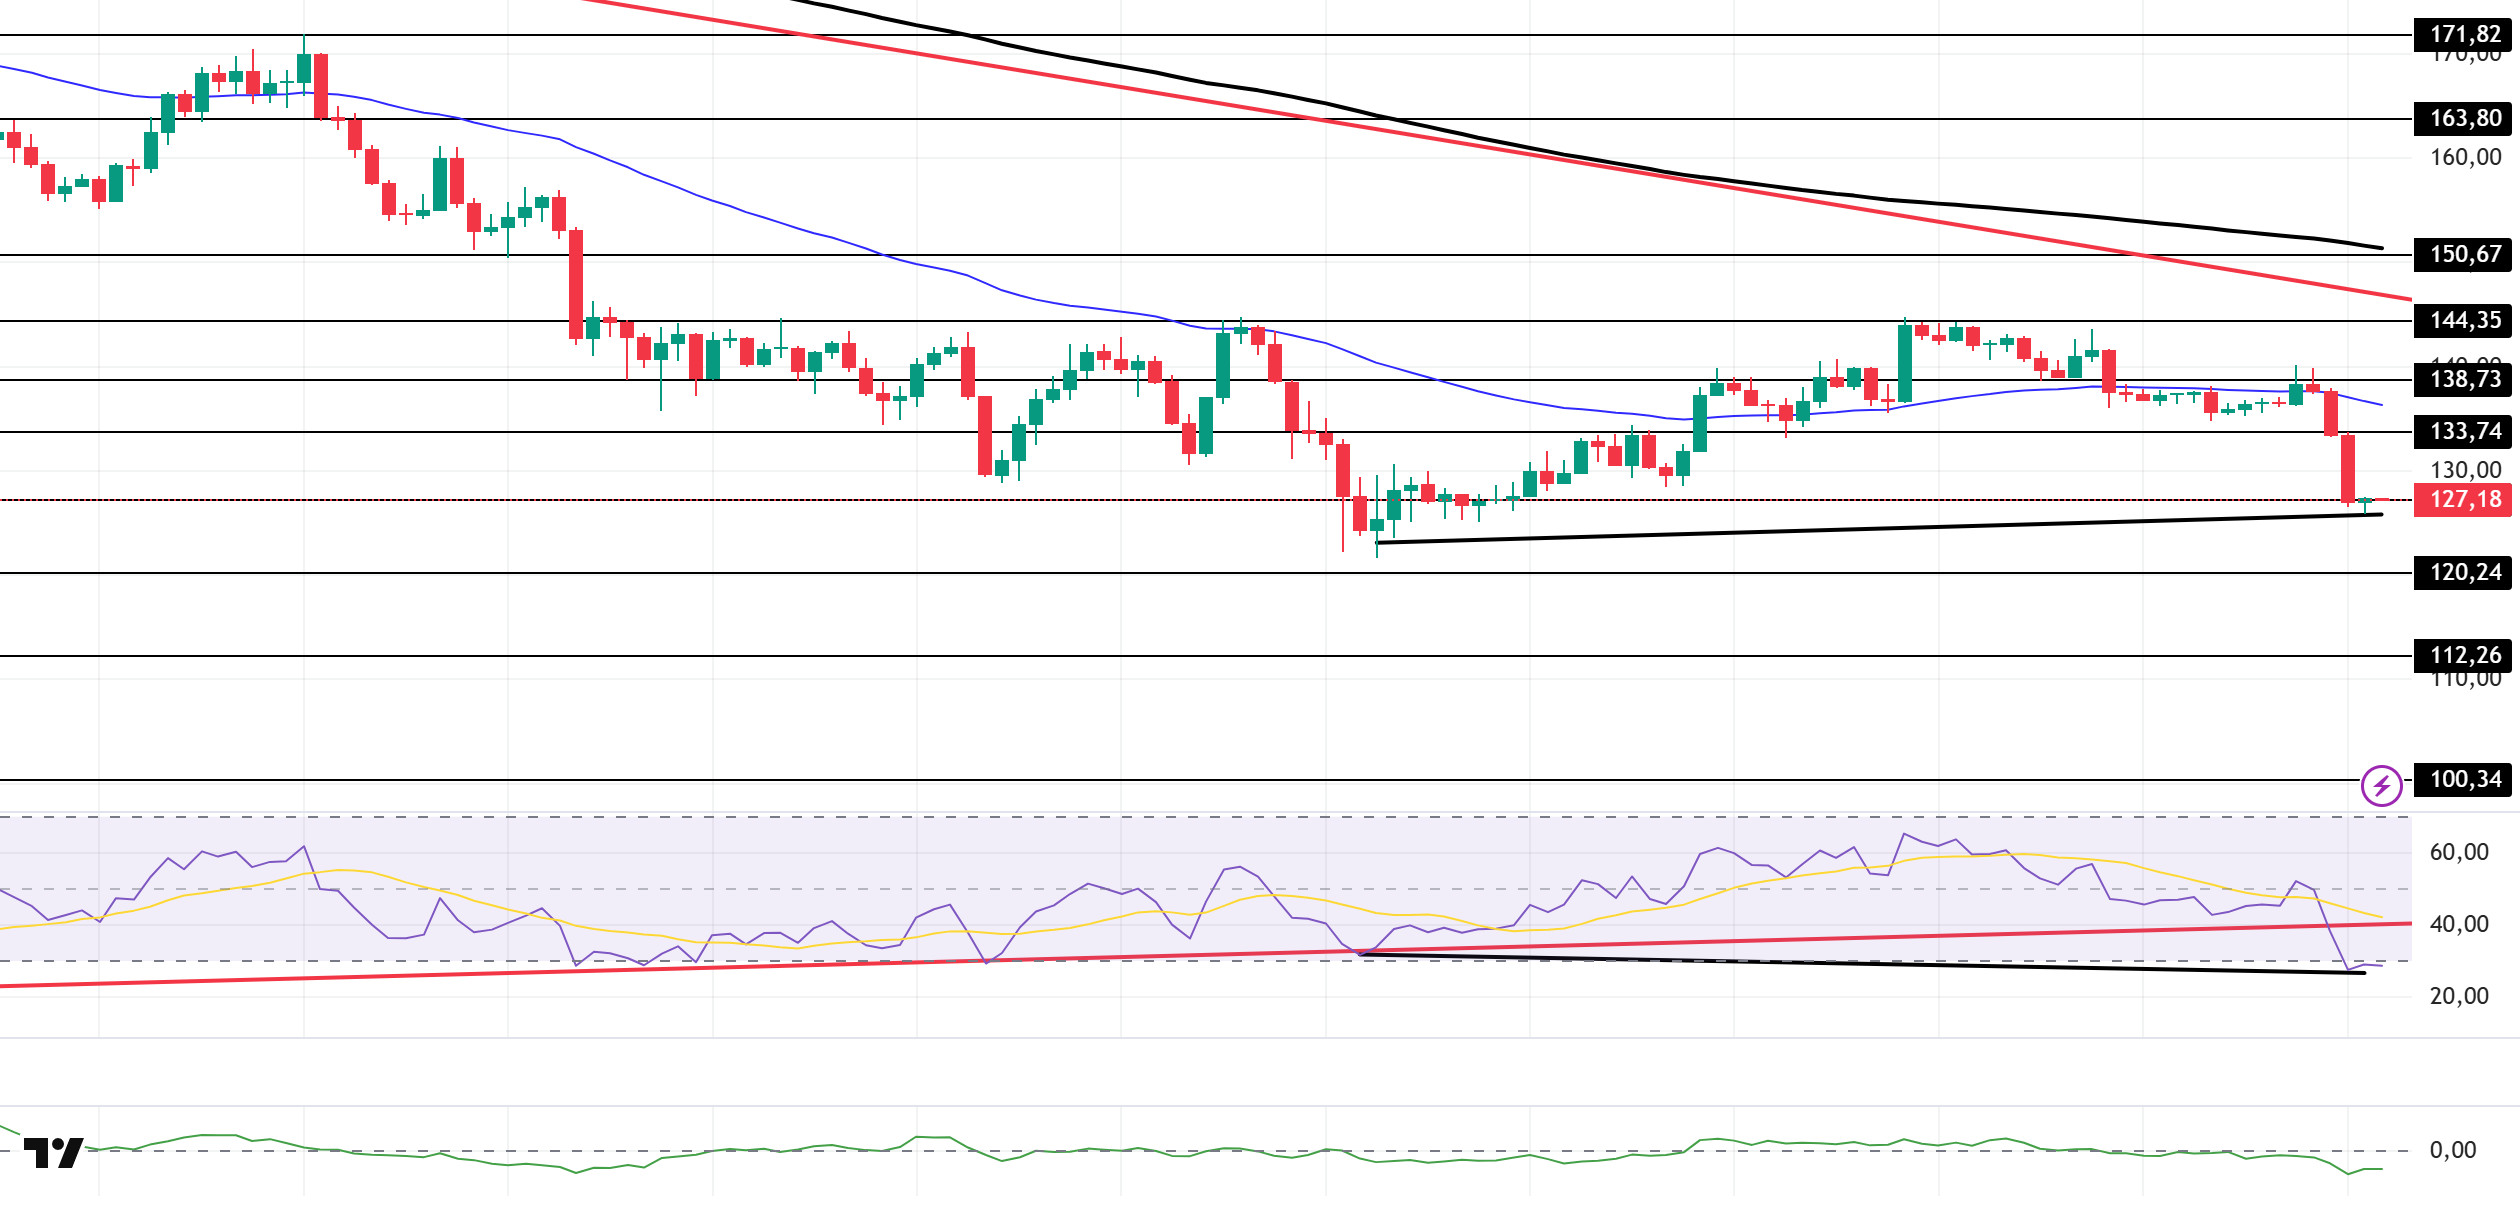
The SOL price experienced a decline. The asset continued to trade in the lower region of the downtrend that began on October 6. Testing the strong resistance level of $144.35, the price failed to break through and experienced a decline, beginning to trade below the 50 EMA (Blue Line) moving average. Currently continuing its decline, the asset may test the downward trend as resistance at candle closes above the $133.74 level. If the pullback continues, the $112.26 level should be monitored.
On the 4-hour chart, it remained below the 50 EMA (Exponential Moving Average – Blue Line) and 200 EMA (Black Line). This indicates that it may be in a medium-term downtrend. At the same time, the price being below both moving averages shows us that the asset is trending downward in the short term. The Chaikin Money Flow (CMF-20) has moved into negative territory. However, an increase in outflows could push the CMF deeper into negative territory. The Relative Strength Index (RSI-14) has started to move into oversold territory. It has also moved into the lower region of the upward trend that began on November 4. This could increase selling pressure. However, being in the oversold zone could trigger an uptrend. If an uptrend occurs due to macroeconomic data or positive news related to the Solana ecosystem, the $144.35 level stands out as a strong resistance point. If this level is broken upwards, the uptrend is expected to continue. If pullbacks occur due to developments in the opposite direction or profit-taking, the $112.26 level could be tested. A decline to these support levels could increase buying momentum, presenting a potential upside opportunity.
Supports: 120.24 – 112.26 – 100.34
Resistances: 127.21 – 133.74 – 138.73
DOGE/USDT
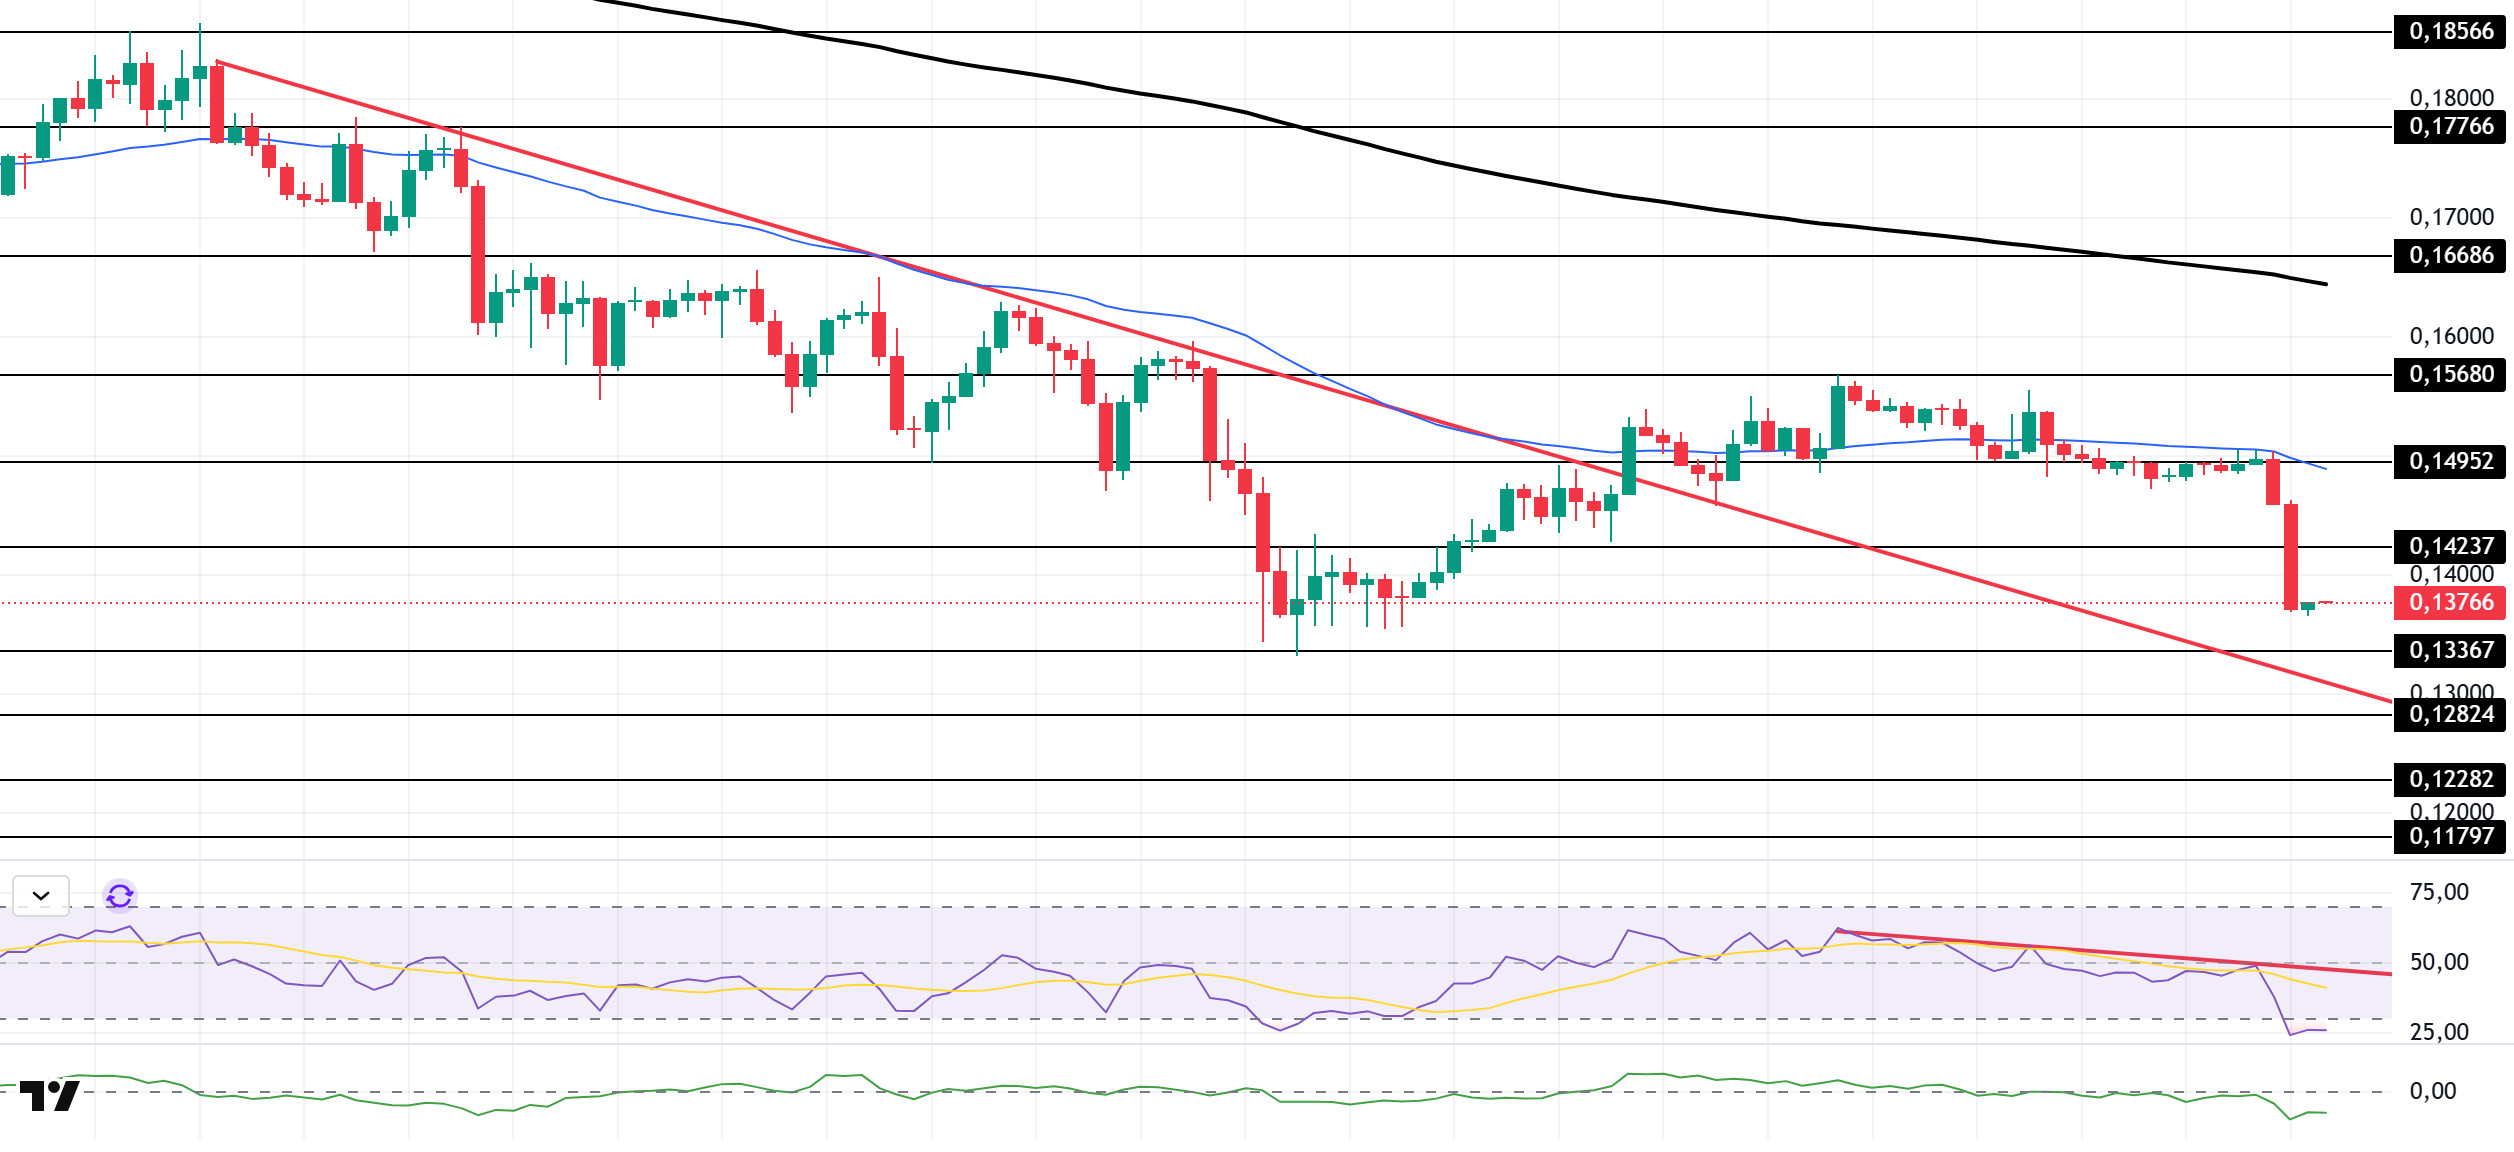
The DOGE price continued to lose value. The asset remained in the upper region of the downward trend that began on November 11. Testing the 50 EMA (Blue Line) moving average and the $0.14952 level as resistance, the price failed to break through and deepened its decline. Currently continuing its pullback, the price may test the downward trend line as support if the decline continues. In the event of an upturn, it may test the 50 EMA (Blue Line) moving average as resistance.
On the 4-hour chart, the 50 EMA (Exponential Moving Average – Blue Line) remained below the 200 EMA (Black Line). This indicates that a medium-term downtrend may begin. The price being below both moving averages indicates a downward trend in the short term. The Chaikin Money Flow (CMF-20) has also fallen into negative territory. Additionally, a decrease in cash inflows could push the CMF deeper into negative territory. The Relative Strength Index (RSI-14) has fallen into the oversold zone. It also remained below the downward trend line that began on November 26. This increased selling pressure. However, profit-taking could push the price higher. In the event of an uptrend driven by political developments, macroeconomic data, or positive news flow in the DOGE ecosystem, the $0.14952 level stands out as a strong resistance zone. Conversely, in the event of negative news flow, the $0.12824 level could be triggered. A decline to these levels could increase momentum and initiate a new wave of growth.
Supports: 0.13367 – 0.12824 – 0.12282
Resistances: 0.14237 – 0.14952 – 0.15680
AVAX/USDT
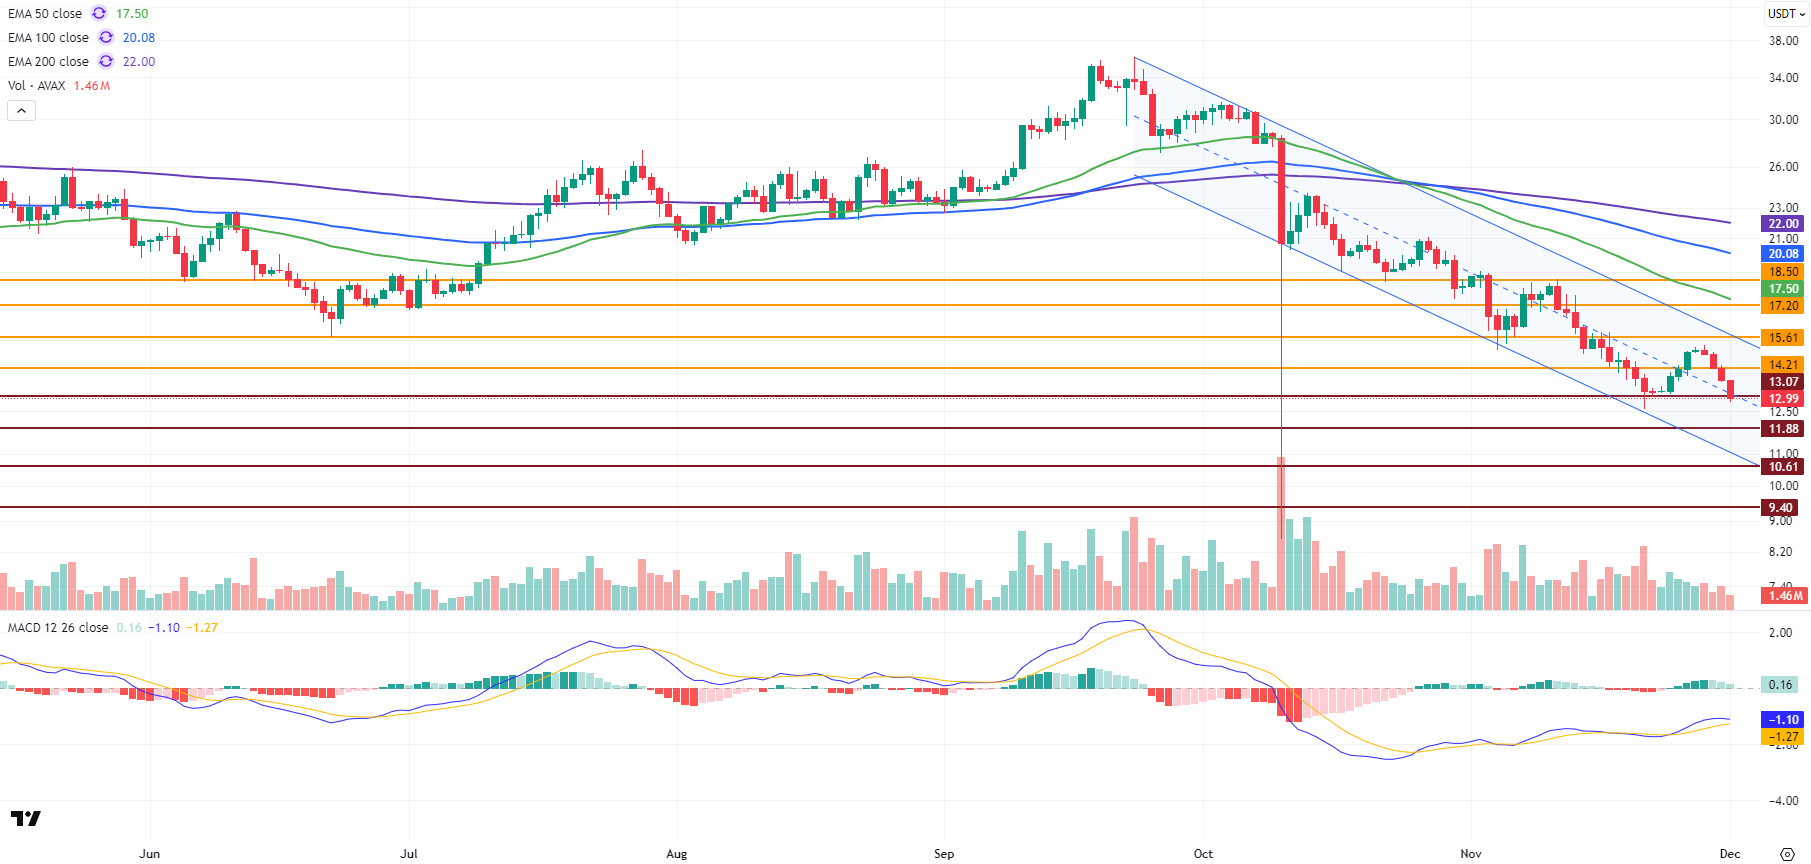
AVAX started last week at $13.28. It rose to $15.27 due to the recovery seen across the crypto market last week. Despite breaking the $14.21 resistance level and moving above the middle band of the bearish channel, AVAX failed to maintain its position in this area. With selling pressure increasing again, AVAX fell back below $14.21 and experienced a decline towards the middle band within the bearish channel. The weekly close was at $13.71, with AVAX losing approximately 3.32% of its value on a weekly basis. Although expectations of an interest rate cut by the Fed created a short-term rise across the crypto market, low volume limited the upside. Positive developments in the Avalanche ecosystem and ETF news supported the price fundamentally, but no lasting positive impact on the price materialized under current market conditions. AVAX started the new week with a decline and is testing the $13.07 support level.
On the daily chart, the Moving Average Convergence/Divergence (MACD) line is above the signal line. The MACD line remains in negative territory. This indicates that momentum has not yet gained strength and that a trend reversal has not been confirmed. Due to the MACD line and signal line moving very close to each other, a potential breakout could lead to sharp directional changes in the short term. Strengthening momentum and the MACD moving into positive territory are critical for the upward movement to break through resistance levels. Otherwise, the current weak momentum could increase selling pressure at resistance levels. AVAX continues to trade below all critical Exponential Moving Average (EMA) levels. The concentration of these levels above the price has created a strong resistance band and confirms that the trend is still in negative territory. Furthermore, AVAX continues to move within a bearish channel, and there has not yet been a strong break above the channel’s middle band. This indicates that volume increase and strong momentum are necessary to ensure sustainability in upward movements.
From a technical perspective, the $14.21 level is the first important resistance for AVAX in the short term. If this level is broken and sustainability is achieved above it, it could test the resistance zones of $15.61 and $17.20, respectively. The $18.50 level stands out as a major resistance in the short term. A close above $18.50 is critical for the upward movement to gain strength. Conversely, in a bearish scenario ( ), the $13.07 level is the first important support zone. Closes below this level could increase selling pressure and cause AVAX to fall towards the $11.88 and $10.61 support zones. In the overall picture, the MACD being in negative territory and the price remaining below the EMA levels indicates that AVAX is under pressure in the short term. Unless gradual rises above resistance levels are sustained, recovery attempts are likely to remain limited.
(EMA50: Green Line, EMA100: Blue Line, EMA200: Purple Line)
Supports: 13.07 – 11.88 – 10.61
Resistances: 14.21 – 15.61 – 17.20
LINK/USDT
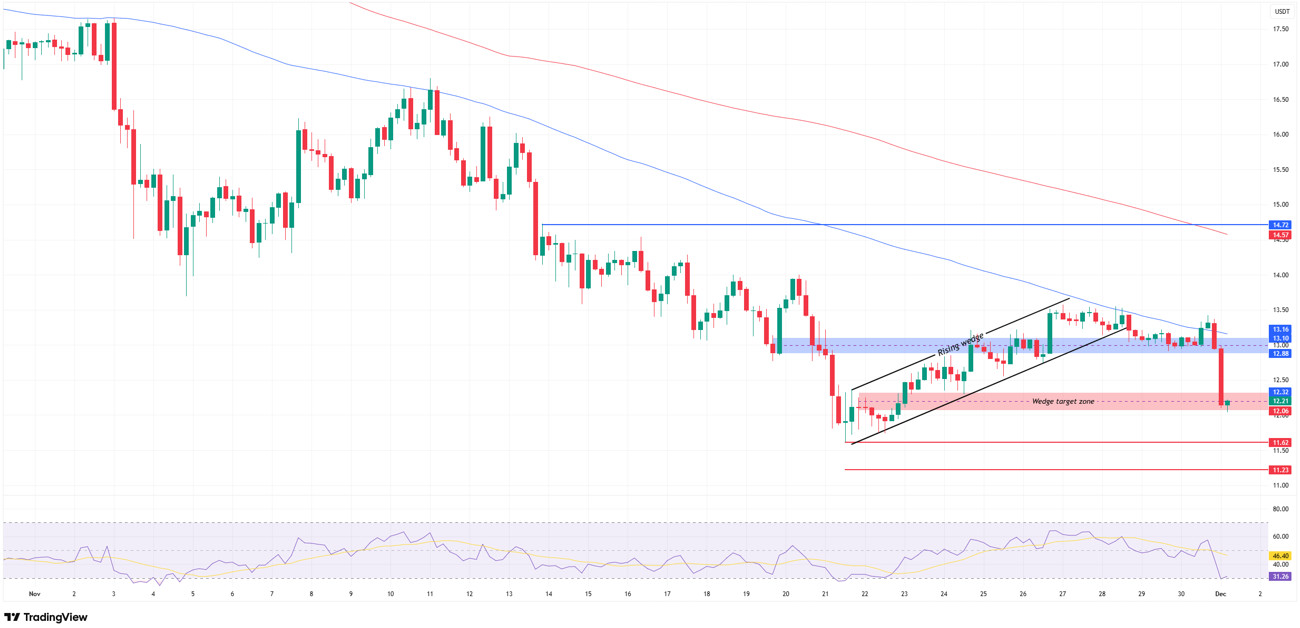
LINK, which saw a strong reaction from the $11 level on November 21, managed to break above the $13 level on November 27. After moving sideways in the $13 range for a while, the price retreated to the current support zone around $12 following selling pressure after the hammer candlestick formed at the $13.42 level. One reason for the price rebounding from this area is that the ascending wedge formation indicated on the chart has reached its target zone, and we can also mention the intersection of this wedge movement with the Fibonacci 0.786 retracement level.
In the upcoming period, the $12.06 level appears to be quite critical for the price movements that may occur, as it is both a strong support point for this correction movement and consistent with the formation target. A loss of this level could deepen the decline, pulling the price down to $11.62 initially and then to $11.23 levels. Therefore, maintaining the $12.06 level is important for the current structure.
In upward movements, the blue zone between $12.88 and $13.10 stands out as a critical resistance line for a potential bullish scenario to gain strength. The fact that this zone intersects with the 100-day moving average and is also the Fibonacci retracement zone ( ) of the last downward wave makes it a strong selling area. Furthermore, the 100-day moving average is still trending downward, indicating that the trend structure is negative. For us to talk about a permanent trend reversal, the moving average must first flatten, then the price must settle above this average and show an upward slope. In such a scenario, the price could potentially move up to the $14.72 level.
Although the Relative Strength Index (RSI) indicator produced a slight recovery signal with its reaction from the 29 level, it is still trading close to the oversold zone. This indicates that sellers continue to dominate. A loss of the $12.06 support level could cause the RSI to re-enter the oversold zone, technically supporting the bearish scenario. Therefore, it is important to closely monitor the critical levels indicated on the chart.
Supports: 12.06 – 11.62 –11.23
Resistances: 12.32 – 12.88 – 14.72
Legal Notice
The investment information, comments, and recommendations contained herein do not constitute investment advice. Investment advisory services are provided individually by authorized institutions taking into account the risk and return preferences of individuals. The comments and recommendations contained herein are of a general nature. These recommendations may not be suitable for your financial situation and risk and return preferences. Therefore, making an investment decision based solely on the information contained herein may not produce results in line with your expectations.

