
Technical Analysis
BTC/USDT
U.S. President Donald Trump announced that he will appoint a new governor this week to replace Fed Member Adriana Kugler, who resigned before the end of her term. UK-based Vaultz Capital purchased an additional 47.85 BTC, bringing its total Bitcoin reserves to 117.85. According to data, the total Bitcoin holdings of 100 publicly traded companies worldwide reached 955,526 BTC. SEC Chairman Paul Atkins highlighted Ethereum/Layer 1 chains, Coinbase-like super apps, and DeFi protocols as key areas in his “Project Crypto” speech.
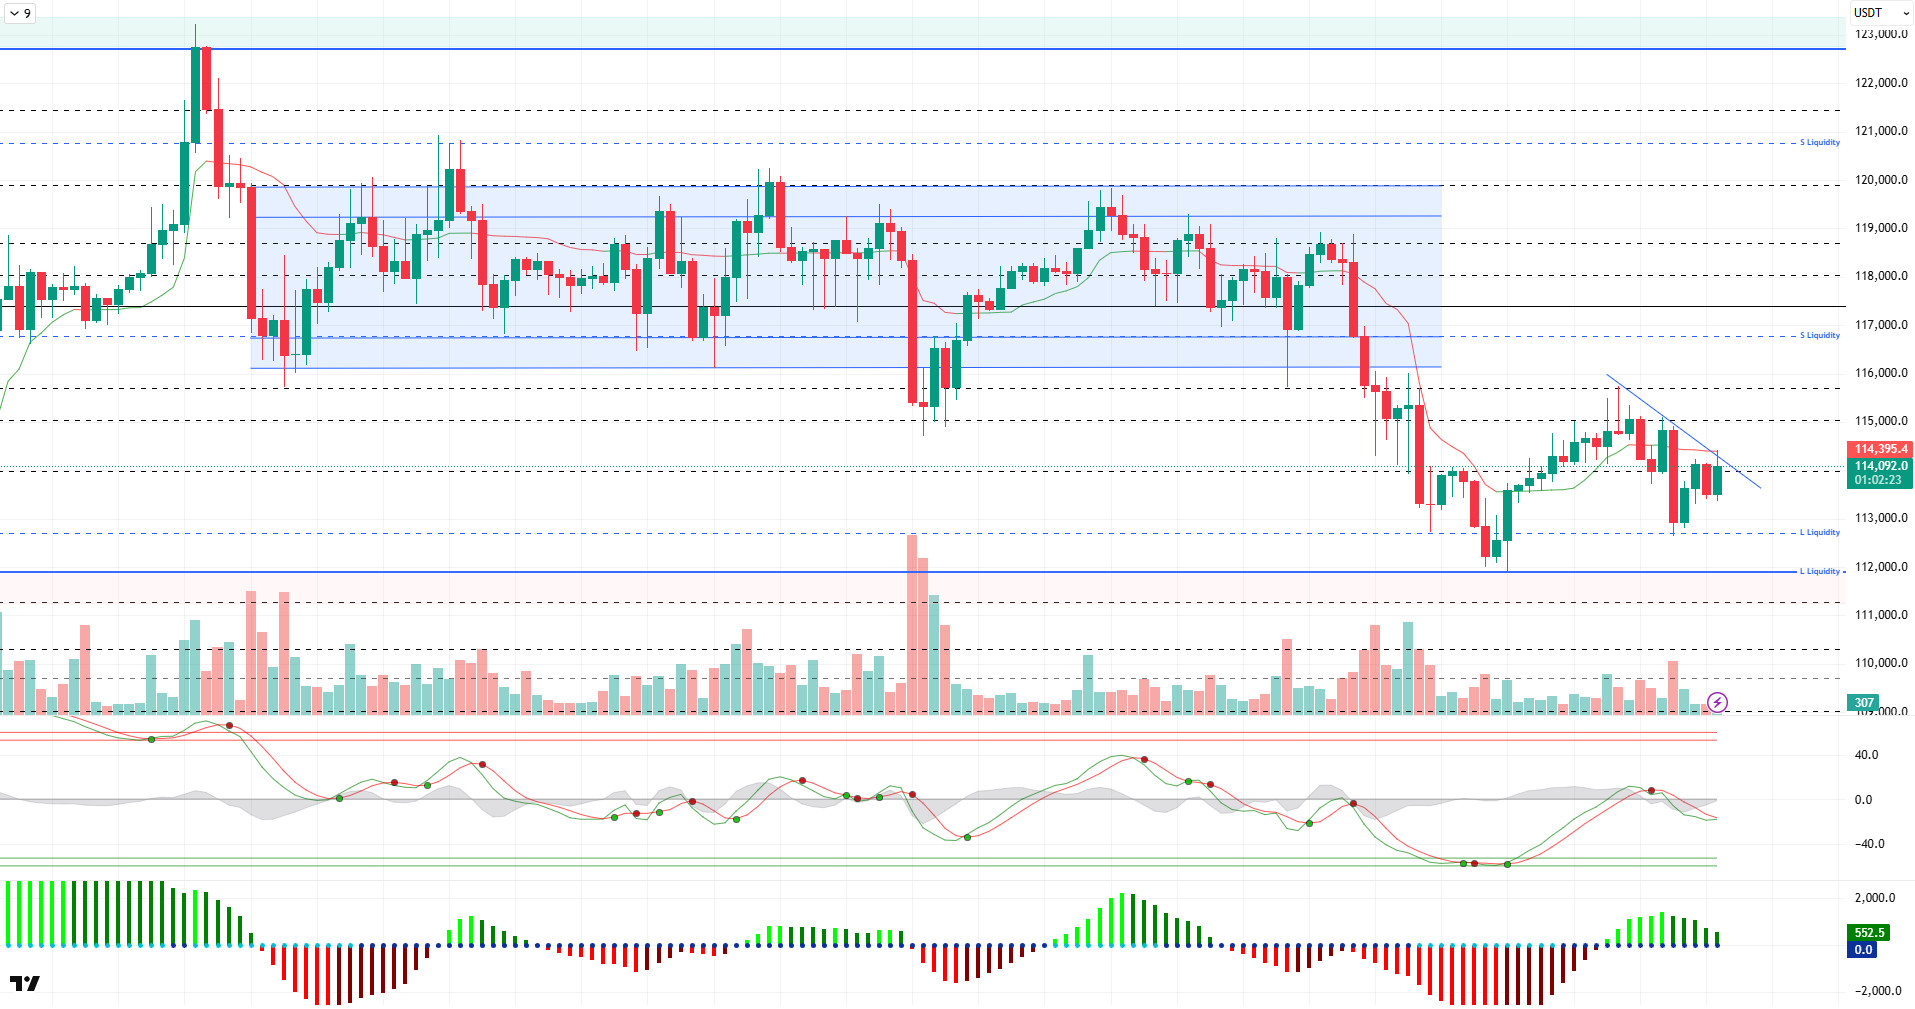
Looking at the technical picture, BTC fell below the 113,000 level yesterday amid selling pressure. The price rebounded quickly from this area and returned above the 114,000 level. BTC is currently testing the minor downtrend line but has not yet broken above it.
Technical indicators suggest that the Wave Trend oscillator is preparing for a trend reversal at the middle band of the channel. The Squeeze Momentum indicator is attempting to remain in the positive zone but is struggling to gain momentum. The Kaufman moving average is positioned just above the price at the 114,400 level and is acting as short-term resistance.
Looking at liquidity data, the accumulation of short-term sell positions opened at the 115,000 and 116,600 levels continues to increase, while the accumulation of sell positions above the 120,000 level in a broader time frame remains notable. Buy positions, on the other hand, have begun to re-emerge in the 111,500–112,000 range.
In summary, when we look at the fundamental developments, a relatively calmer market environment is beginning to emerge, while statements from the Trump camp continue to cause volatility. The technical outlook is indecisive in the middle band of the channel, but is trying to create a suitable ground for an uptrend. Liquidity data supports a potential upward scenario, potentially creating an environment conducive to testing the 115,000–116,000 range. On the other hand, in the event of potential selling pressure, the 113,000 level will continue to be monitored as a critical support point. Closures below this level could add depth to the downward trend.
Support levels: 114,000 – 113,200 – 112,000
Resistance levels: 115,000 – 116,000 – 116,800
ETH/USDT
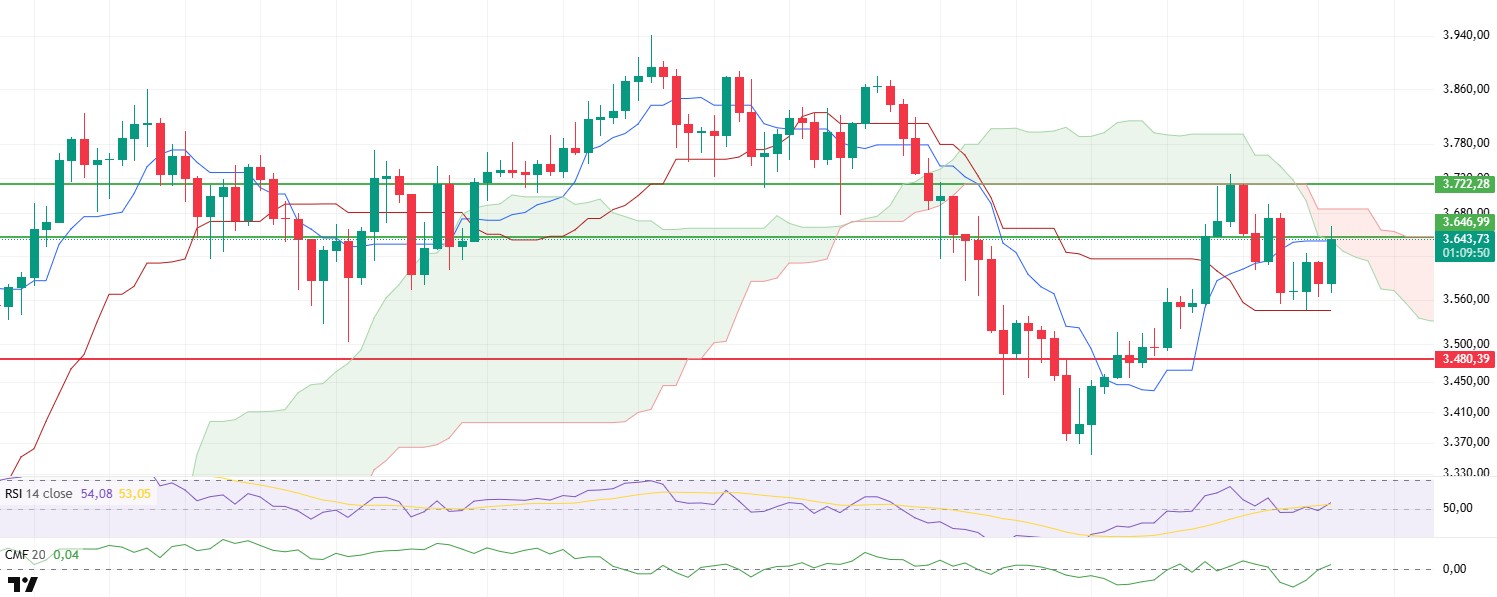
ETH attempted to break above the $3,646 level yesterday evening but failed to maintain its position above this area, facing selling pressure in line with expectations and retreating to the $3,545 kijun support level. At this point, buyers stepped in, causing the price to reverse its direction upward and rise to the lower band of the kumo cloud, an important reference point in the short term.
When technical indicators are examined in detail, the fact that the price has not yet made a clear breakout within the Ichimoku cloud indicates that a clear trend reversal has not been confirmed. In particular, the price remaining below the tenkan level indicates that short-term pressure persists and the current recovery has not yet produced a strong technical signal. This suggests that upward movements may remain limited for now and selling pressure could continue.
The Chaikin Money Flow (CMF) indicator briefly entered negative territory following the recent decline but quickly rebounded to return to positive territory. This supports the notion that liquidity is returning to the market and that buyers are regaining strength in the short term. The CMF’s swift response suggests that accumulation may have intensified in the lower price regions.
The Relative Strength Index (RSI) indicator has gained upward momentum with support from the 50 reference level. The RSI crossing above its based MA line indicates that momentum is strengthening and this situation is creating a bullish foundation for price movements. This recovery in the RSI can be considered a positive technical development, especially in terms of testing mid-term resistance zones.
In light of the current technical outlook, the likelihood of the price entering the cloud within the day is coming to the fore. If this scenario materializes, the price could technically rise to the upper band of the cloud at $3.685. However, for this rise to be sustainable, the key resistance level at 3,646 USD must be strongly broken. Otherwise, selling pressure from this level could lead to the price moving back down and retesting short-term support levels. Therefore, price reactions around the 3,646 USD level should be closely monitored.
Top of Form
Below the Form
Support levels: 3,480 – 3,285 – 3,081
Resistance levels: 3,646 – 3,722 – 4,084
XRP/USDT
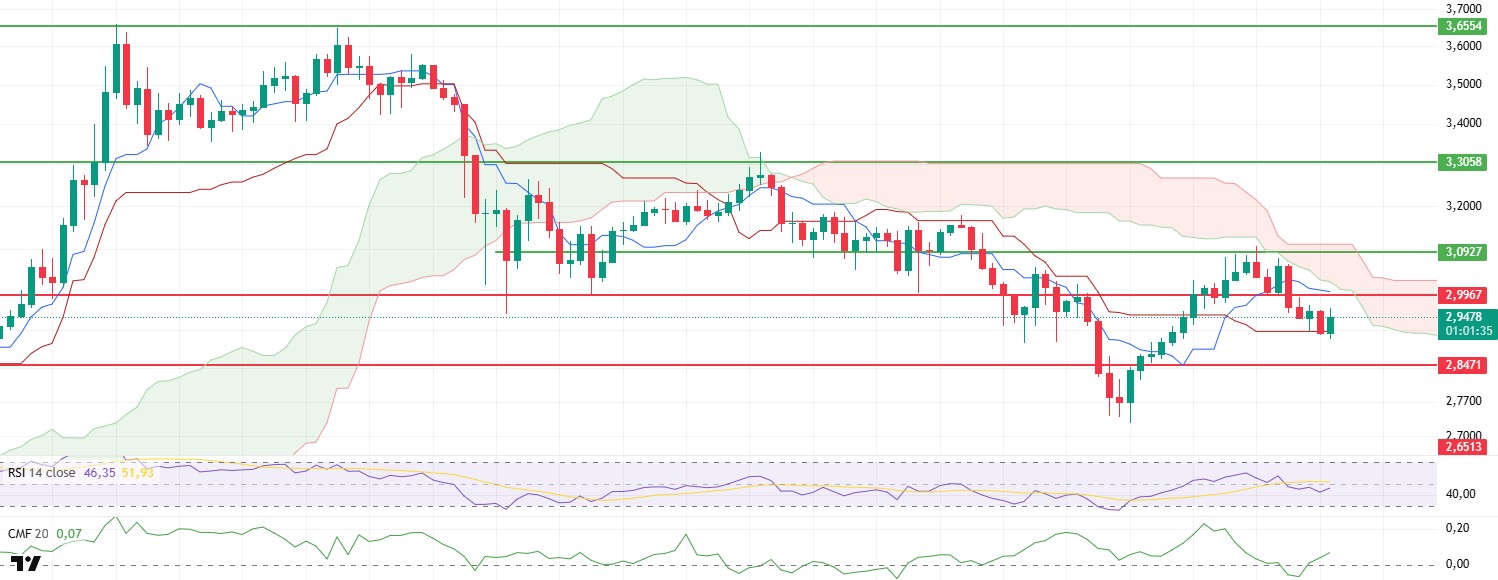
XRP continued its decline after losing its important support level of $2.99 yesterday evening, retreating to the kijun level of $2.90 on the Ichimoku indicator. While a partial recovery attempt was observed with limited buying activity from this area, the price remains below the $2.99 level, indicating that the market is in an indecisive state. Technical indicators, however, suggest that this indecision could break in certain directions.
The Chaikin Money Flow (CMF) indicator has returned to positive territory with a sharp reversal despite the recent decline. This development indicates that liquidity is beginning to flow back into the market and that buyers are gaining strength in the short term. The CMF’s rapid move into positive territory can be interpreted as a reflection of increased buying interest at lower levels and may serve as a leading indicator of a potential recovery movement.
However, the Relative Strength Index (RSI) indicator continues to show weakness. The RSI remains below the 50 reference level and continues to form lower peaks in this region. This structure suggests that market momentum has not gained sufficient strength and that upward price movements may not be sustainable in the short term. The weak structure on the RSI side indicates that the buying side remains cautious and that rebound buying has not yet evolved into a strong trend reversal.
When analysing the Ichimoku indicator, the fact that the price has not broken below the kijun level can initially be interpreted as a positive signal. However, the tenkan level and, in particular, the kumo cloud remaining above the price indicate that short-term technical pressure is still present. This situation, , suggests that the price has not yet entered a trend reversal process and that the current movement is mostly limited to minor reactions.
In general, for XRP to enter a clear recovery process, it must first break through the $2.99 level with high volume and enter the kumo cloud. Until this happens, the likelihood of weak upward attempts and renewed downward pressure will remain strong. Price behavior above the 2.99 dollar level remains critically important for determining XRP’s short-term direction.
Supports: 2.8471 – 2.6513 – 2.4795
Resistances: 2.9967 – 3.0927 – 3.3058
SOL/USDT
Phantom has announced its fourth acquisition in the past 16 months by adding SolSniper, an advanced on-chain trading terminal.
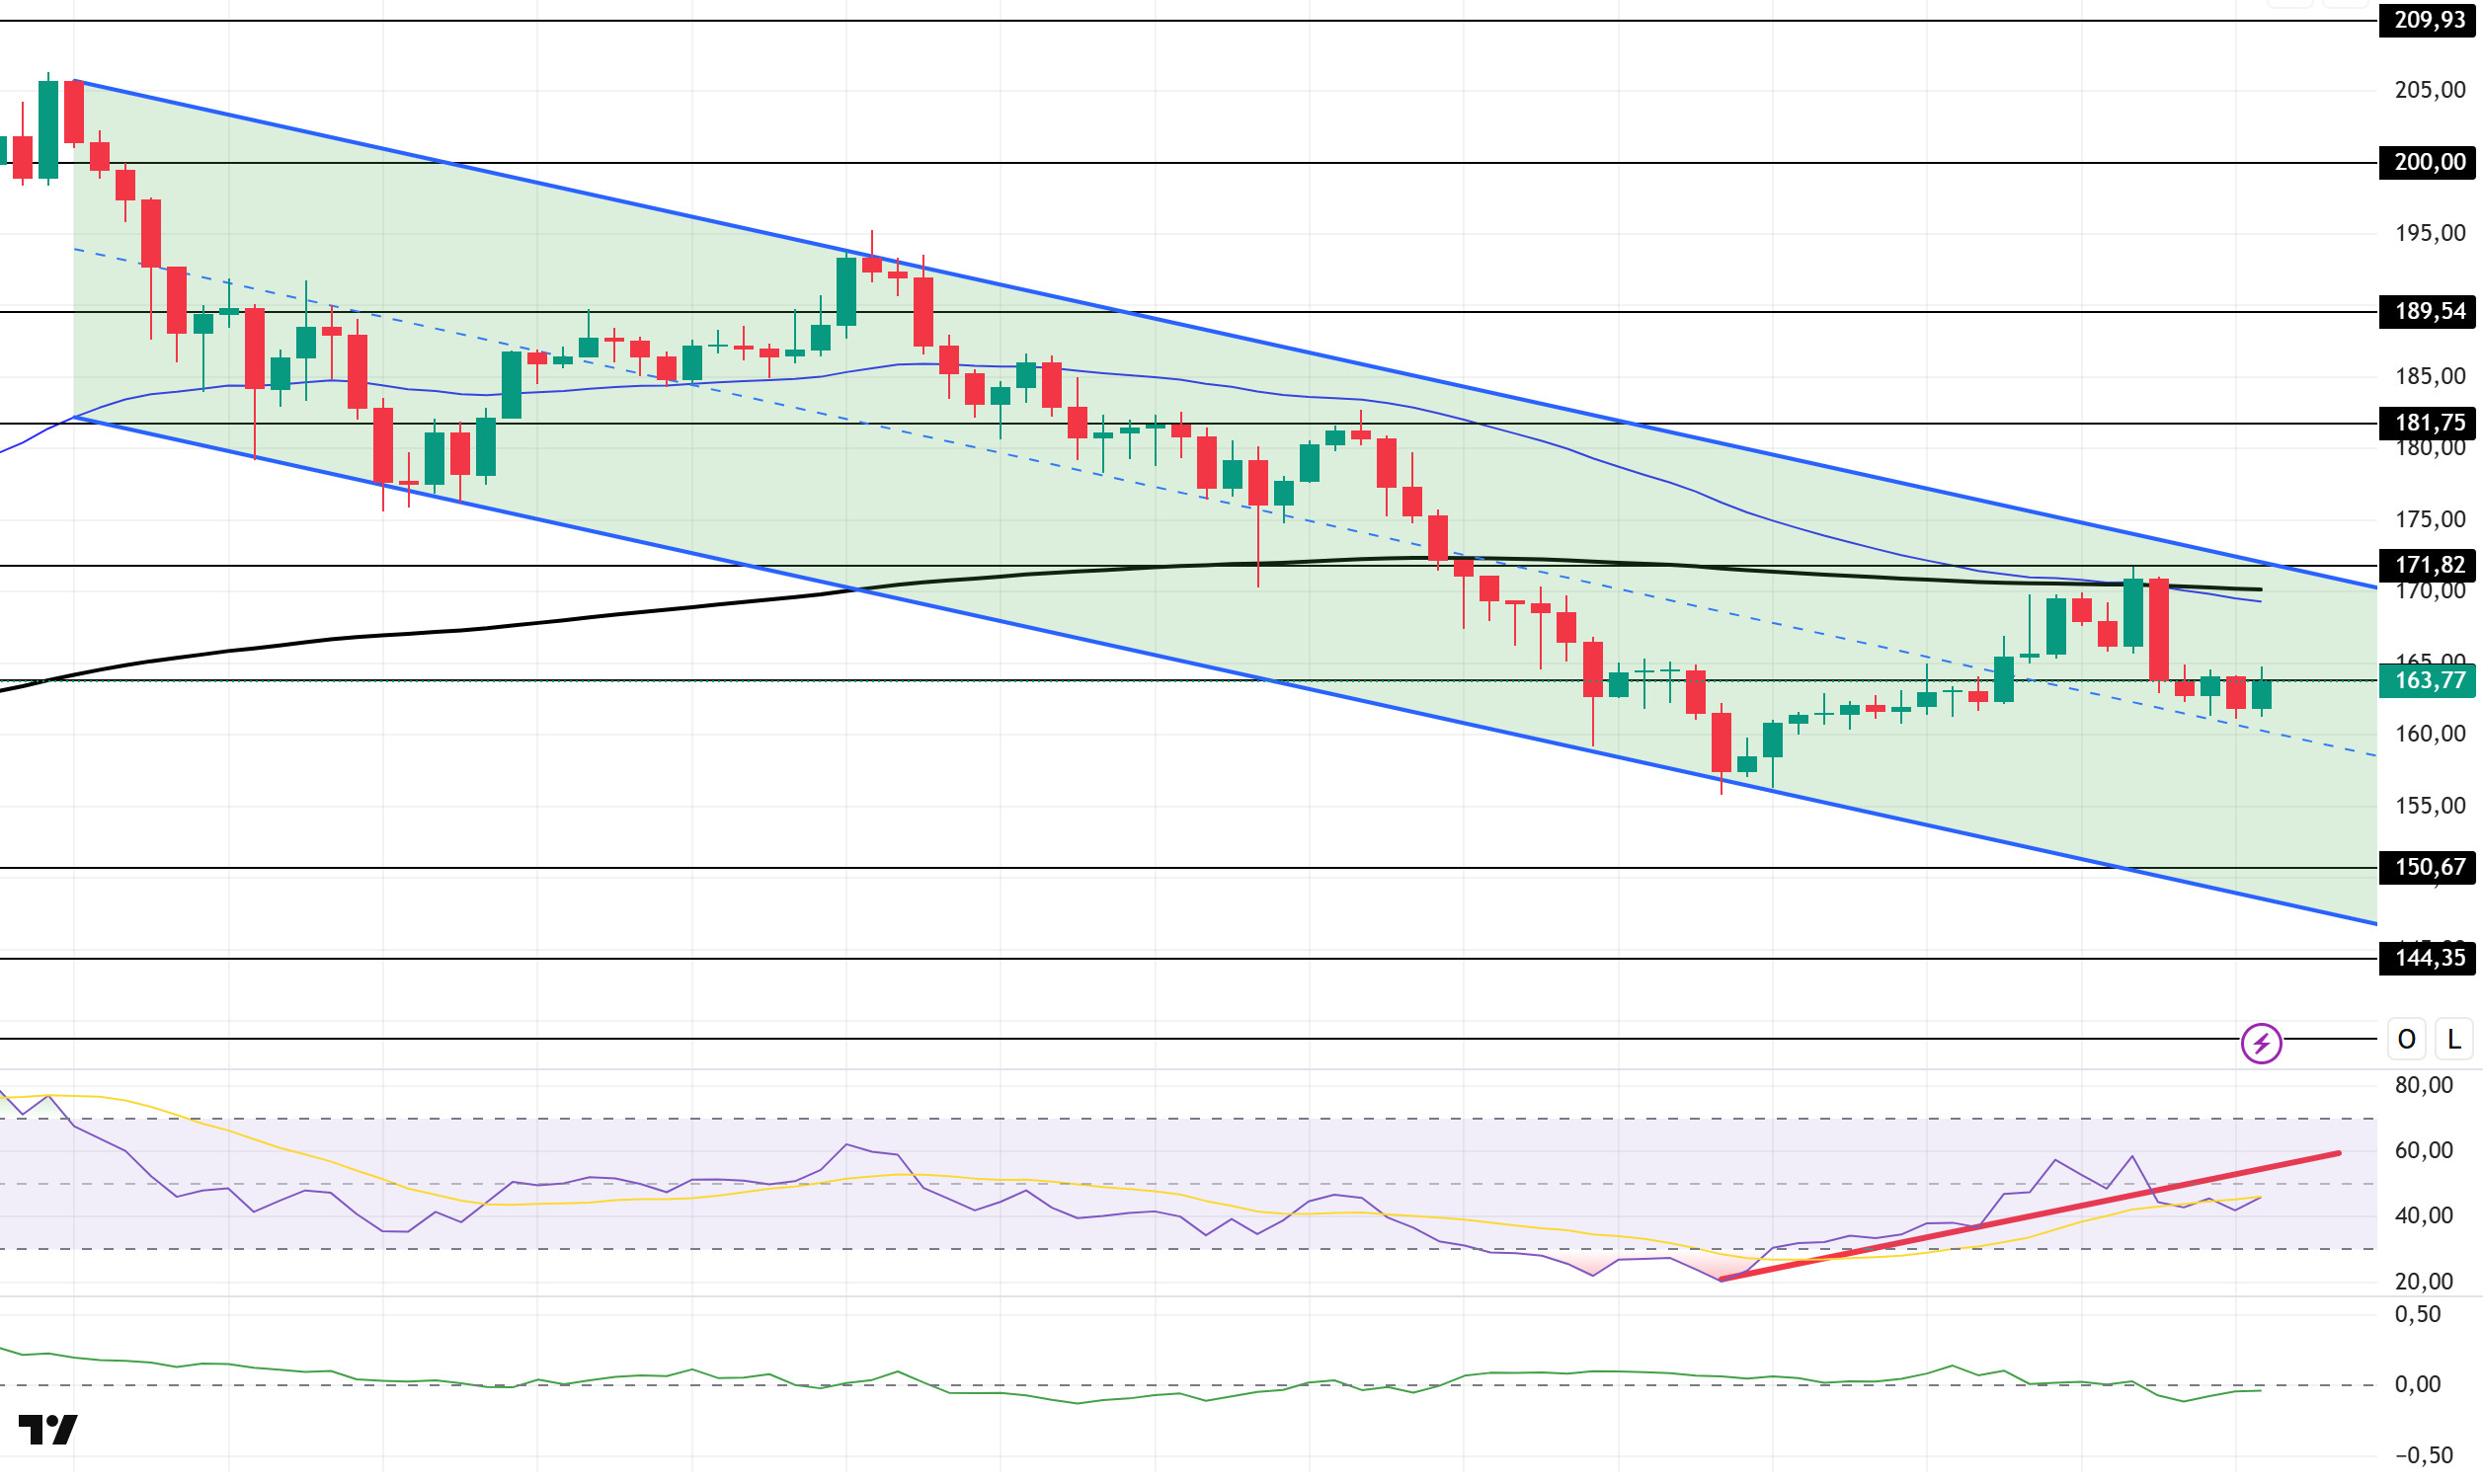
The SOL price has shown a slight decline. The asset has continued to remain within the downward trend that began on July 23. The price, which has remained below the 200 EMA (Black Line) and 50 EMA (Blue Line) moving averages, is currently testing the strong resistance level of $163.80. If the decline continues, the 150.67 dollar level should be monitored. In the opposite scenario, the 171.82 dollar level should be monitored as a resistance level.
On the 4-hour chart, the 50 EMA (Blue Line) has started to fall below the 200 EMA (Black Line). This indicates that the upward trend may continue in the medium term. At the same time, the price being below both moving averages shows that the market is currently in a downward trend. The Chaikin Money Flow (CMF-20) has moved into the negative zone. Additionally, a decrease in money inflows could push the CMF further into the negative zone. The Relative Strength Index (RSI-14) has crossed below the upward trend that began on August 2. This indicates that selling pressure may begin. In the event of an upward movement due to macroeconomic data or positive news related to the Solana ecosystem, the $181.75 level emerges as a strong resistance point. If this level is broken to the upside, the upward movement is expected to continue. In the event of developments in the opposite direction or profit-taking due to , pullbacks could test the $150.67 level. A decline to these support levels could see an increase in buying momentum, presenting a potential opportunity for an upward move.
Support levels: 150.67 – 144.35 – 138.73
Resistance levels: 163.80 – 171.82 – 181.75
DOGE/USDT
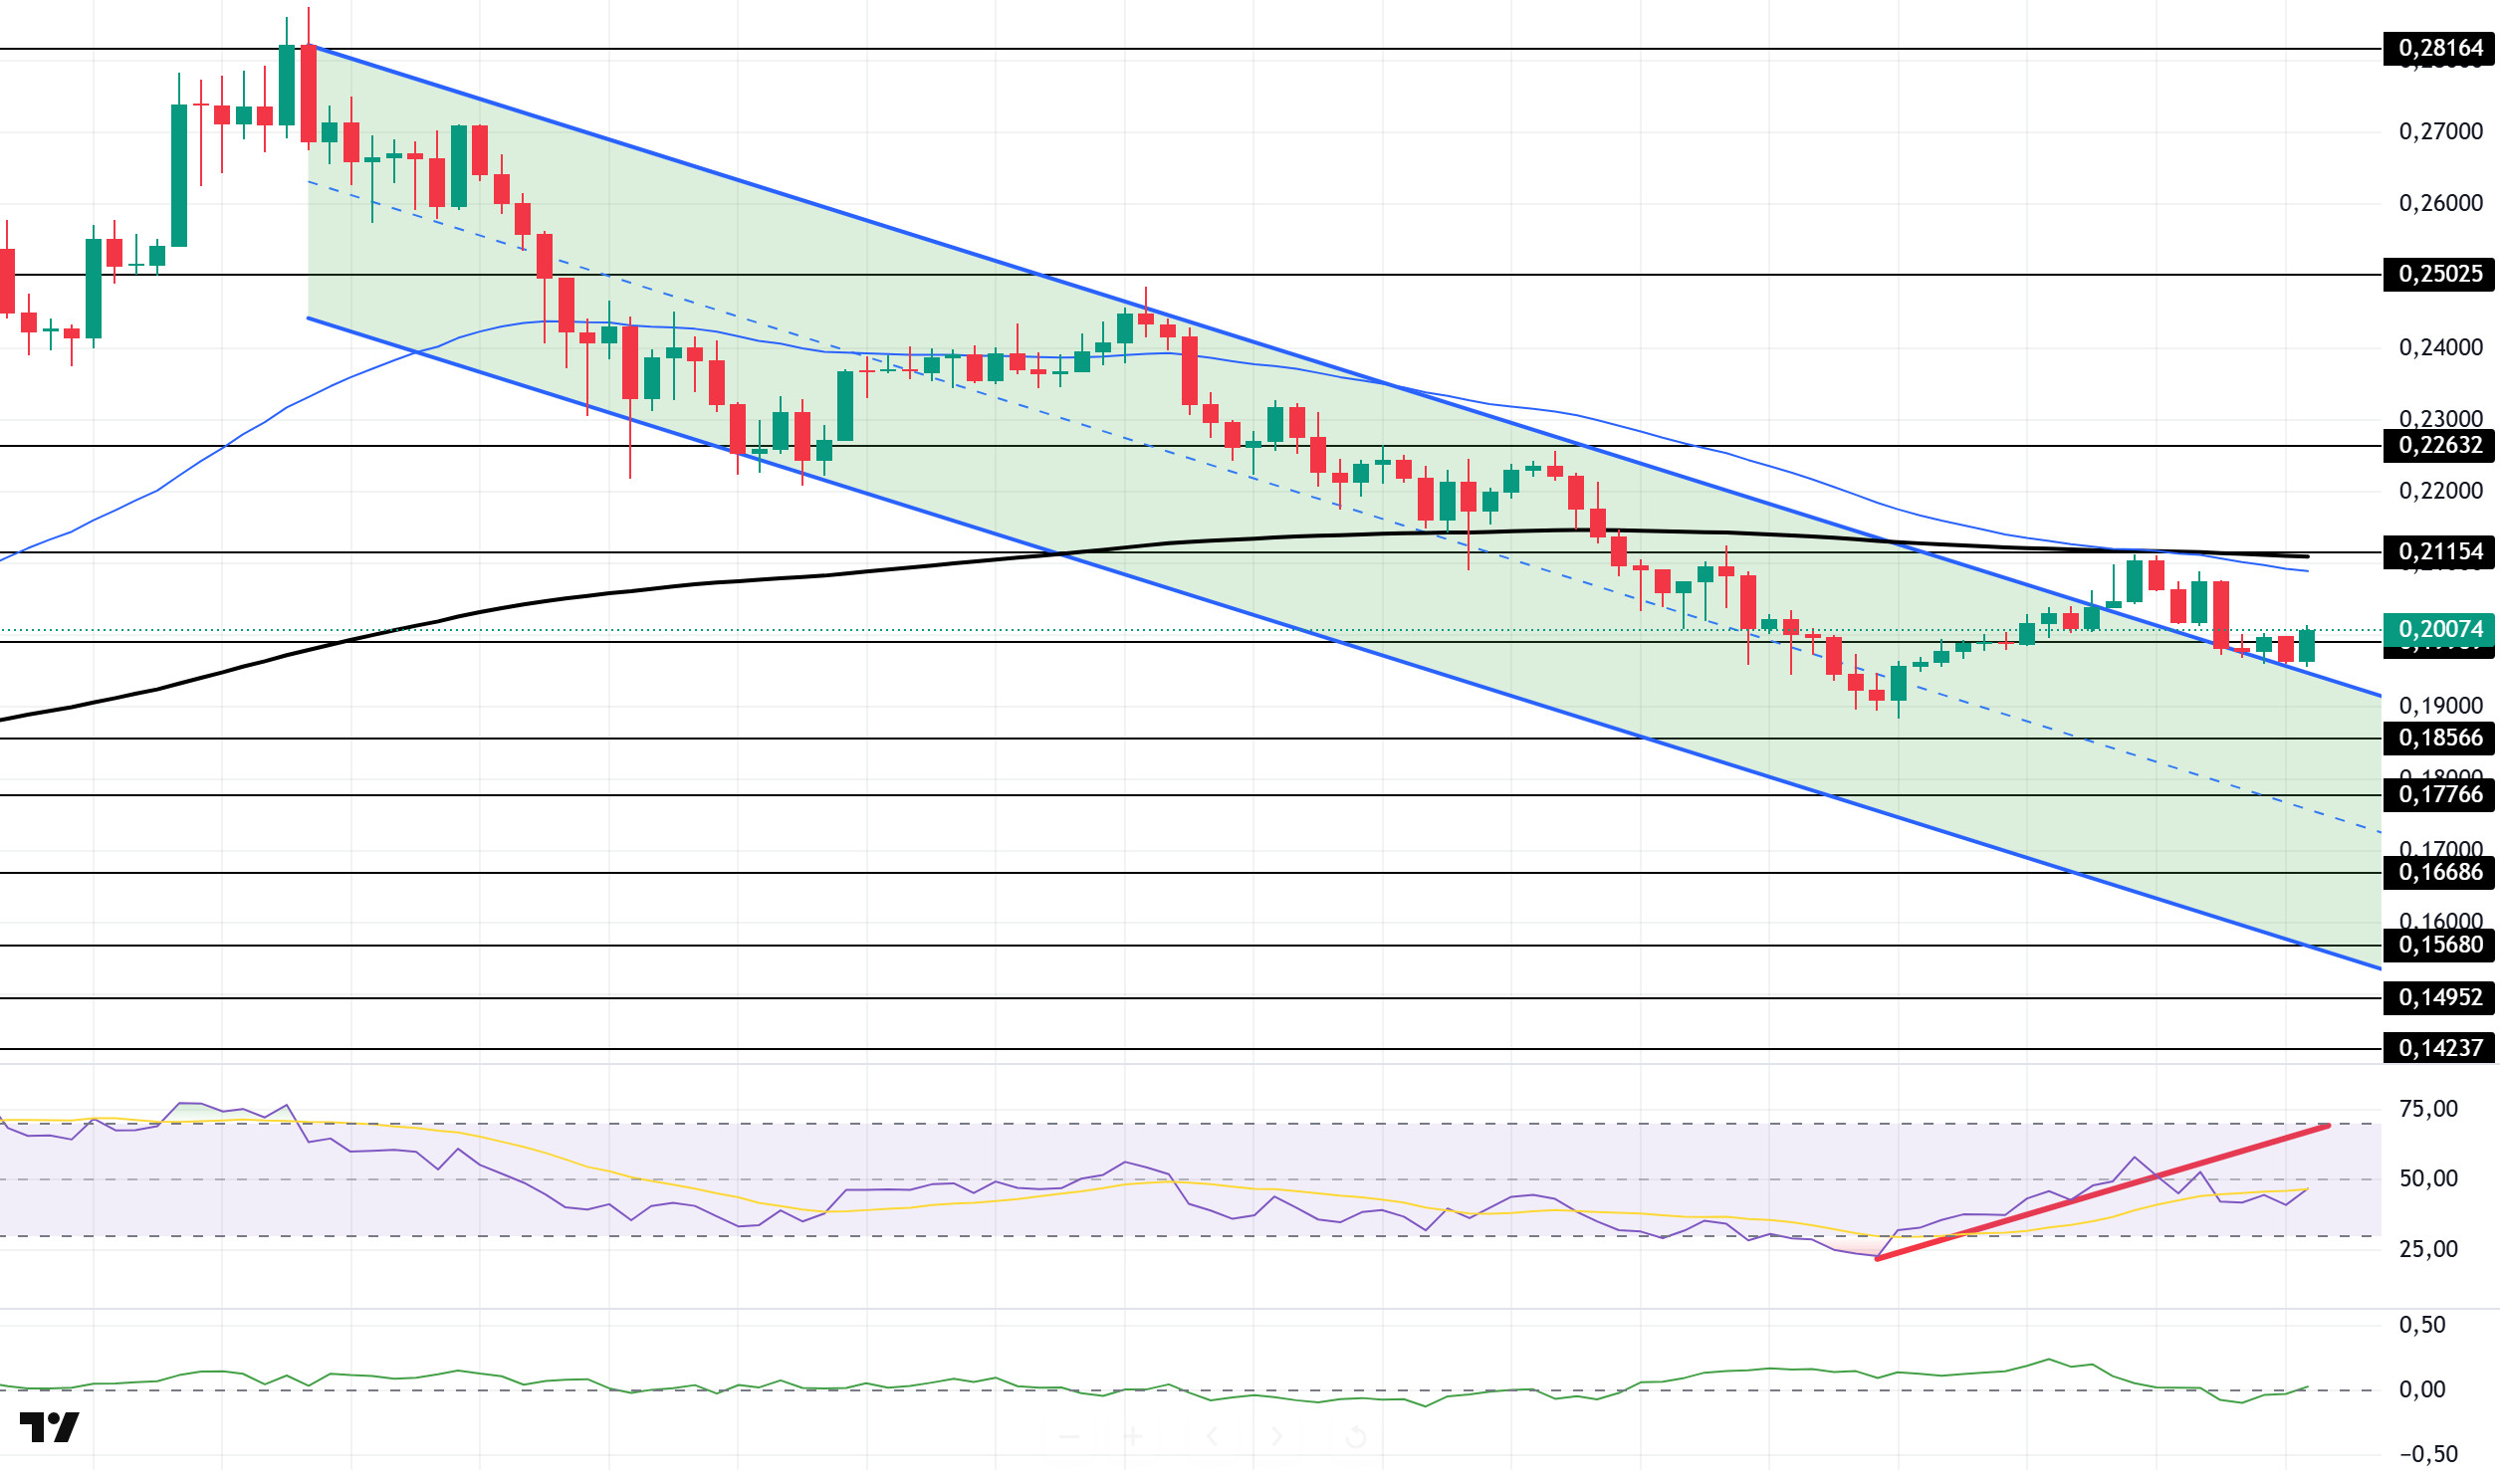
The DOGE price continued its sideways movement. The asset broke above the downward trend that began on July 21 and has remained above it. The price, which is below the 50 EMA (Blue Line) and 200 EMA (Black Line) moving averages, tested the ceiling of the upward trend as support and showed a slight increase, currently testing the strong resistance level of $0.19909. If an increase occurs, the $0.21154 level can be monitored as resistance.
On the 4-hour chart, the 50 EMA (blue line) remained below the 200 EMA (black line). This indicates that the asset is in a downtrend in the medium term. The fact that the price is below both moving averages also signals that the asset is in a downtrend in the short term. The Chaikin Money Flow (CMF-20) remained at a neutral level. Additionally, negative cash inflows could push the CMF into negative territory. The Relative Strength Index (RSI-14) continued to remain in the negative zone. Additionally, the indicator breaking below the upward trend that began on August 2 signals the formation of selling pressure. In the event of potential increases driven by political developments, macroeconomic data, or positive news flow within the DOGE ecosystem, the $0.22632 level emerges as a strong resistance zone. In the opposite scenario or in the event of negative news flow, the 0.17766 dollar level could be triggered. A decline to these levels could lead to increased momentum, potentially initiating a new upward wave.
Support levels: 0.18566 – 0.17766 – 0.16686
Resistance levels: 0.19909 – 0.21154 – 0.22632
Legal Notice
The investment information, comments, and recommendations contained herein do not constitute investment advice. Investment advisory services are provided individually by authorized institutions taking into account the risk and return preferences of individuals. The comments and recommendations contained herein are of a general nature. These recommendations may not be suitable for your financial situation and risk and return preferences. Therefore, making an investment decision based solely on the information contained herein may not produce results in line with your expectations.

