
Technical Analysis
BTC/USDT
US President Donald Trump announced that the second phase of sanctions against Russia is ready and that “unfair penalties” imposed on American companies under the Section 301 process will be lifted. Treasury Secretary Bessent stated that the Fed is using faulty models and policy tools have become overly complex. Chicago Fed President Goolsbee said that employment is below equilibrium and stagflationary pressures are increasing. Metaplanet bought another 136 BTC, bringing its total holdings to 20,136 BTC and bringing its return on investment to 487% since the beginning of the year. According to Glassnode data, Bitcoin’s illiquid supply surpassed 14.3 million BTC, reaching an all-time high.
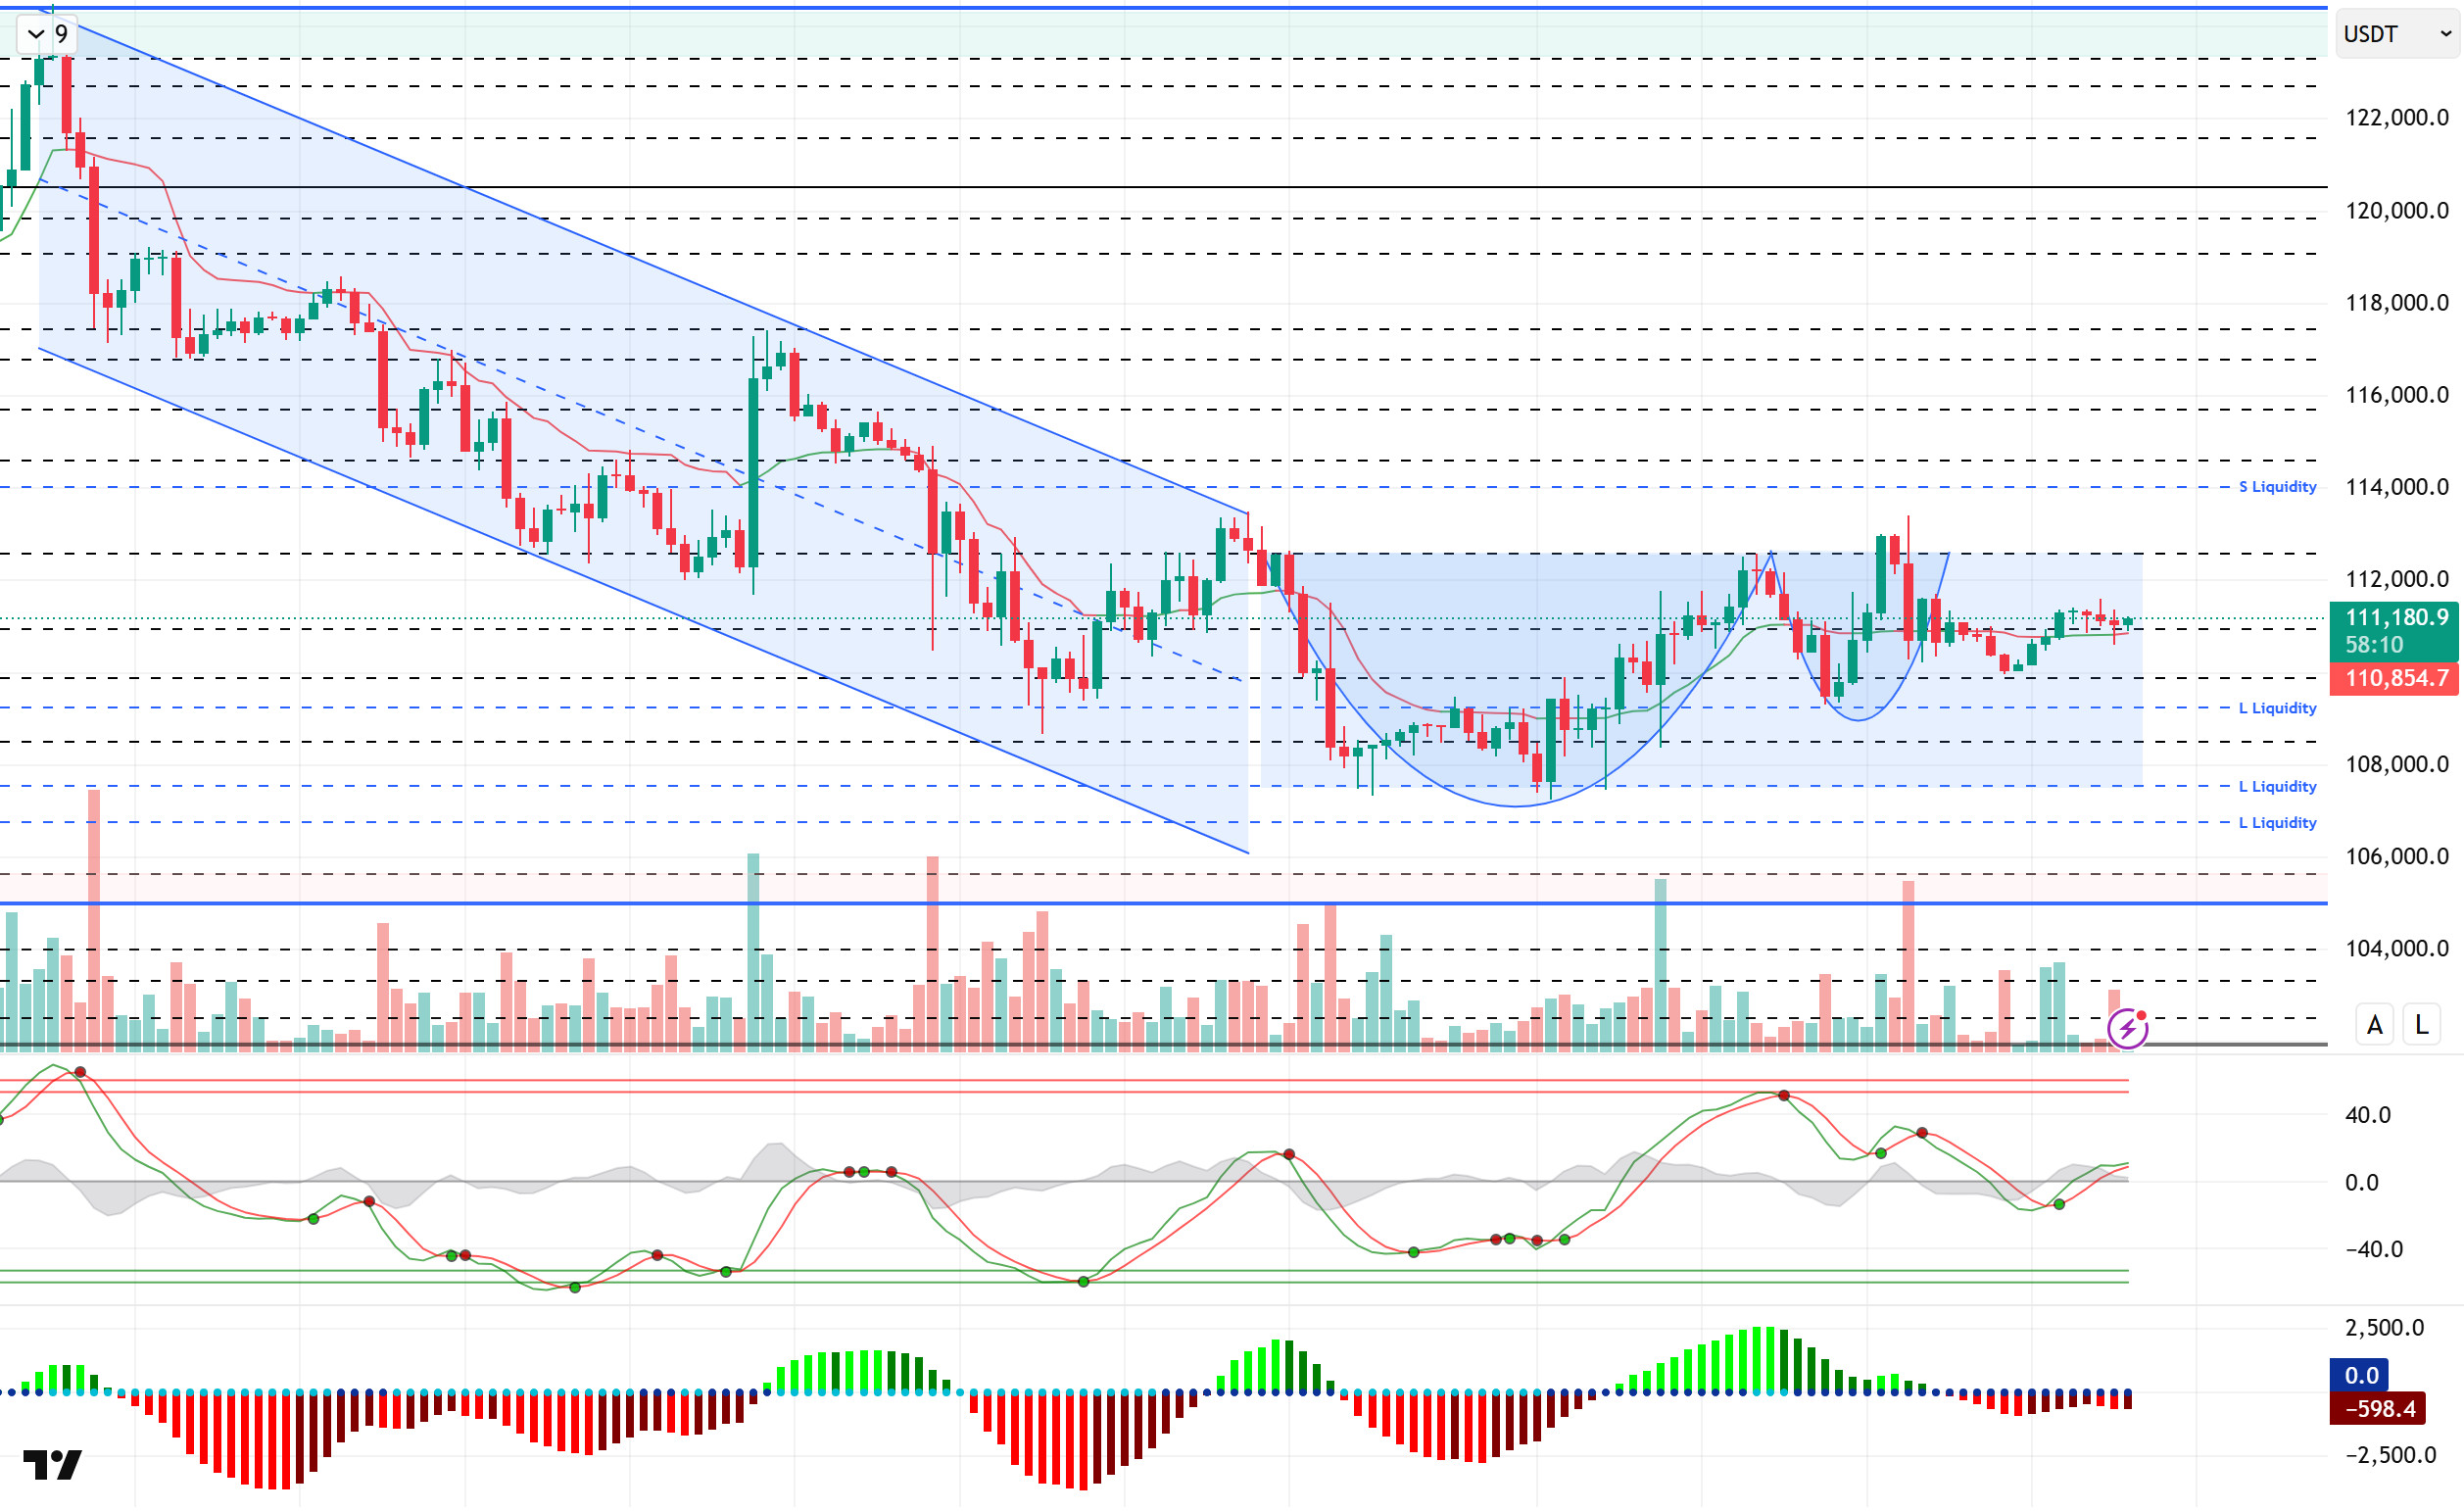
When we look at the technical outlook, it is seen that with the transformation of the falling trend structure into a horizontal trend structure, the bowl-and-handle pattern formed in BTC has been completed and invalidated by the effect of fundamental developments. BTC, which forms a minor uptrend within the horizontal band range, continues to trade at 111,000.
Technical indicators, the Wave Trend oscillator (WT) is turning upwards with a weakening buy signal at the mid-channel band, while the histogram of the Squeeze Momentum (SM) indicator is trying to regain momentum in the negative area. The Kaufman moving average is currently moving below the price at 110.750.
Looking at the liquidity data, short-term accumulating sell trades were liquidated at 112.600 -113.400, while broader timeframe sell accumulation was diluted at 114.000. While the buying tier started to accumulate at 109,000 levels in the short term, the 106,500 – 107,500 band continues to be a more intense accumulation zone.
In summary, the loss of the optimistic mood in recent days with fundamental developments, the interest rate cut discussions among Fed members, the fact that tariffs remain on the agenda with the new distribution of duties and political tensions stand out as factors that put pressure on the price. In technical terms, although the formation of a favorable ground for a new upward movement created some recovery, it was noteworthy that the rises remained in the form of liquidity purchases. Turning the rises into a trend may be possible with the reappearance of new catalysts in the market, creating a driving force on the price. In this context, 112,600 stands out as a critical reference area in the continuation of the upward movement. Exceeding this level may cause the price to gain momentum and bring a movement towards the 114,000 level. In a possible selling pressure, the 108,500 level may meet us in case of a break of 110,000.
Supports 108,500 – 107,400 – 105,000
Resistances 111,000 – 112,600 – 114,000
ETH/USDT
There was a net inflow of $788 million into Ethereum spot ETFs last week, bringing the total asset value to $27.64 billion. The Ether.fi Foundation redeemed 264,000 ETHFI tokens as part of revenue sharing, while approximately 155,000 ETHFI were burned. Token Terminal data showed that the supply of tokenized gold on the Ethereum network has doubled since the beginning of the year to $2.4 billion.
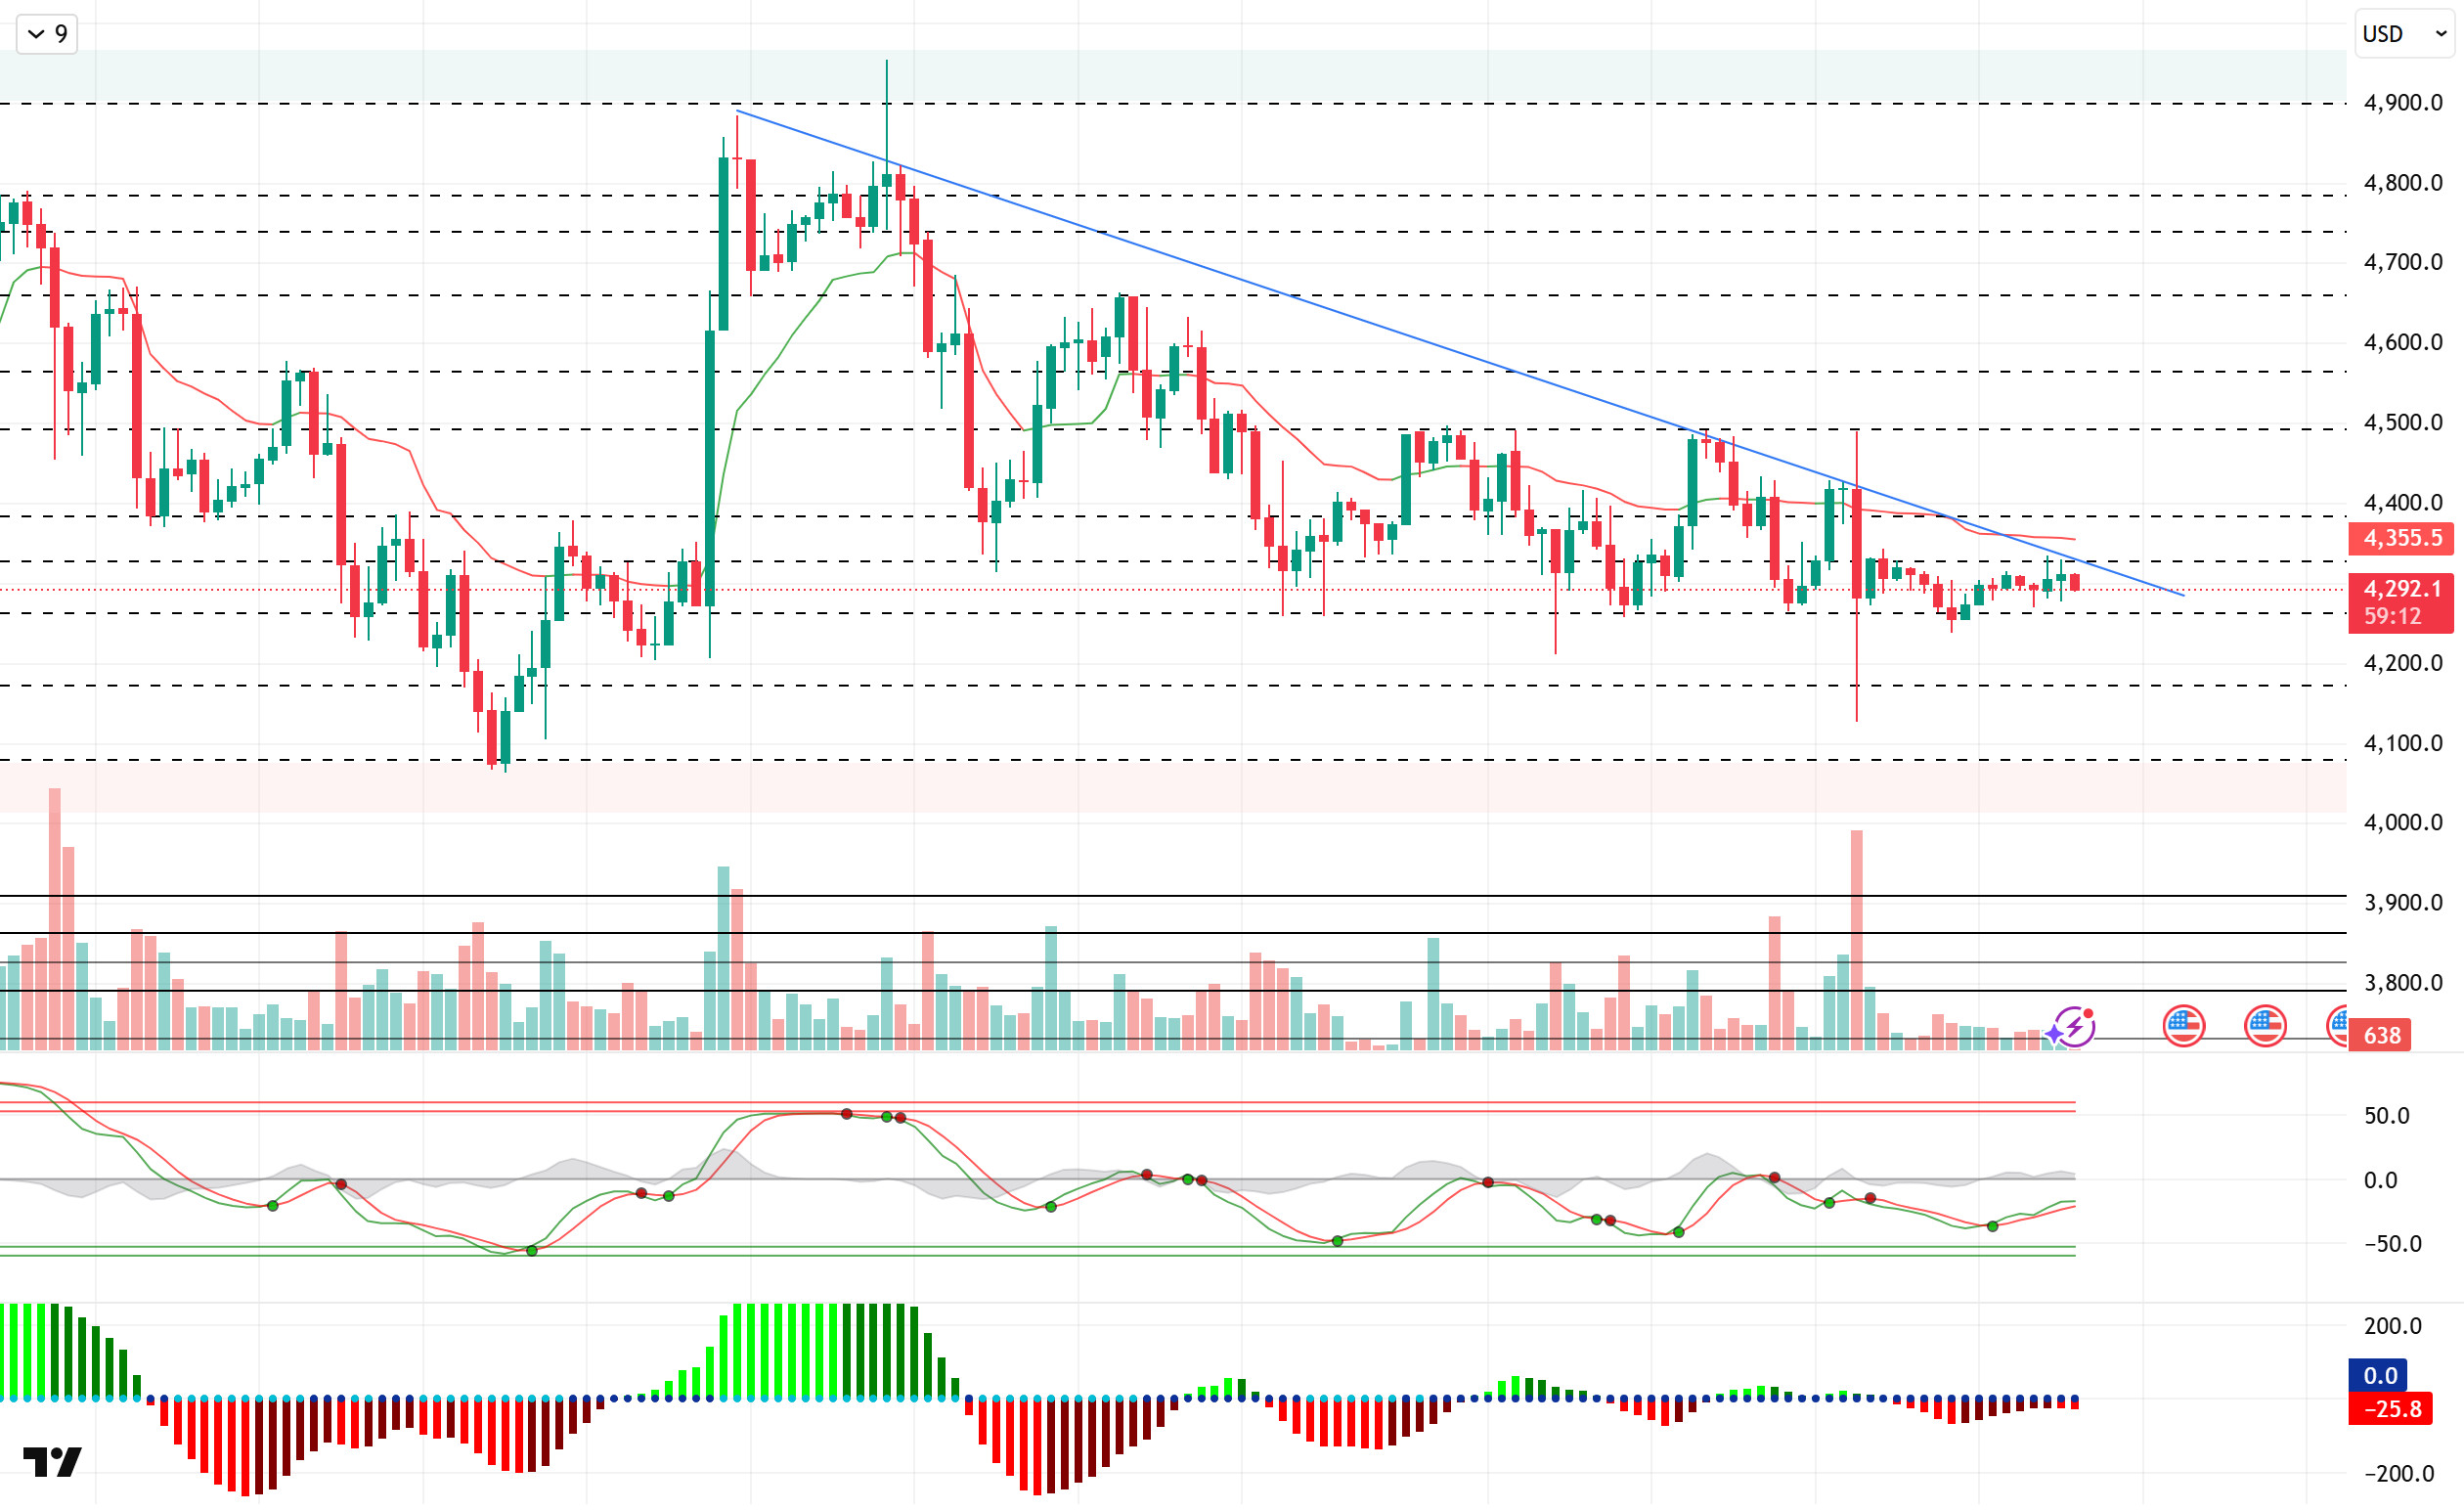
When we look at the technical outlook, the downtrend structure that started from the 4,950 level formed since August 25th continues in ETH. Last week, ETH, which shot a needle to 4,130 levels last week, stabilized again in the 4,250 – 4,330 band. At the time of writing, it continues to push the 4,300 level.
Technical indicators, the Wave Trend oscillator (WT) is once again turning upwards with a buy signal in the mid-channel band, while the histogram of the Squeeze Momentum (SM) indicator is trying to regain momentum in the positive area. The Kaufman moving average is currently moving above the price at 4.356.
Looking at the liquidity data, the short-term selling bias is concentrated at 4.355, while the buying bias continues to accumulate at 4.230 and above. On the broader timeframe, accumulation is once again concentrated at 4,200.
To summarize, ETH continues to move in line with the overall market developments. When we look at the fundamental dynamics specific to ETH, ETF inflows and institutional interest continue. On the technical side, it is noteworthy that the downtrend structure is maintained. Liquidity data also continues to determine the limits of price movements. In this context, the 4,330 level stands out as a critical threshold in terms of breaking the falling trend line. The momentum that may occur above this level may move the price to the 4,490 resistance zone. On the other hand, the 4,260 support level will be followed in possible pullbacks. If this support is broken, the downtrend structure may deepen further.
Supports 4,260 – 4,170 – 4,080
Resistances 4,330 – 4,385 – 4,490
AVAX/USDT
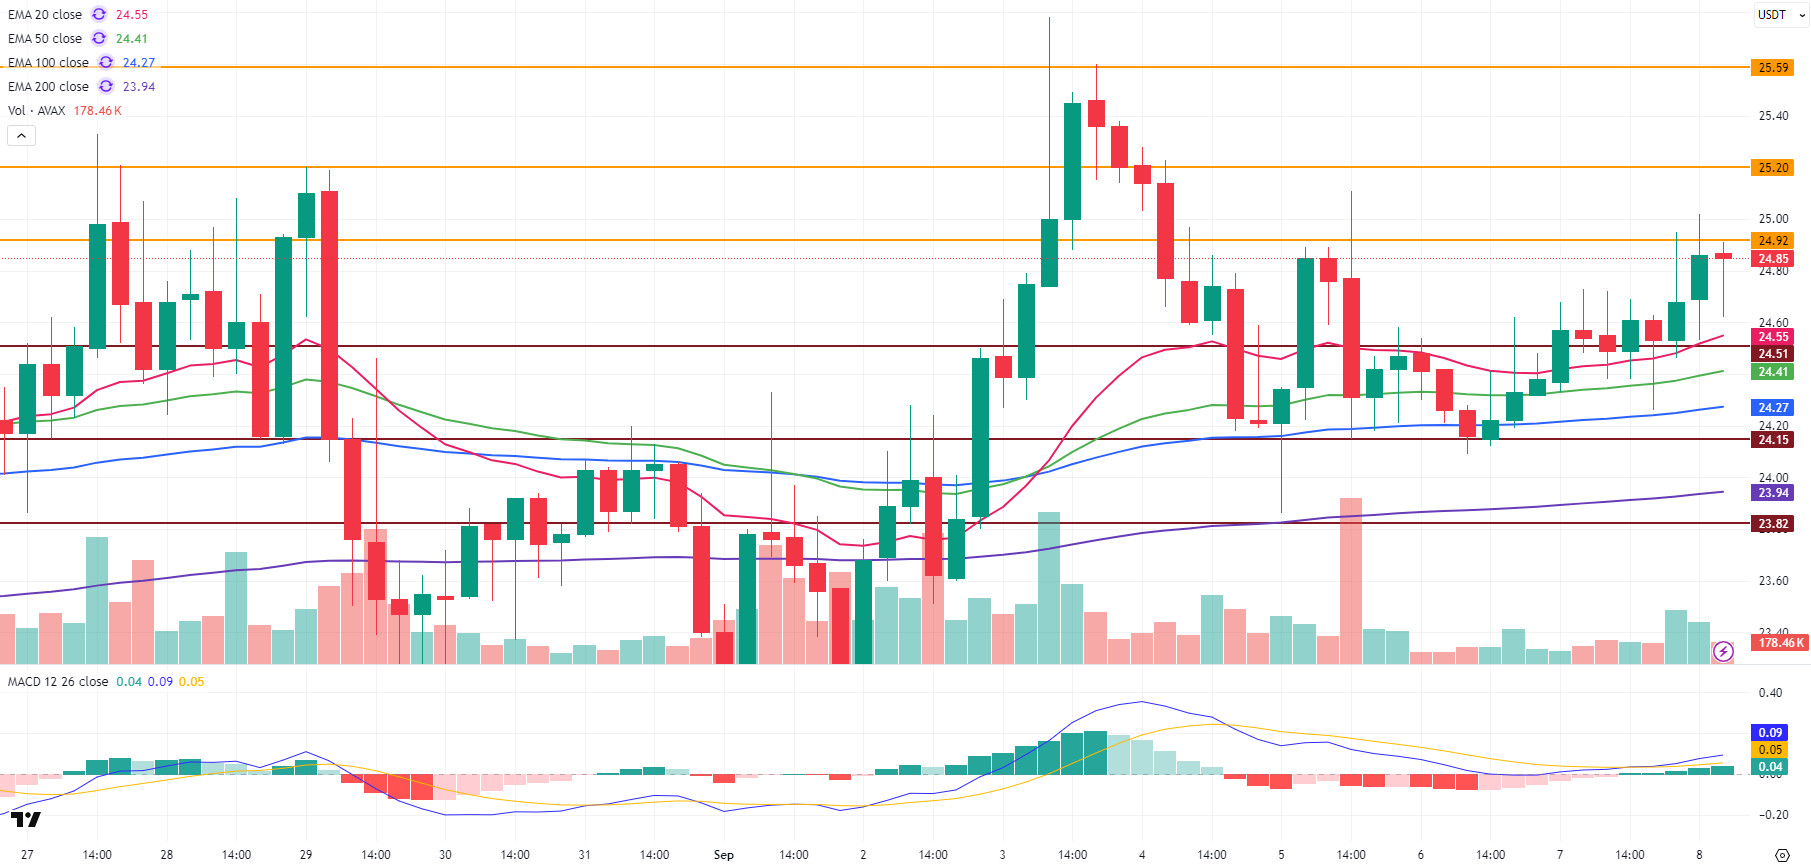
Yesterday’s positive activity in AVAX carried over to today. AVAX, which started the new day at $ 24.68, rose to over $ 25 during the day. On the ecosystem side, developments such as ETF applications and the increase in trading volume were the main factors supporting the rise. Currently, the price is hovering above the critical Exponential Moving Average (EMA) levels and the positive momentum seems to be strengthening. However, for the continuation of the uptrend, persistence above the EMA levels and strong buying with increasing volume are of great importance.
AVAX crossed the Moving Average Convergence/Divergence (MACD) line signal to the upside yesterday, which added momentum to the uptrend. The fact that the MACD continues to remain in the positive zone stands out as one of the most important factors that will support the price’s rise.
AVAX is trading above the $ 24.92 resistance level with today’s rise. Persistence above this level is important for the rise to continue. In order to ensure the persistence above the resistance level in question and the continuation of the rise, AVAX may test the resistance levels of $ 25.20 and then $ 25.59, respectively. On the contrary, if the rise gives way to a decline, the first critical region in AVAX’s decline is the EMA20 and $ 24.51 support levels. Critical EMA levels are especially important in AVAX’s decline. Selling pressure may increase in declines below these levels. In the scenario where the selling pressure increases, with the deepening of the decline in AVAX, a retreat to $ 24.15 and then to $ 23.82 support levels may occur. While the positive outlook stands out today, the resistance of $ 25.02 will be decisive for this week. In case of a decline, the support level of $ 24.51 is critical.
(EMA20: Pink Line EMA50: Green Line , EMA100: Blue Line , EMA200: Purple Line)
Supports 24.51 – 24.15 – 23.82
Resistances 24.92 – 25.20 – 25.59
SOL/USDT
Nasdaq-listed Solana treasury company DeFi Development (DFDV) announced the launch of its “.dfdv” domain name service.
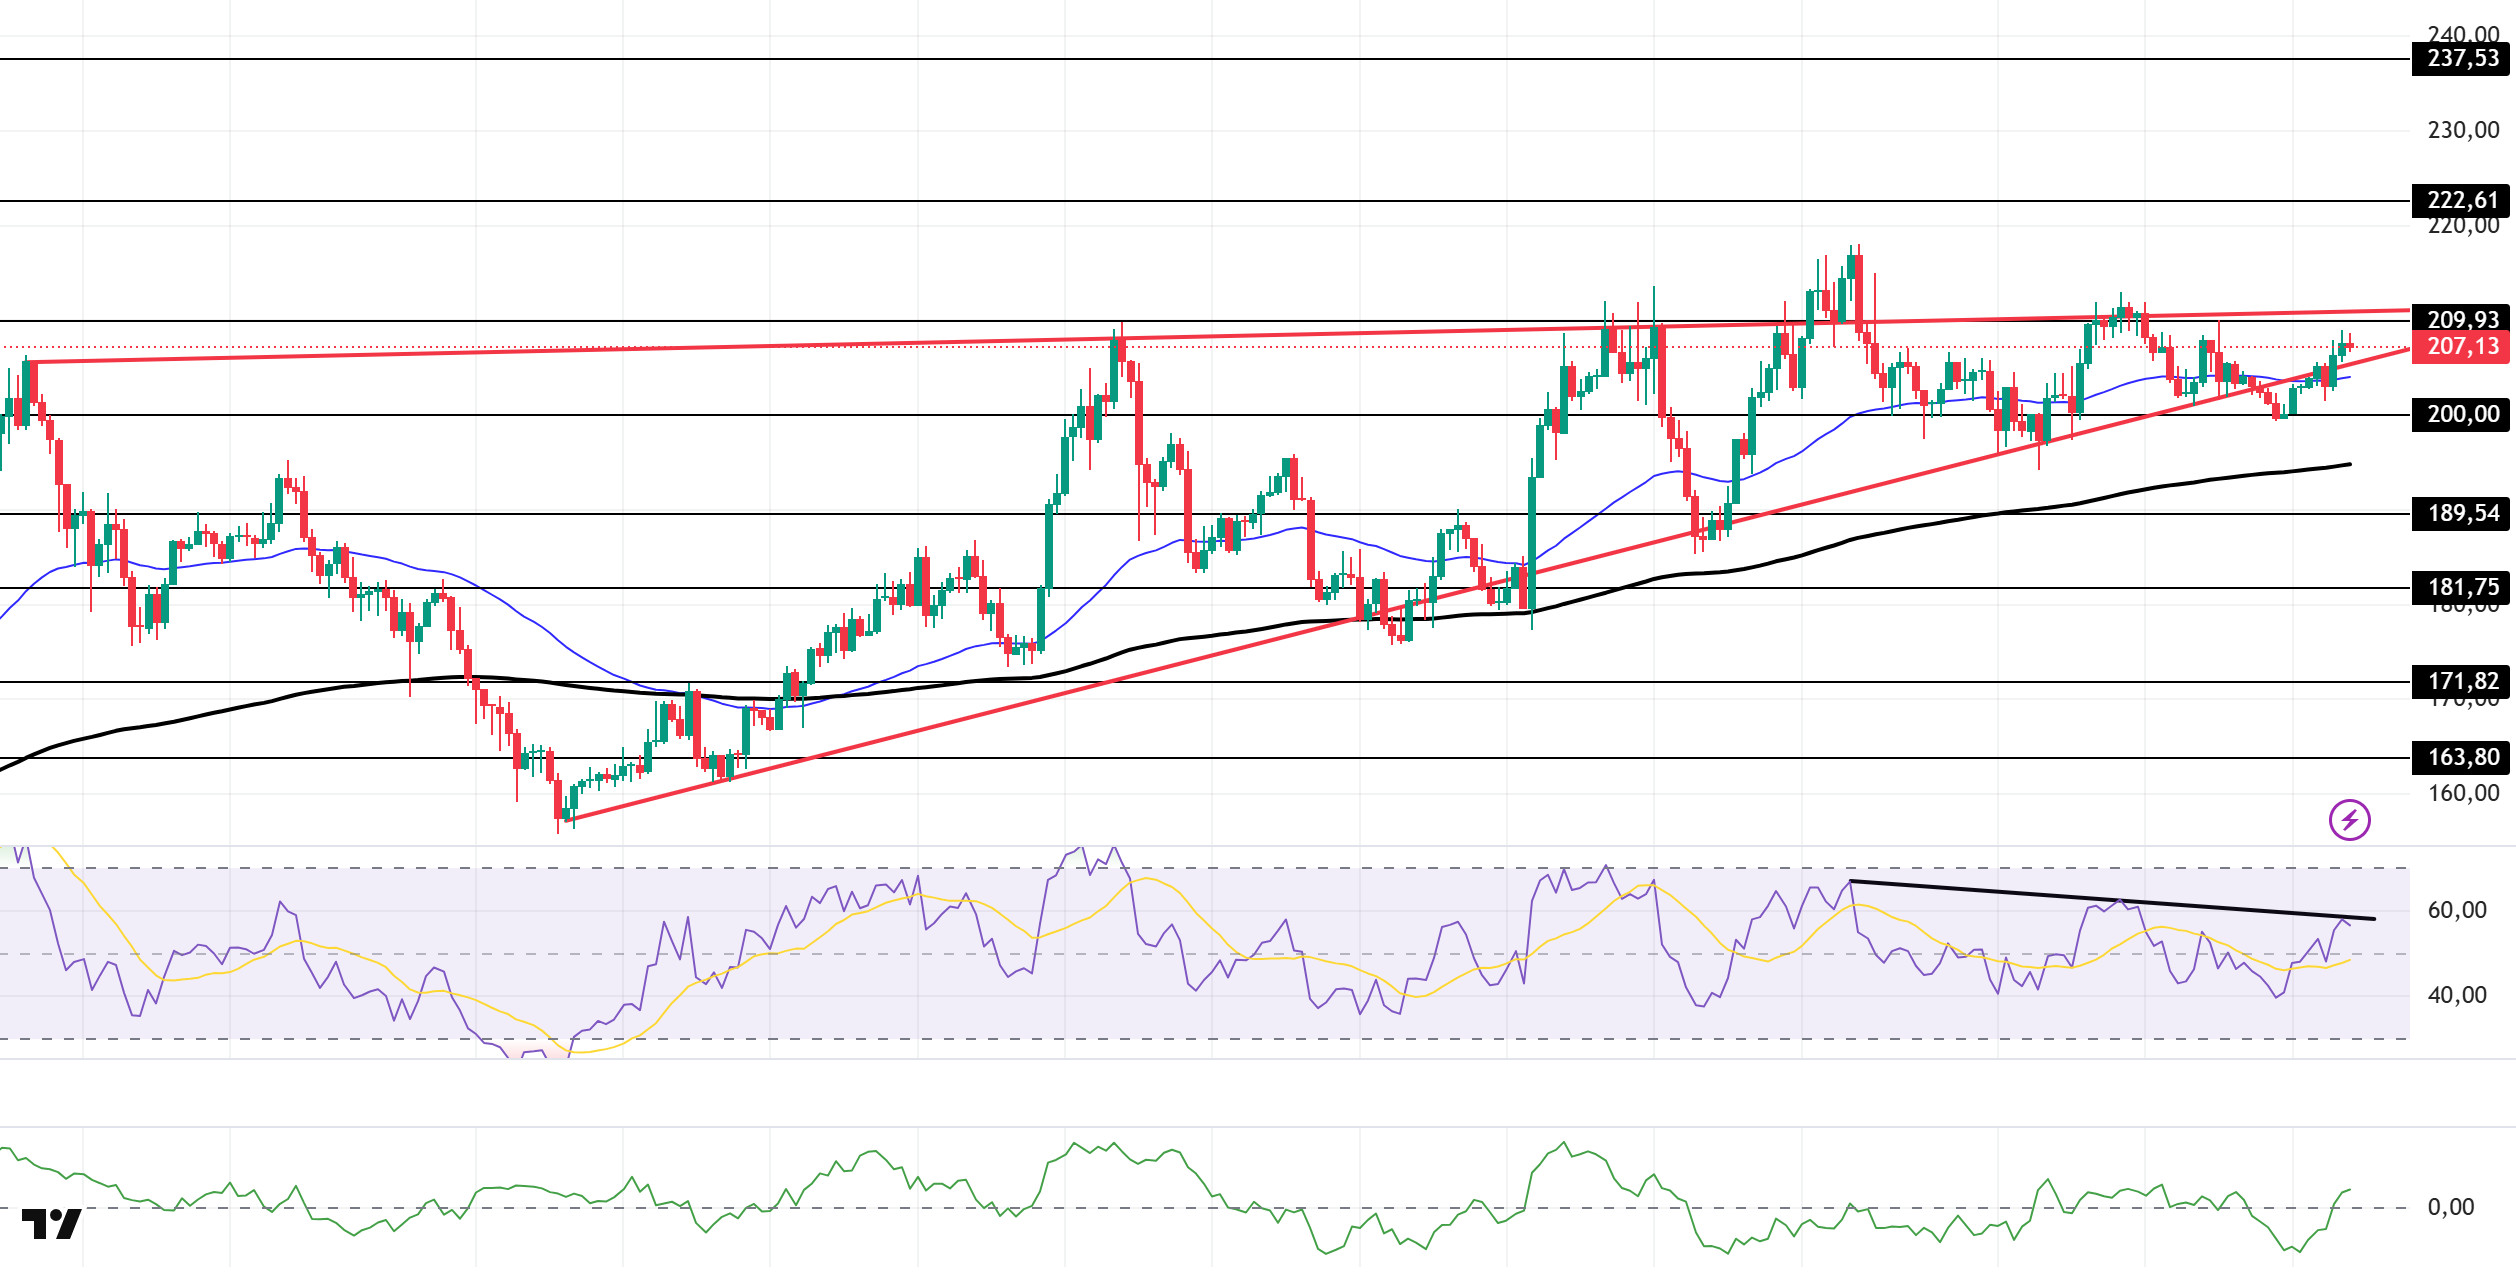
SOL price continues to appreciate in a narrow band. The asset continued to be in a rising wedge pattern that started on August 2. It rallied back from the pattern’s base level and the 50 EMA (Exponential Moving Average – Blue Line) moving average. The $ 200.00 level can be followed at candle closures below the 50 EMA. If the rise continues, the $ 209.93 level can be triggered.
On the 4-hour chart, it continued to be above the 50 EMA (Exponential Moving Average – Blue Line) and the 200 EMA (Black Line). This suggests that the upward trend may continue in the medium term. At the same time, the fact that the price is above both moving averages suggests that the market is bullish in the short term. Chaikin Money Flow (CMF-20) continued to be in positive territory. However, an increase in inflows may keep CMF above the positive zone. Relative Strength Index (RSI-14) moved into positive territory. It is also testing the ceiling level of the downtrend that started on August 29 as resistance. If it breaks this level, buying pressure may occur. In case of an uptrend driven by macroeconomic data or positive news on the Solana ecosystem, the $222.61 level stands out as a strong resistance point. If this level is broken upwards, the rise can be expected to continue. If there are pullbacks due to contrary developments or profit realizations, the $ 189.54 level can be tested. In case of a decline to these support levels, the increase in buying momentum may offer a potential bullish opportunity.
Supports 200.00 – 189.54 – 181.75
Resistances 209.93 – 222.61 – 237.53
DOGE/USDT
REX Shares and Osprey Funds have filed with US regulators to launch the first exchange-traded fund offering direct access to DOGE. Thumzup Media raised $50 million to scale 3,500 Dogecoin mining rigs. CleanCare completed a $175 million investment.
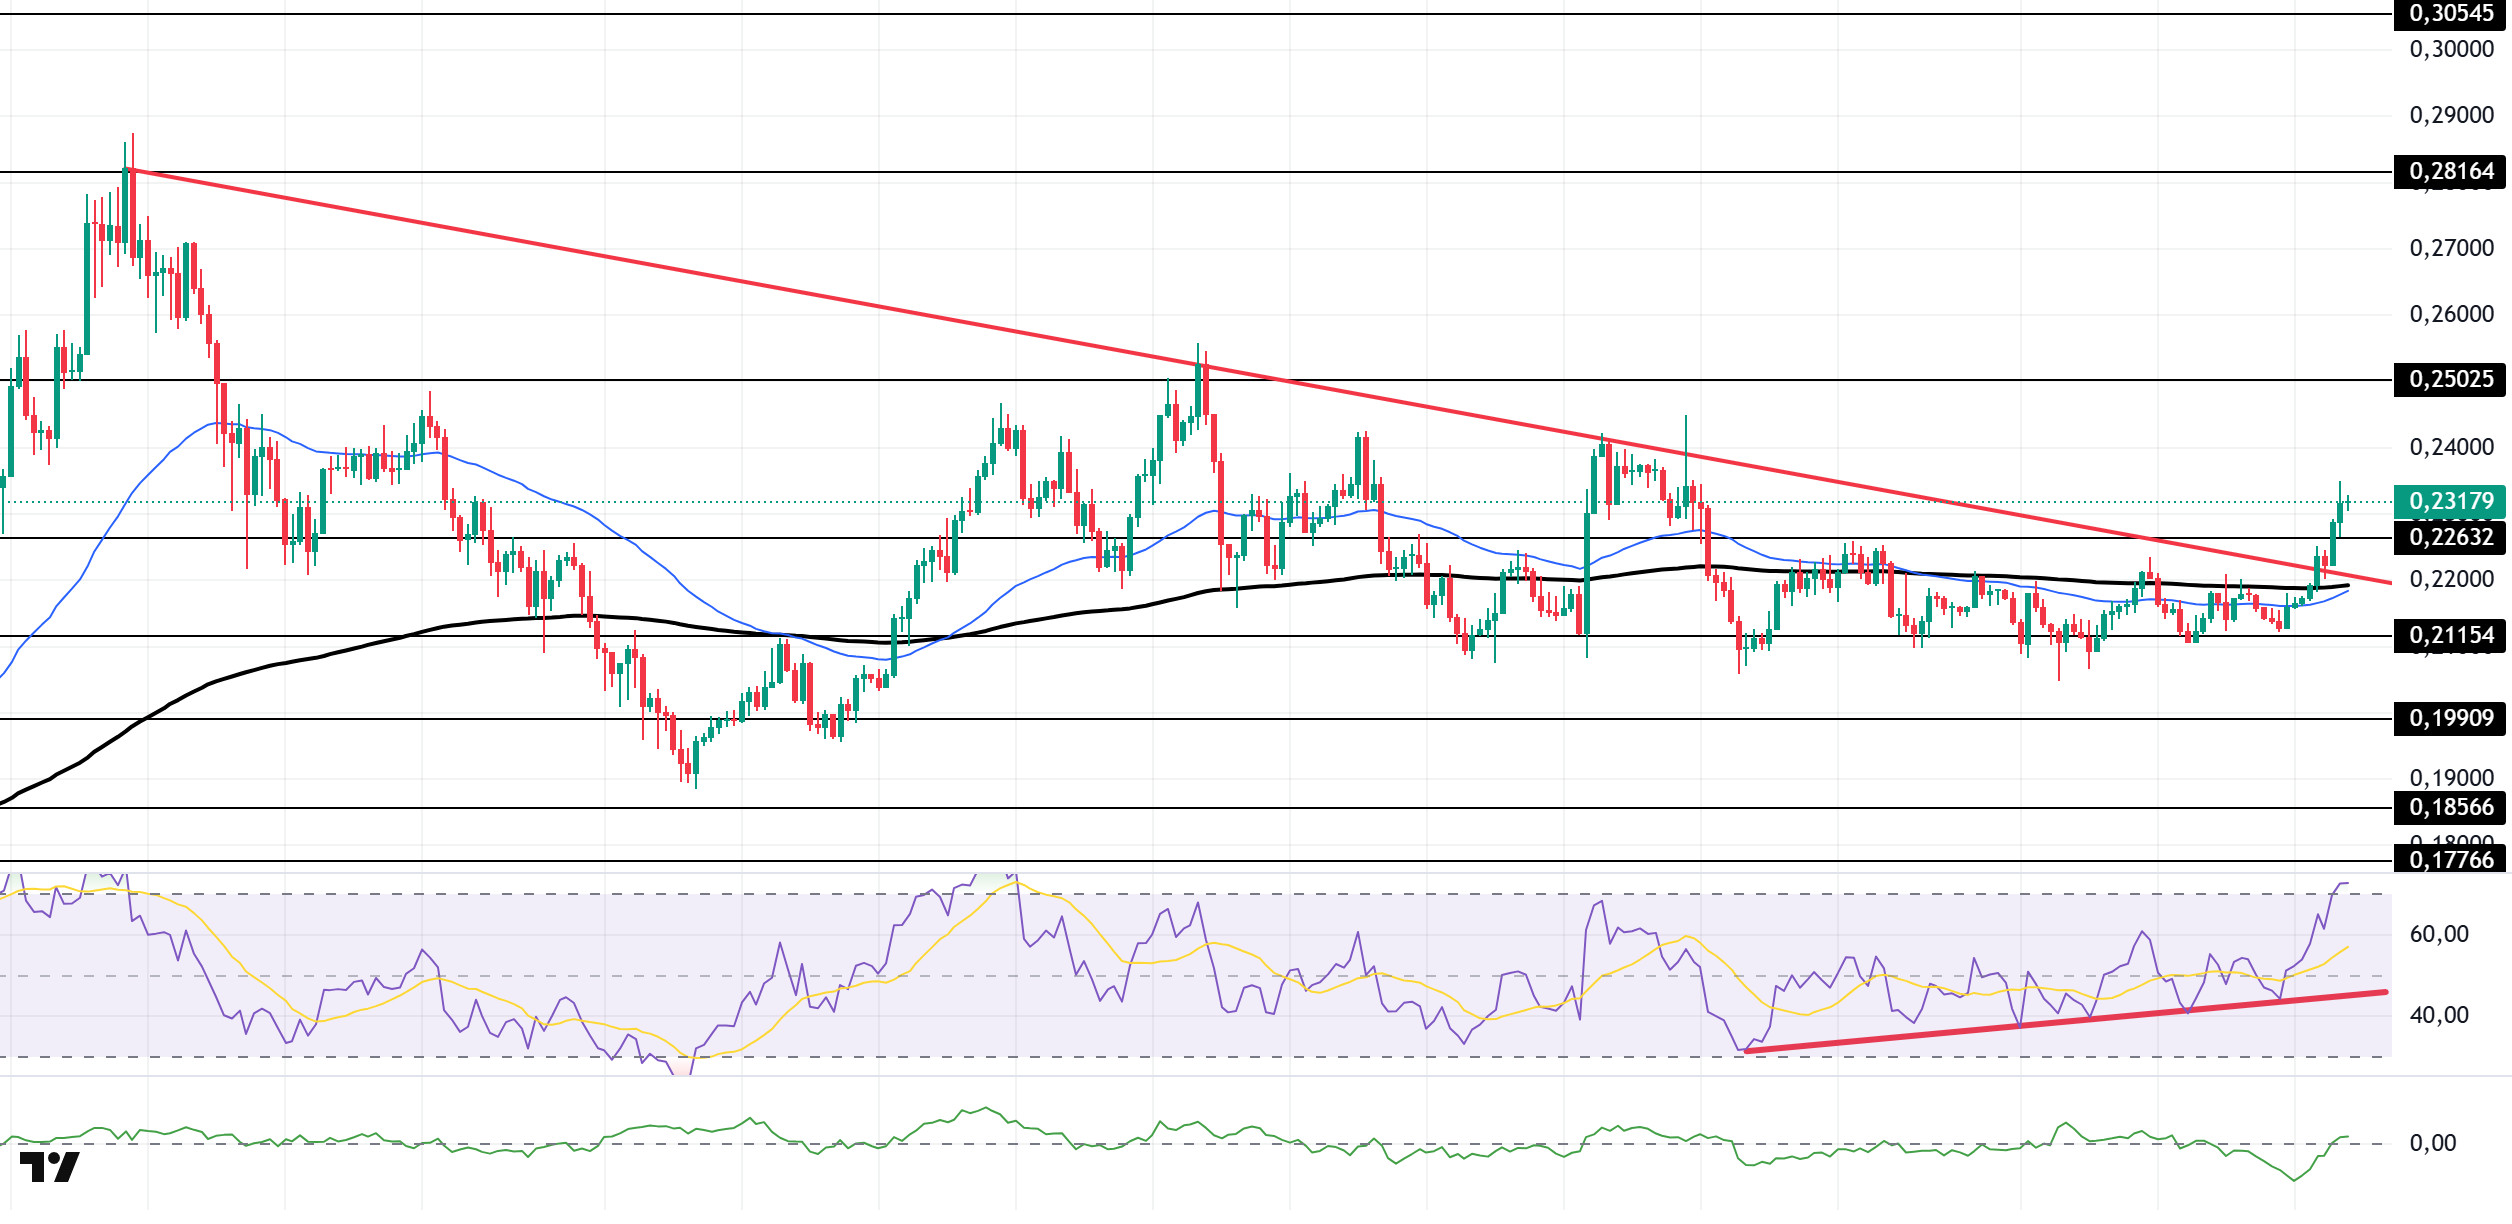
The price of DOGE was bullish. The asset broke the downtrend that started on July 21 with a strong candle. Breaking the 50 EMA (Exponential Moving Average – Blue Line) and 200 EMA (Black Line) moving averages upwards, the price should follow the $0.25025 level if it maintains its momentum and continues its rise. In case of a possible retracement, the $0.22632 level should be followed.
On the 4-hour chart, the 50 EMA (Blue Line) continued to be below the 200 EMA (Black Line). This signals the start of a downward trend in the medium term. The fact that the price is above both moving averages suggests a strong bullish bias in the short term. Chaikin Money Flow (CMF-20) moved into positive territory. In addition, an increase in inflows may push CMF to the upper levels of the positive zone. Relative Strength Index (RSI-14) rose to the overbought zone. This may bring profit sales. At the same time, it continues to be in the upper zone of the uptrend that started on August 26. The $0.25025 level stands out as a strong resistance zone in case of a possible rise in line with political developments, macroeconomic data or positive news flow in the DOGE ecosystem. In the opposite case or possible negative news flow, the $0.22632 level may be triggered. In case of a decline to these levels, the momentum may increase and a new bullish wave may start.
Supports 0.22632 – 0.21154 – 0.19909
Resistances 0.25025 – 0.28164 – 0.30545
BNB/USDT
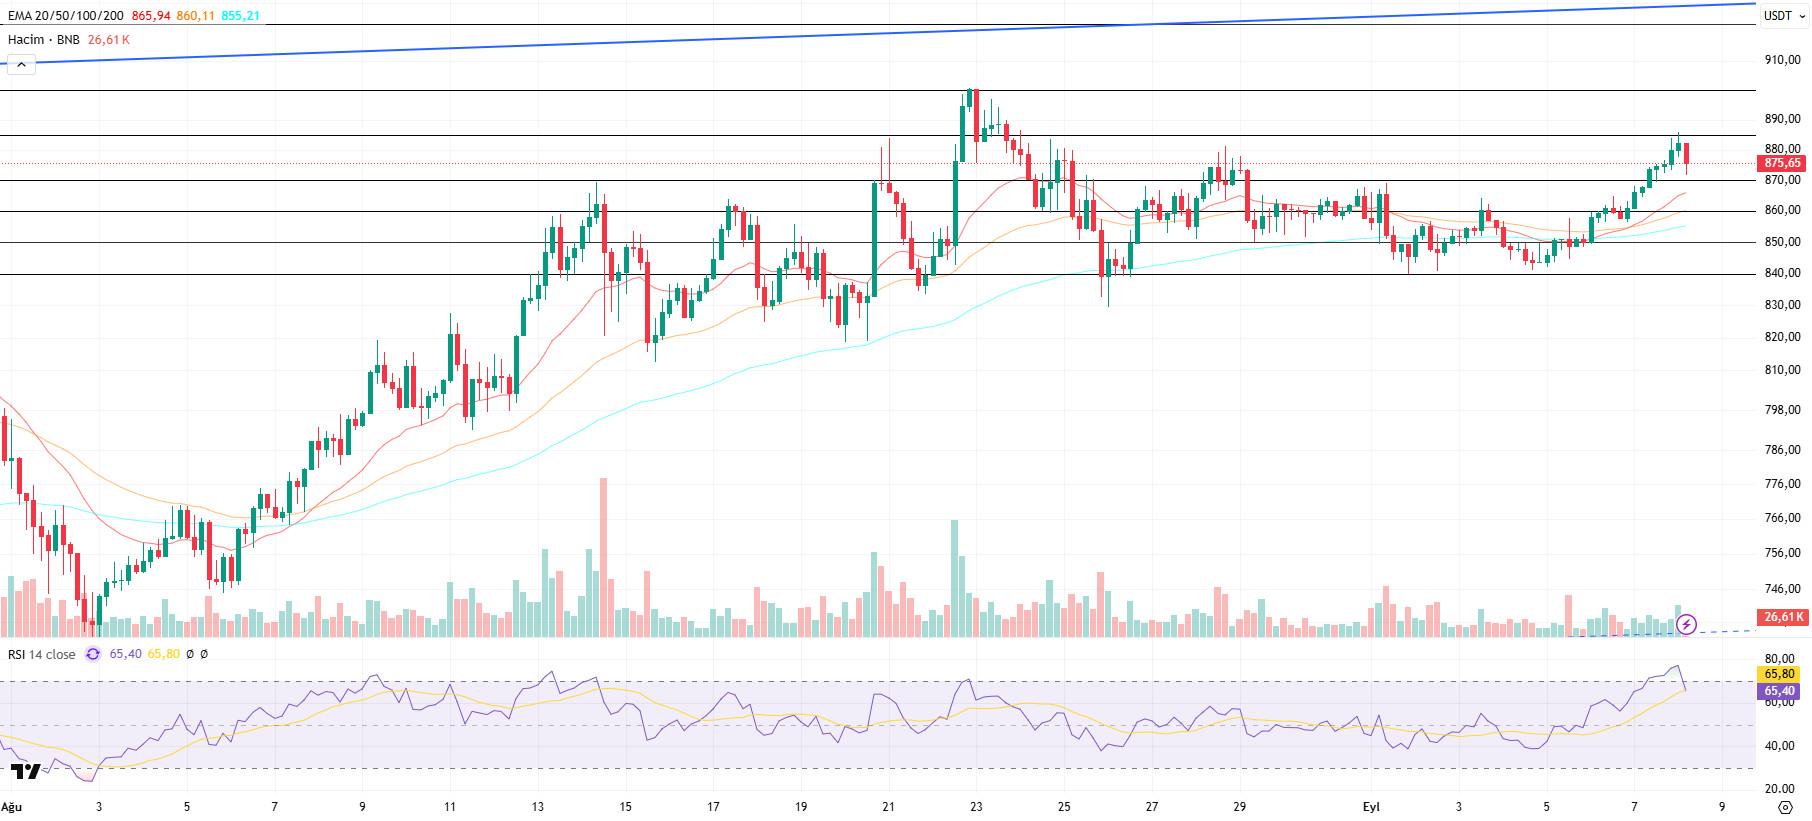
From a technical point of view, BNB/USDT continued its downward trend to the $840 level with the selling pressure it saw from the $900 peak level in the four-hour period. Finding support three times from this level, BNB regained positive momentum up to $885. Thus, the asset displayed a horizontal outlook between the $ 840-885 levels. However, with the start of the new day, it saw selling pressure below this level and made a negative start.
Technical indicators for BNB/USDT, which is currently trading in the range of $870-885, show that a weak trend in trading volume has recently come to the fore. This picture indicates that the market has entered the decision phase. On the other hand, although the Relative Strength Index (RSI) rose above the 70 level, it declined with selling pressure on the new day and turned its direction down. This technical structure indicates that negative trends may continue in the short term.
Within the framework of the current technical outlook, if the negative momentum continues, the BNB price is expected to test the $ 870 support level in the first place. In case this level is broken downwards, the $ 860 and $ 850 levels stand out as critical support zones to follow, respectively. On the other hand, if the $ 870 support is maintained and the buying appetite increases, the price is likely to head towards the $ 885 resistance level again. If this resistance is exceeded, the $ 900 and $ 920 levels, respectively, gain importance as strong resistance points to be followed.
Supports 870 – 860 – 850
Resistances 885 – 900 – 920
ADA/USDT
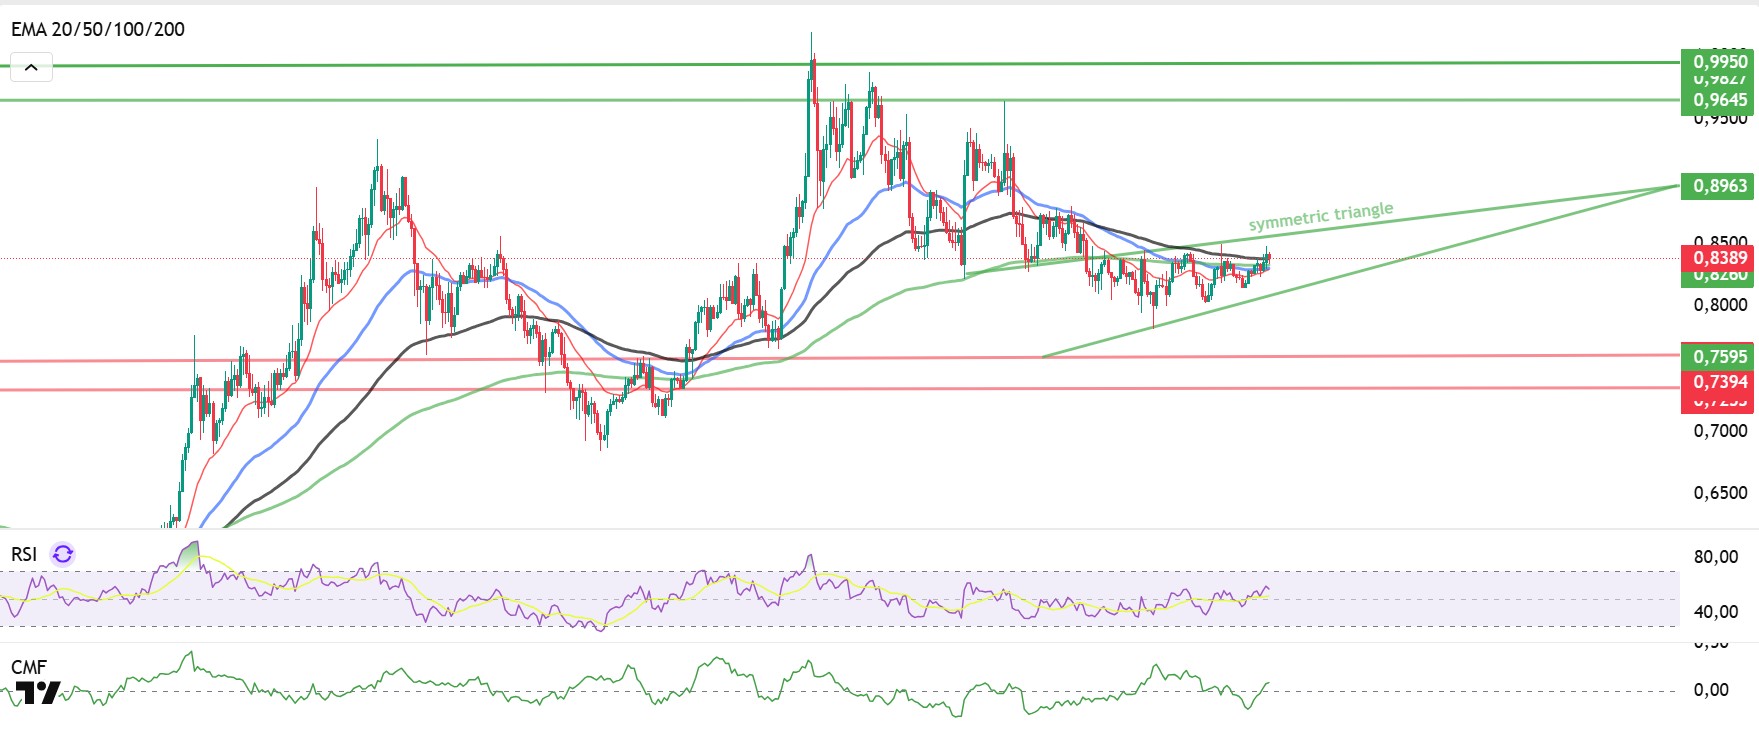
Macroeconomic data in cryptocurrencies were effective in the return of the ADA price from the downtrend to the rising symmetrical triangle pattern. In the employment data for August, the ADP increase remained below expectations with 54 thousand, while unemployment claims rose to 237 thousand and ongoing applications approached 1.94 million. US Non-Farm Payrolls data was announced as 22K. This weakness strengthened pricing for a 25 basis point Fed rate cut in September. In the light of this data, prices rose and ADA’s trading volume amounted to 888 million dollars in market volume. Looking at the liquidity data, trades at 0.8294, the level at which short-term accumulation was recorded, were liquidated. Accumulation in the wider time frame continues at 0.8556. While the buying tier started to accumulate at 0.8439 levels in the short term, the 0.8532- 0.8525 band continues to be a more intense accumulation zone.
When we look technically, ADA, which closed above 0.8350 at the close of the week, maintains the strength of the buyers by providing permanence on the 50 (EMA-Red Line) and 100-day (EMA-Blue Line) Exponential Moving. If it persists above 0.8952, the top of the symmetrical triangle pattern on the chart, it may complete the symmetrical triangle pattern and test the first resistance zone of 0.9645. The support point at 0.7612, the bottom of the pattern, is the selling level that we will follow in the first sellers’ course. Relative Strength Index (RSI) rose to 59, signaling a buy zone, while Chaikin Money Flow (CMF-20) rose to 0.12, signaling a buy signal. The rise in money inflows may keep CMF in positive territory and may show a buying effect. In case of macroeconomic data to be announced this week or positive news about the Cardano ecosystem, the $ 0.9645 level may appear as our strong resistance point. If the decline starts, the 0.7610 level is the important support level that we will follow.
Supports 0.7610 – 0.7397 – 0.7137
Resistances 0.9645- 0.9950 – 1.0189
Legal Notice
The investment information, comments, and recommendations contained herein do not constitute investment advice. Investment advisory services are provided individually by authorized institutions taking into account the risk and return preferences of individuals. The comments and recommendations contained herein are of a general nature. These recommendations may not be suitable for your financial situation and risk and return preferences. Therefore, making an investment decision based solely on the information contained herein may not produce results in line with your expectations.

