
Technical Analysis
BTC/USDT
As hawkish statements from Fed members continue, the probability of a rate cut in December has weakened, falling to around 43%. On the White House front, Trump took a new step in the fight against inflation by removing tariffs on over 100 agricultural products; Treasury Secretary Bessent emphasized that $2,000 rebate checks are “possible but not guaranteed.” Meanwhile, tensions between Japan and China over Taiwan escalated rapidly, with harsh statements from both sides and China’s live-fire drills negatively impacting regional risk appetite.
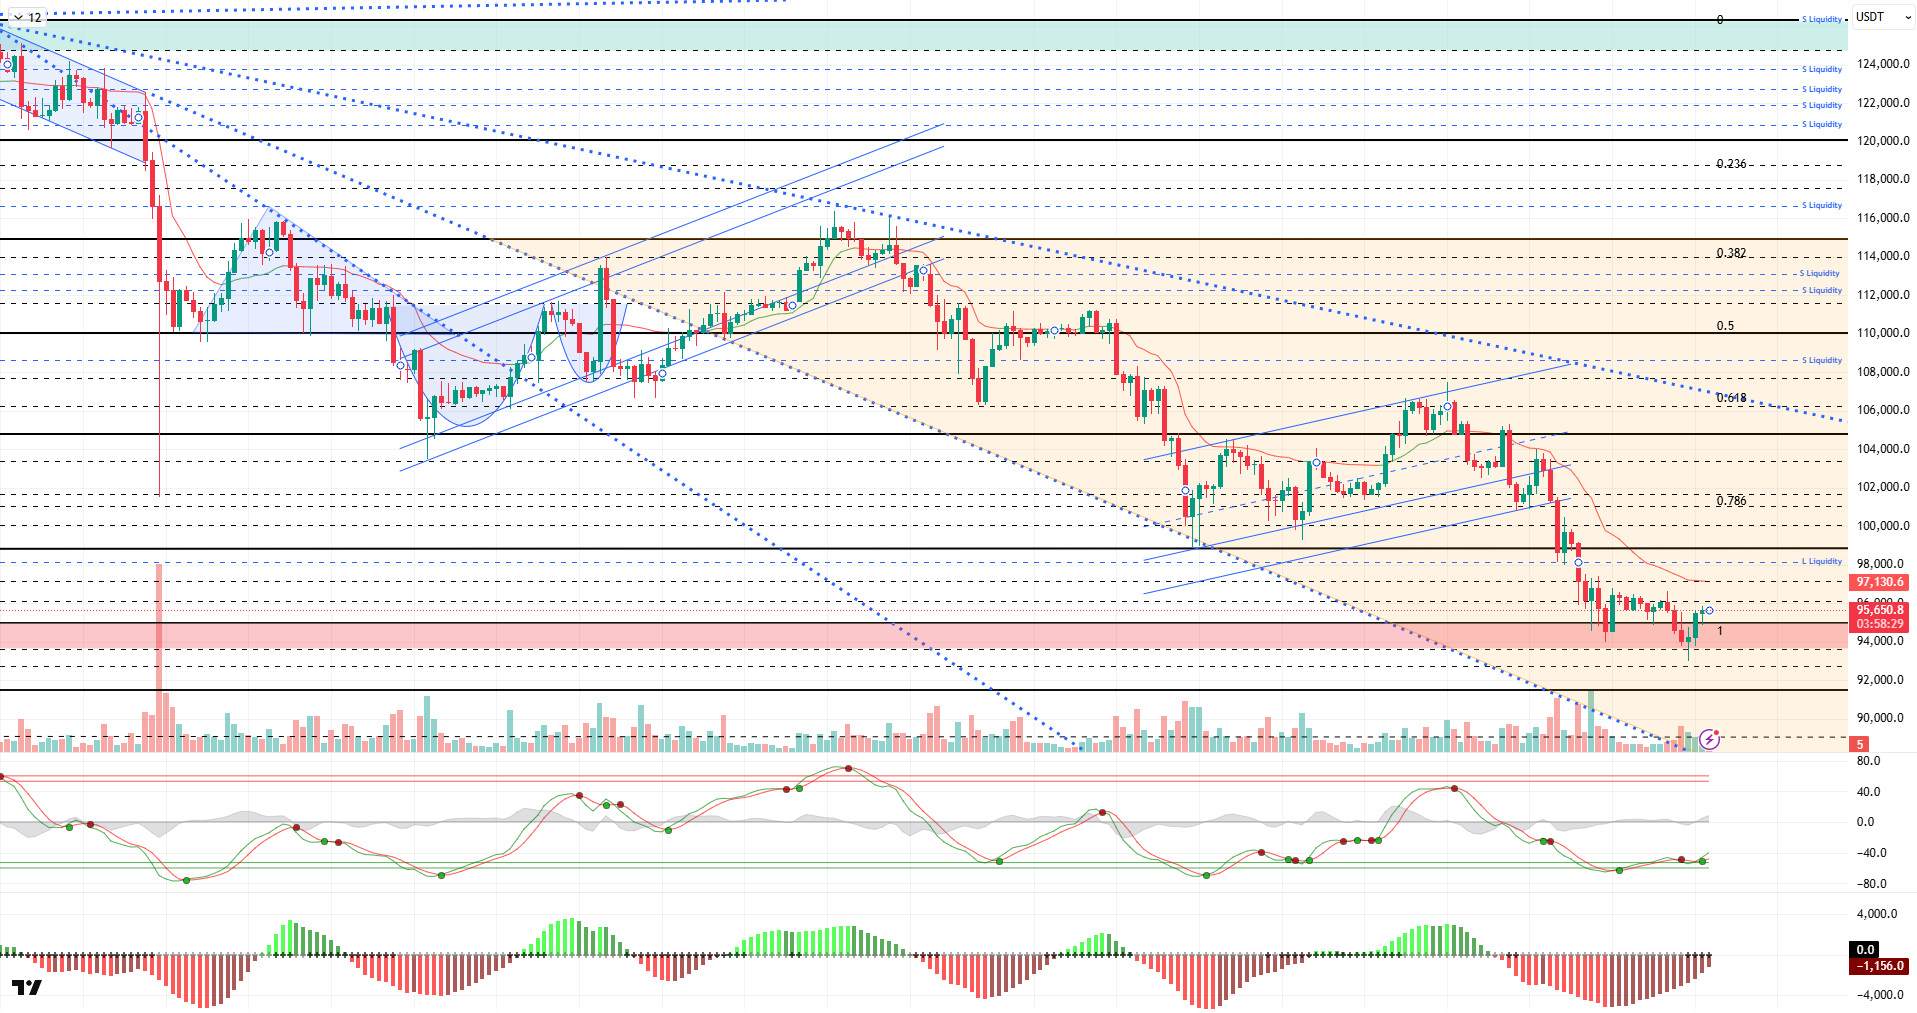
From a technical perspective, BTC faced selling pressure at times over the weekend, falling to around 93,000. The price, which reacted quickly from this level, managed to break through the 95,000 resistance again. The price, which continues to deepen the downward trend it started from the ATH level, is likely to see only reactionary rises, and uncertainty continues.
Technical indicators reflect indecision, with the Wave Trend (WT) oscillator generating a buy signal in the oversold zone, while the Momentum (SM) indicator’s histogram attempts to gain strength after reaching maximum weakness in the negative zone. The Kaufman Moving Average (KAMA) is currently at $97,150, positioned above the price.
According to liquidation data, the recent decline has largely cleared out the buying tiers, while the weight of the selling tiers continues. Selling intensity is accumulating within the 97,000–98,000 band, while weakness persists in the buying tier.
In summary, with the reopening of the US government, most federal agencies have recalled their staff and begun gradually resuming operations. However, hawkish statements from Fed members continue to dampen expectations of interest rate cuts. On the technical side, the price continues to struggle to hold above the 95,000 reference zone. Closings above this level are critical for regaining momentum; if momentum strengthens, the 97,200 resistance level will be monitored. On the other hand, if selling pressure increases and the 95,000 support level is broken, the 93,700 level may come back into focus.
Supports: 95,000 – 93,700 – 91,400
Resistances 97,200 – 98,000 – 99,100
ETH/USDT
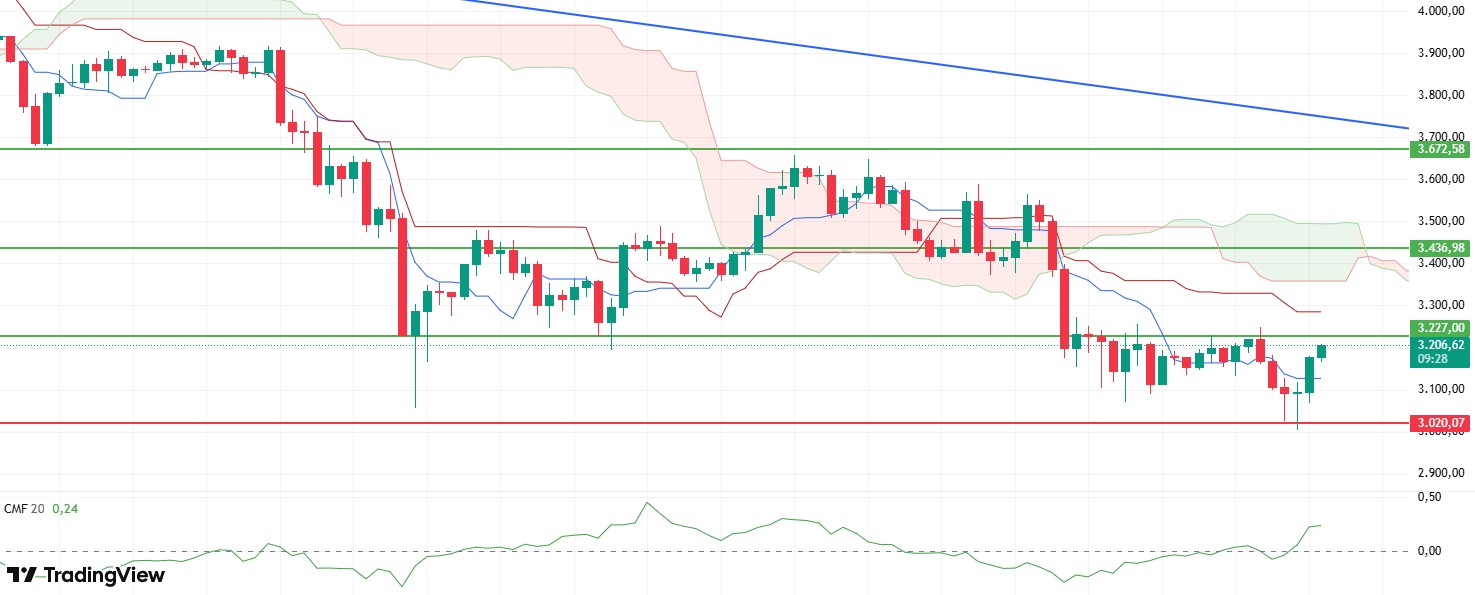
ETH continued to retreat after hitting resistance at $3,230 over the weekend, falling back to the support zone at $3,200. After the weekly close, buying from this zone pushed the price back up to the $3,200 level. The short-term rebound indicates that selling pressure has not completely disappeared, but buyers have begun to enter the market in a meaningful way for the first time.
The Chaikin Money Flow (CMF) indicator’s sharp rise into positive territory after a long hiatus is noteworthy. This increase in liquidity inflows stands out as one of the key factors supporting the price recovery. This strengthening on the buyer side indicates that confidence has returned to the market following the recent declines.
The Relative Strength Index (RSI) rising to 46 without showing negative divergence signals that momentum recovery has begun. As seller pressure weakens, the groundwork is being laid for the price to make upward moves.
In the Ichimoku indicator, the price breaking above the Tenkan level stands out as a factor supporting a positive outlook in the short term. However, the price still trading below the Kijun and Kumo cloud indicates that the trend structure has not completely changed and risks persist in the medium term. This structure suggests that upward attempts may remain limited, but short-term rallies could continue.
During the day, the price is expected to test the $3,230 resistance level, and if this level is broken, the upward movement could continue to the lower band of the $3,355 cloud. This area stands out as a strong technical target. However, if the price fails to break through the $3,230 resistance level, it may weaken again and the movement may revert to a pullback towards the $3,020 support level. Although buyers are gaining strength, indicators suggest that the trend reversal is not yet complete, so price movements should be monitored cautiously.
Below the Form
Supports: 3,020 – 2,760 – 2,550
Resistances: 3,227 – 3,436 – 3,672
XRP/USDT
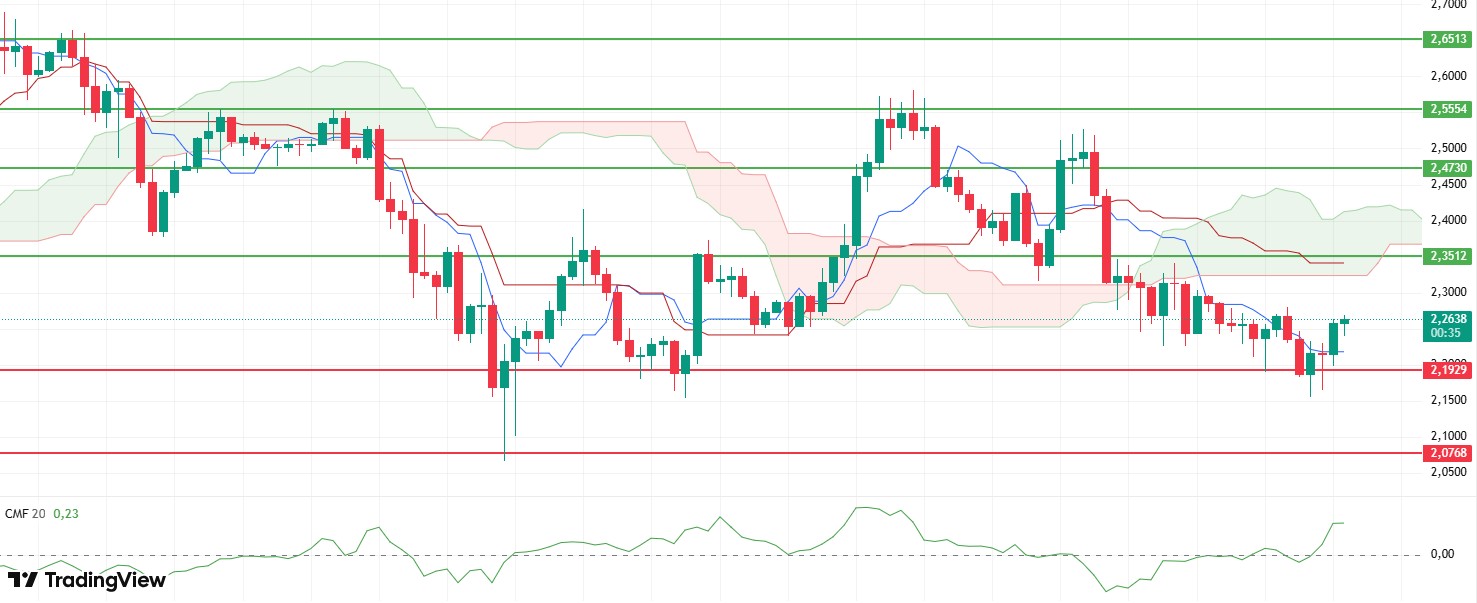
The XRP price gradually retreated over the weekend, falling below the $2.19 support level. Buying activity in the morning restored this level, and the price is currently attempting to hold steady around $2.27. Although weak, the entry of reactionary buying indicates a desire for a short-term recovery.
The Chaikin Money Flow (CMF) indicator has sharply risen back into positive territory after a long period, which is noteworthy. The significant increase in liquidity inflows indicates that buyers have entered the market in a meaningful way for the first time and are supporting the upward price movement.
The Relative Strength Index (RSI) indicator also moving into positive territory signals the beginning of strengthening momentum. The weakening of seller pressure stands out as an important factor supporting the price’s upward attempts.
Although the XRP price is generating short-term recovery signals on the Ichimoku indicator, the technical structure is not fully strengthened. The price is forming a positive outlook by gaining the Tenkan level in the short term, but remaining below the Kijun and kumo cloud indicates that the medium-term trend has not yet turned positive. Remaining below the cloud suggests that upward movements may be limited, but short-term corrective movements could continue.
If the price maintains its recovery momentum during the day, the upward movement is expected to continue up to the $2.35 resistance level. Breaking above this level will be crucial for the upward movement to gain strength. The $2.19 level should be monitored as a critical support point. Closings below this support could lead to a renewed strengthening of the weak trend.
Supports: 2.1929 – 2.0768 – 1.9092
Resistances: 2.3512 – 2.4730 – 2.5554
SOL/USDT
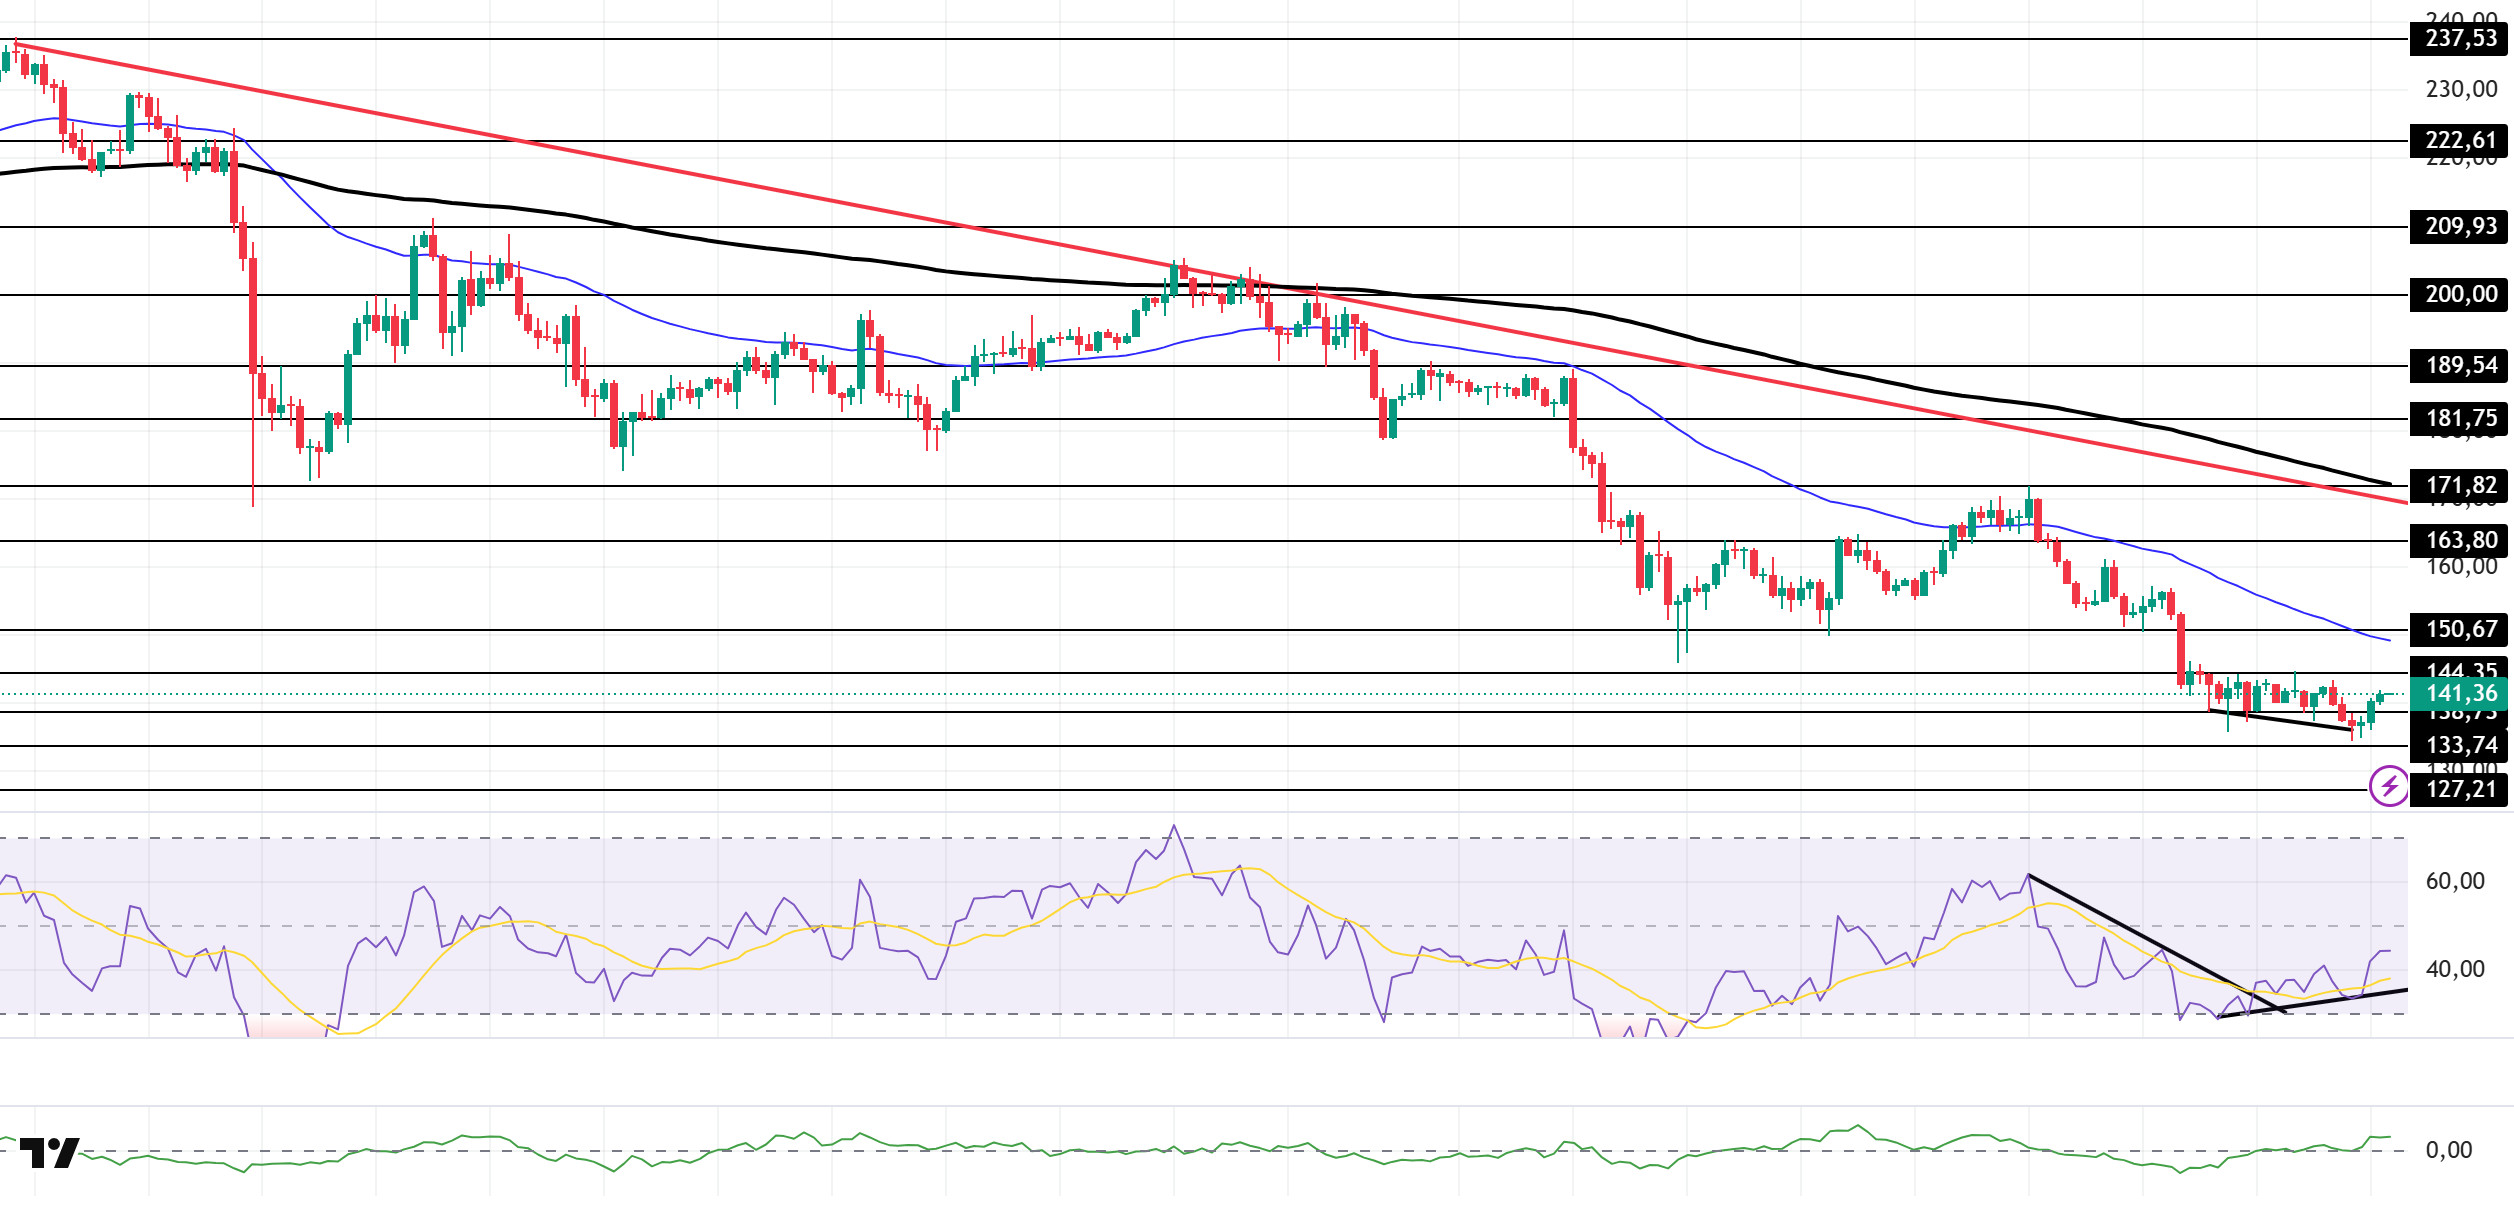
The SOL price deepened its decline. The asset remained in the lower region of the downward trend that began on October 6. It also continued its decline, encountering resistance at the strong resistance level of $144.35. As of now, the price has broken above the strong resistance level of $138.73. If the uptrend continues, it may test the 50 EMA (Blue Line) moving average. In the event of a pullback, the $127.21 level could act as support.
The price remained below the 50 EMA (Exponential Moving Average – Blue Line) and 200 EMA (Black Line) on the 4-hour chart. This indicates a potential downtrend in the medium term. Additionally, the price being below both moving averages suggests a downward trend in the short term. The Chaikin Money Flow (CMF-20) moved into positive territory. However, an increase in money inflows could push the CMF to the upper levels of the positive zone. The Relative Strength Index (RSI-14) rose to the middle level of the negative zone. At the same time, it broke above the downward trend that began on November 11. These indicate increased buying pressure. There is also a bullish divergence. If there is an uptrend due to macroeconomic data or positive news related to the Solana ecosystem, the $150.67 level stands out as a strong resistance point. If this level is broken upwards, the rise is expected to continue. If there are pullbacks due to developments in the opposite direction or profit-taking, the $127.21 level could be tested. A decline to these support levels could increase buying momentum, presenting a potential upside opportunity.
Supports: 138.73 – 133.74 – 127.21
Resistances: 144.35 – 150.67 – 163.80
DOGE/USDT
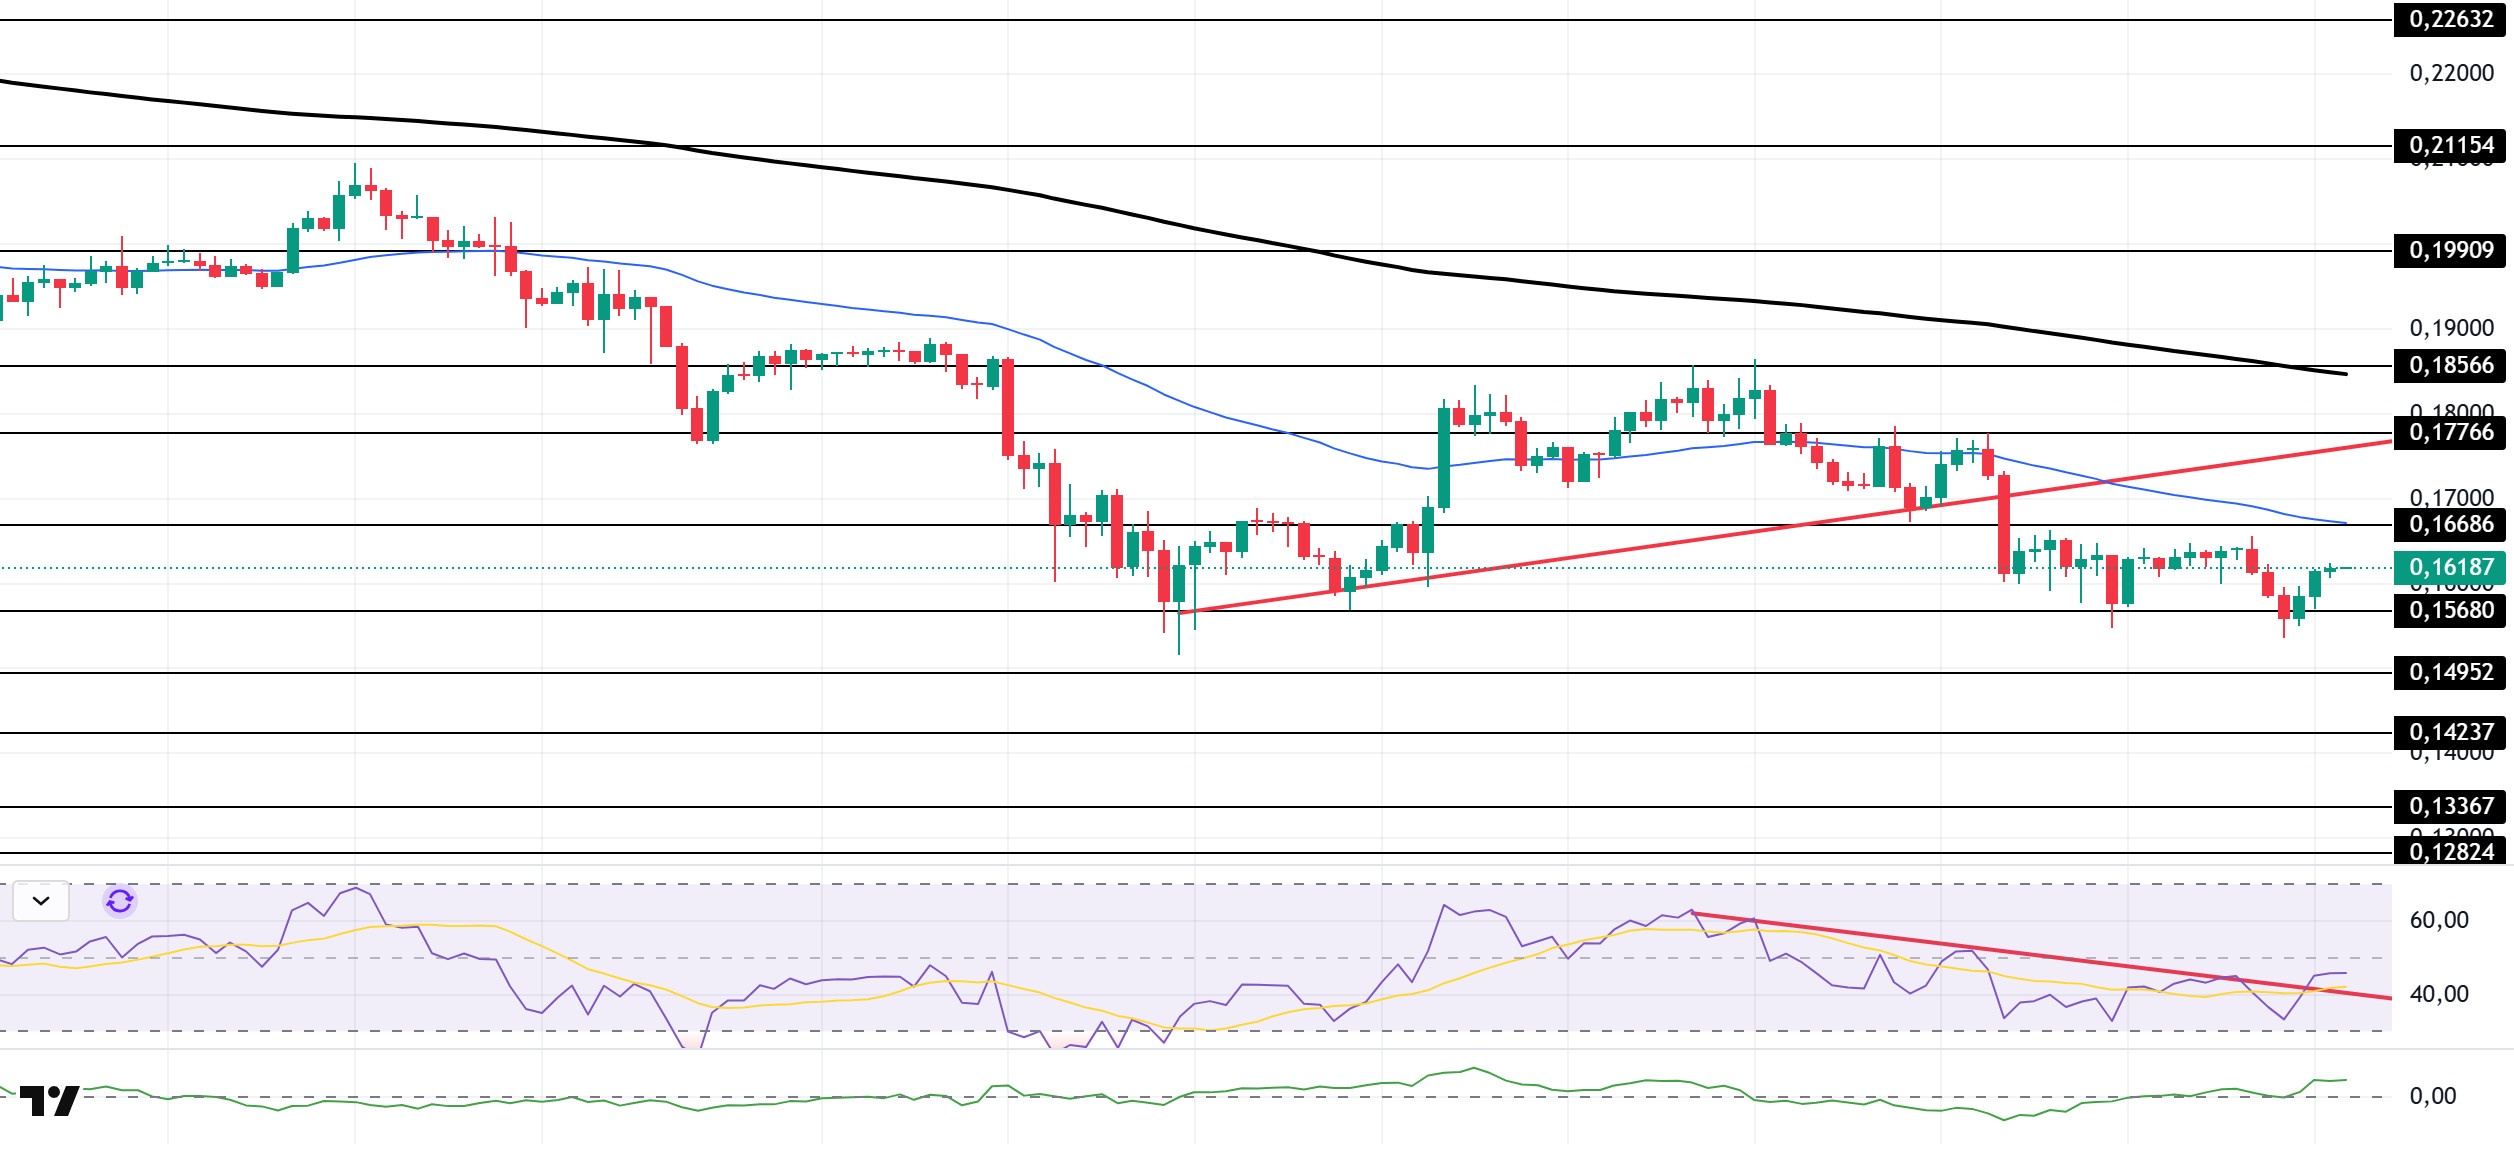
The DOGE price continued to pull back slightly. The asset remained in the lower region of the upward trend that began on November 4. As of now, the price tested the $0.15680 level as support for the second time and gained momentum again from there, showing an upward trend. If the upward trend continues, it may test the 50 EMA (Blue Line) moving average as resistance. If the candle closes below the $0.15680 level, it may test the $0.14237 level.
On the 4-hour chart, the 50 EMA (Exponential Moving Average – Blue Line) remained below the 200 EMA (Black Line). This indicates that a downtrend may begin in the medium term. The price being between the two moving averages indicates that the price is in a decision phase in the short term. The Chaikin Money Flow (CMF-20) continued to be in the positive zone, close to the neutral zone. Additionally, a decrease in cash inflows could push the CMF back into negative territory. The Relative Strength Index (RSI-14) rose to the mid-level of the negative zone. At the same time, it broke above the downward trend that began on November 10, signaling the emergence of buying pressure. In the event of an uptrend driven by political developments, macroeconomic data, or positive news flow in the DOGE ecosystem, the $0.17766 level stands out as a strong resistance zone. Conversely, in the event of negative news flow, the $0.14237 level could be triggered. A decline to these levels could increase momentum and initiate a new wave of growth.
Supports: 0.15680 – 0.14952 – 0.14237
Resistances: 0.16686 – 0.17766 – 0.18566
SHIB/USDT
The Shiba Inu ecosystem has recently reshaped itself around supply discipline, regulation, and L2 activity, presenting a mixed but structurally strengthening outlook. On the supply management side, the burn channel has accelerated significantly this time, with a total of 812 million 840 thousand 391 SHIB removed from circulation in the last seven days, bringing the weekly pace to approximately 2405% . Daily burning also reached several million SHIB, signaling an intensity not seen in a long time. In parallel, the net outflow of approximately 200 billion SHIB from exchanges reinforced the narrative of holding and accumulation rather than short-term trade-focused flows. In contrast, the ground remains weak on the L2 activity side. Shibarium’s daily transaction count fell to a few thousand levels, limiting the efficiency of the transfer channel extending from BONE fees to SHIB burning and making the contraction on the usage side visible. Thus, the divergence between the burn dynamics that reduce supply and the weak on-chain activity became apparent.
In the regulatory arena, news flow originating from Japan framed the ecosystem’s week. SHIB’s inclusion in the green list by the country’s self-regulatory organization and the financial regulator’s proposal to impose a 20% capital gains tax on crypto assets in this basket brought Shiba Inu into the same trusted category as Bitcoin and Ethereum, symbolically anchoring it and strengthening the perception of a legal foundation for institutional and individual demand in the medium term. The new product teaser shared by the team, labeled Bitget Wallet, also arrived with an emphasis on wallet-friendly usability and full SHIB integration, conveying the message that the ecosystem is striving to build new use cases on the product side even during a period of high price pressure. In summary, the picture of the recent period shows a Shib ecosystem shaped around a weak L2 volume, aggressive burning, strong exchange listings, and a Japanese-driven .
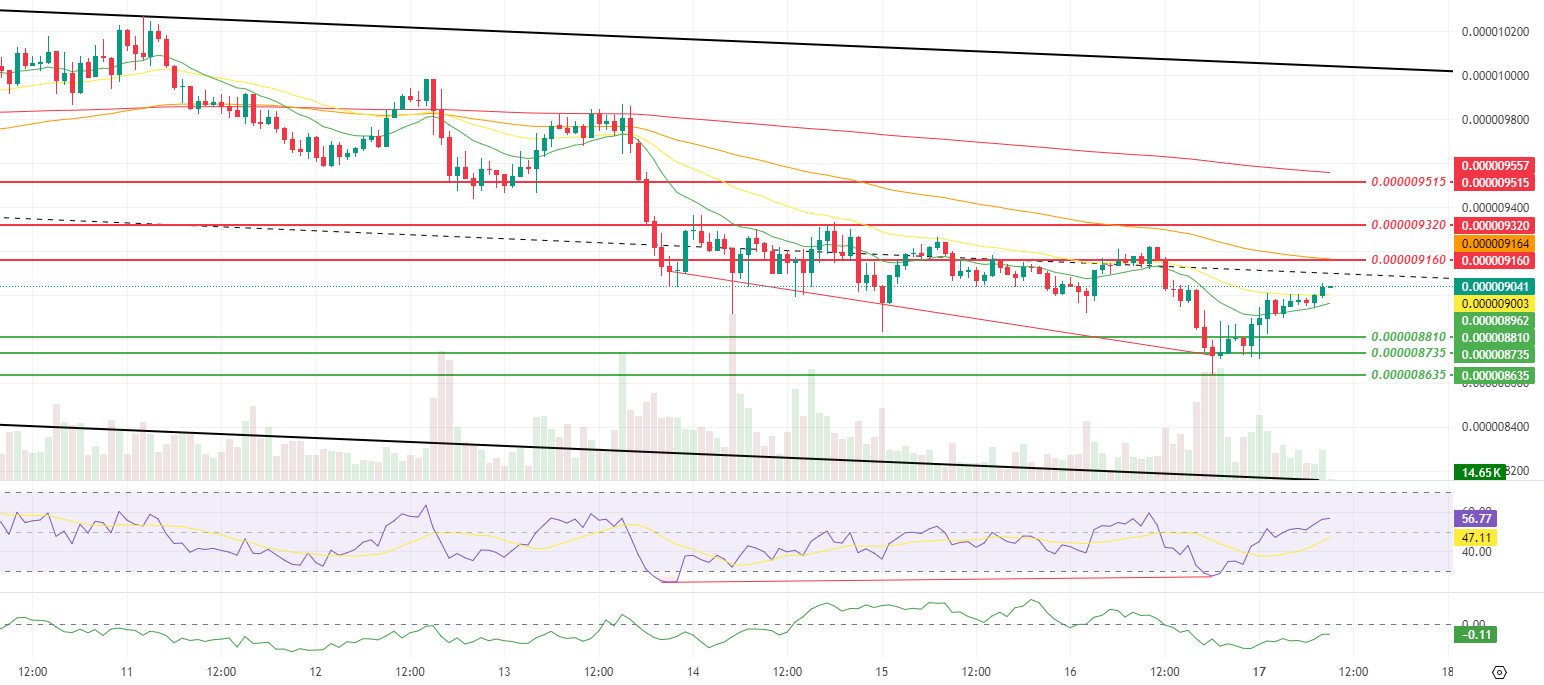
The technical chart shows a slight improvement in favor of a short-term recovery attempt. The reaction following the positive divergence (Red Line) between the Relative Strength Index (RSI) and the price, with the price rising above the 9-period and 21-period Smoothed Moving Averages (SMMA), indicates that buyers have at least been able to establish a defense line in the short term. However, the Chaikin Money Flow (CMF) indicator remaining in negative territory and the price still trading below the SMMA 50 and SMMA 200 suggests that entries are still weak and that the reaction may be limited to position adjustments for now. The price is approaching the middle band of the descending channel, and any attempt that fails to break above this band carries the risk that the current reaction will remain a correction within the main trend.
In terms of upward attempts, closes above $0.000009160 can be monitored as the first supportive signal. If sustainability is achieved above this level and the intermediate resistance levels around $0.000009320 and $0.000009515 are retaken with increasing volume, space could open up towards the upper band of the descending channel, and the momentum for a short-term recovery could strengthen. Failure to hold the $0.000008810 support level below could accelerate the decline again and pave the way for testing the $0.000008735 and then the $0.000008635 bands. Although momentum and volume increases have produced a favorable signal, as long as the CMF remains in negative territory and the price does not break out of the falling channel, this movement appears to be merely a reaction for now. A clearer breakout in both volume and channel structure is needed for a permanent change in direction. (SMMA9: Green Line, SMMA21: Yellow Line, SMMA50: Orange Line, SMMA 200: Red Line)
Supports: 0.000008810 – 0.000008735 – 0.000008635
Resistances: 0.000009160 – 0.000009320 – 0.000009515
SUI/USDT
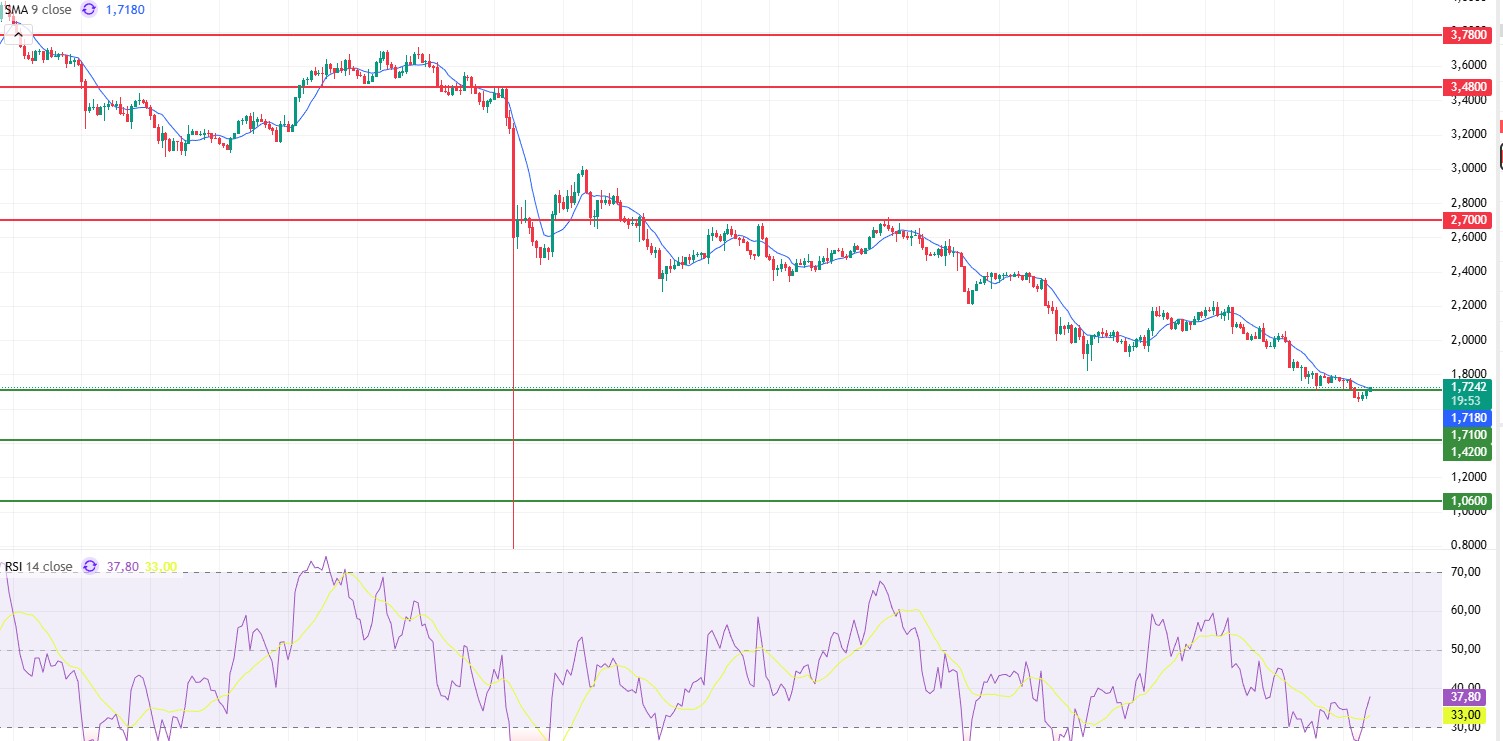
Looking at Sui’s technical outlook, we see that the price has been moving sideways at around $1.72 on a weekly basis, influenced by fundamental developments. The Relative Strength Index (RSI) is currently in the 37.80 – 33.00 range. This range indicates that the market is trading close to the buy zone; a drop in the RSI to the 35.00 – 30.00 range could signal a potential buying point. If the price moves upward, the $2.70, $3.48, and $3.78 levels can be monitored as resistance points. However, if the price falls to new lows, it could indicate that selling pressure is intensifying. In this case, the $1.71, $1.42, and $1.06 levels stand out as support zones. Based on the trend line, a pullback to $1.71 appears technically possible. According to Simple Moving Averages (SMA) data, Sui’s average price is currently at $1.71. If the price remains above this level, it signals that the current uptrend could technically continue.
Supports: 1.06 – 1.42 – 1.71
Resistances: 2.70 – 3.48 – 3.78
Legal Notice
The investment information, comments, and recommendations contained herein do not constitute investment advice. Investment advisory services are provided individually by authorized institutions taking into account the risk and return preferences of individuals. The comments and recommendations contained herein are of a general nature. These recommendations may not be suitable for your financial situation and risk and return preferences. Therefore, making an investment decision based solely on the information contained herein may not produce results in line with your expectations.

