
Weekly Fundamental Analysis Report
Fear & Greed Index
Source: Alternative.me
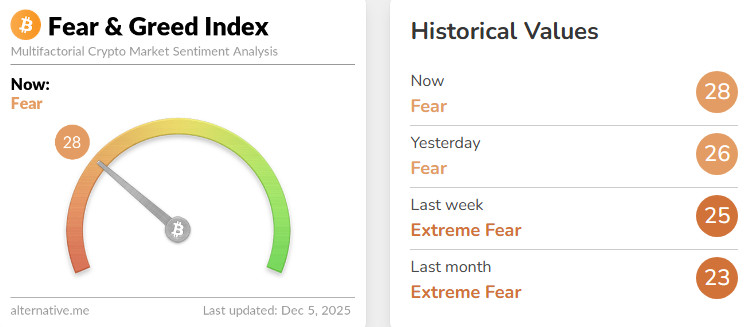
Change in Fear and Greed Value: +3
Last Week’s Level: 25
This Week’s Level: 28
Although the Fear and Greed Index rose from 25 to 28 this week, remaining in the fear zone, it moved away from the panic phase and shifted to a more controlled risk perception. The week started with technical stress and uncertainty, particularly in the US, as CME Group had to suspend some futures markets on November 28 due to a cooling issue at CyrusOne data centers, dampening risk appetite. BitMine’s purchase of 96,798 ETH, bringing its total position to 3,726,499 ETH, and Strategy’s establishment of a $1.44 billion dividend reserve and purchase of 130 Bitcoin reinforced the perception that major players are not backing down. Vanguard granting its customers access to Bitcoin ETFs and SEC Chairman Atkins signaling an innovation exemption for crypto companies in January supported a more constructive regulatory framework.
The Fed’s decision to end QT on December 1 and then increase liquidity with $13.5 billion in overnight repos, along with the US halting planned new sanctions against China, also provided underlying support for overall risk appetite. The US Initial Jobless Claims data was another factor balancing the picture. Claims falling to 191k, compared to expectations of 219k and the previous level of 218k, supported the growth outlook by showing no sudden deterioration in employment. it also curbed excessive optimism in the index by maintaining expectations that the Fed would not enter a very rapid easing cycle due to the labor market remaining relatively strong. With all these factors combined, the index ended the week at 28, taking another step from deep panic to a regime of cautious fear.
Crypto Fund Flows
Source: Coinshares
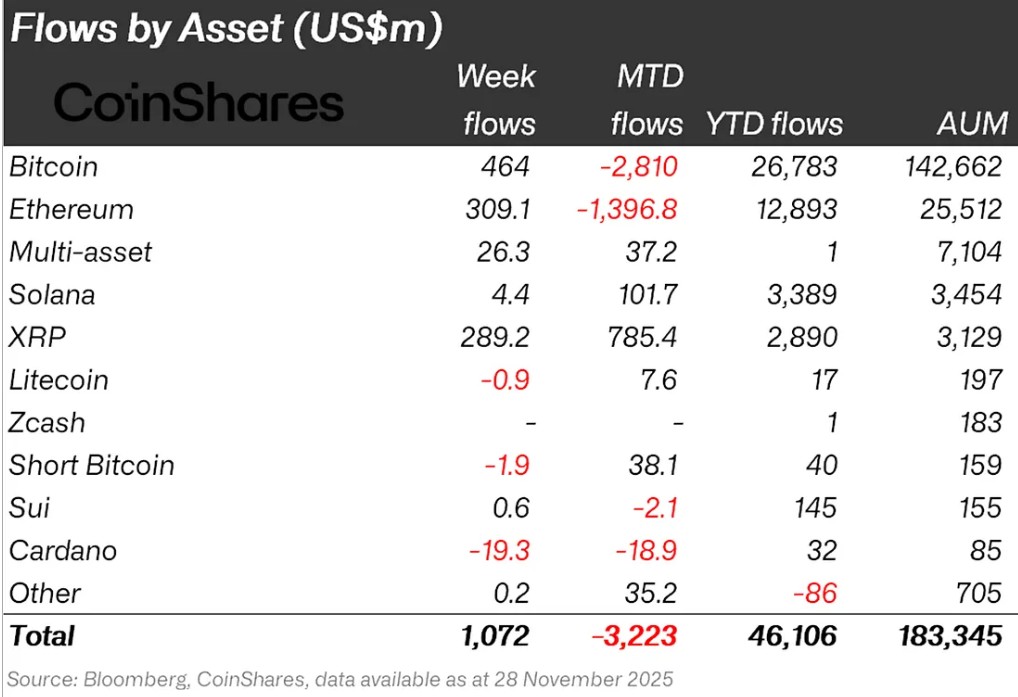
Crypto markets continued their downward trend this week. The decline continued with negative statements from Fed members. As a result of these developments, Bitcoin lost approximately 5% of its value during the week.
Bitcoin (BTC): Bitcoin continues to see weak inflows from investors this week. Bitcoin-focused funds saw inflows of $464.0 million.
Ethereum (ETH): Along with spot ETH inflows, Ethereum saw $309.1 million in inflows this week.
Solana (SOL): Solana saw inflows of $4.4 million.
SUI: Sui’s stablecoin initiatives continue to have a positive impact. This trend continued with $0.6 million in inflows into Sui.
Ripple (XRP): This week, XRP saw an inflow of $89.3 million.
Multi-asset: Inflows were observed in the multi-asset group.
Other: Sector-specific and project-based increases in altcoins, along with the general market outlook, brought in $0.2 million in fund inflows.
Fund Outflows:
Short Bitcoin: Short Bitcoin saw an outflow of $1.9 million.
Cardano (ADA): Cardano saw an outflow of $19.3 million this week.
Litecoin (LTC): There was an outflow of $0.9 million in LTC coins.
Total Market Cap
Source: Tradingview
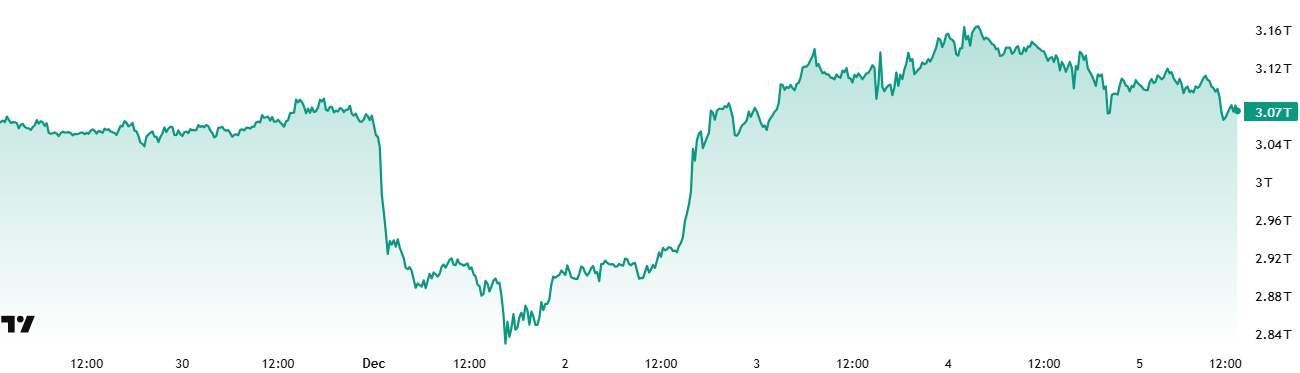
- Last Week’s Market Value:04 trillion Dollars
- This Week’s Market Value: $3.08 Trillion
This week, the cryptocurrency market grew by approximately $42 billion, advancing 1.39% and bringing the total market cap to $3.08 trillion. The week’s high was $3.18 trillion, while the low was $2.83 trillion. Thus, the market was seen to move within a $350 billion band, which translates to a volatility of 12.39%. Although wider than last week’s 8.87% range, it can be considered the classic “weekly average candle length” for the crypto market.
Total 2
The Total 2 index, which started the week with a market value of $1.23 trillion, rose 1.56% during the week, gaining approximately $19 billion in value, and ended the period at around $1.25 trillion. The weekly high was $1.3 trillion, while the low was $1.15 trillion. In other words, the index fluctuated within a range of $145 billion, which corresponds to a volatility of approximately 12.65% for the period. With this rise, Total2 is now positioned about 41% away from its all-time high. Therefore, if this decline is seen as a correction, it can be said that expectations for an uptrend are beginning to form among major altcoins.
Total 3
Total 3 started the week with a total value of $0.872 trillion, grew by approximately $31 billion during the week, recording a 0.12% increase, and closed the period at $0.873 trillion. The volatility between the week’s highest and lowest values was only 10.06%. Thus, Total 3 retained its title as the most stable index this week, and interestingly, this pattern has remained unchanged for four weeks. While the overall market structure appears entirely positive, the fact that the most stable performance has unexpectedly come from Total 3 for several weeks in a row could be seen as a small but sweet signal for “that famous altcoin season” should the current pullback end.
The fact that the index-volatility ranking is Total2 > Total > Total 3 shows that the dominant movement in the majors is concentrated first in Ethereum and then in Bitcoin. Furthermore, the gap between Total 2 and Total 3 widening significantly for the first time in weeks also implies a meaningful recovery in Ethereum’s total market share.
Altcoin Season Index
Source: Coinmarketcap
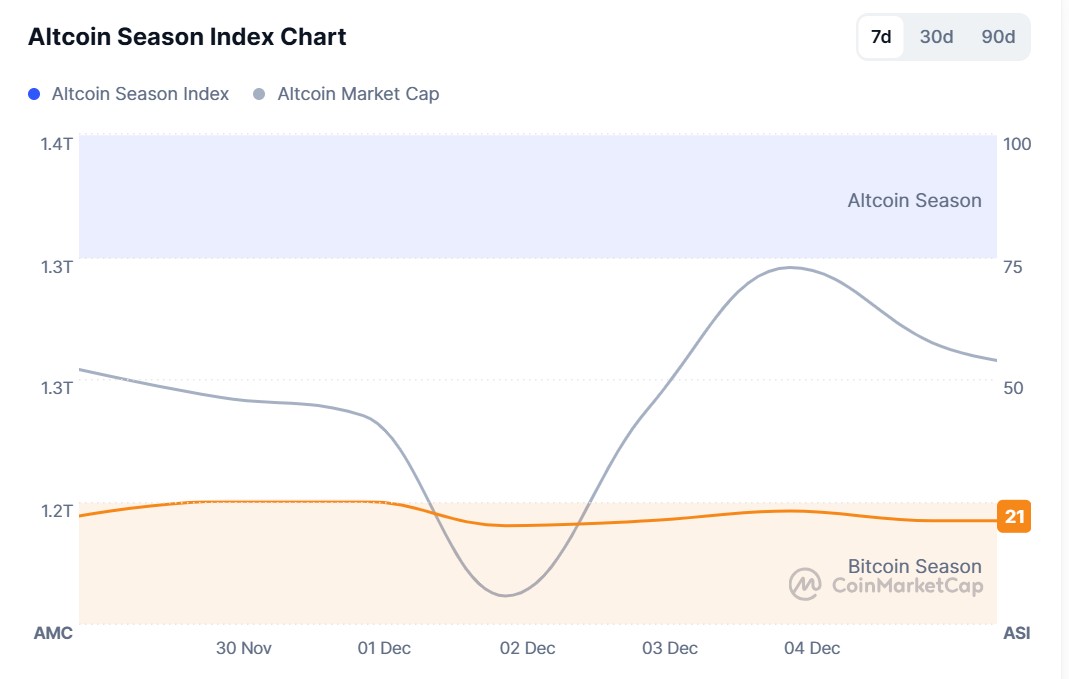
- Last Week’s Index Value: 21/100
- This Week’s Index Value: 21/100
Between November 28 and December 5, 2025, after a slight increase in the correlation between altcoin market dominance (Altcoin Market Cap) and the Altcoin Season Index, a decline occurred again. The graph shows that this week, on December 1 , the index rose to 25, indicating that the Altcoin Market Cap reached 1.27T. When the index rose this week, the top 5 coins leading the rise were Aster, Zec, M, Merl, and Dash. On December 4, the index fell from 25 to 21, indicating the potential for a decline in the altcoin season.
Bitcoin Dominance
Source: Tradingview
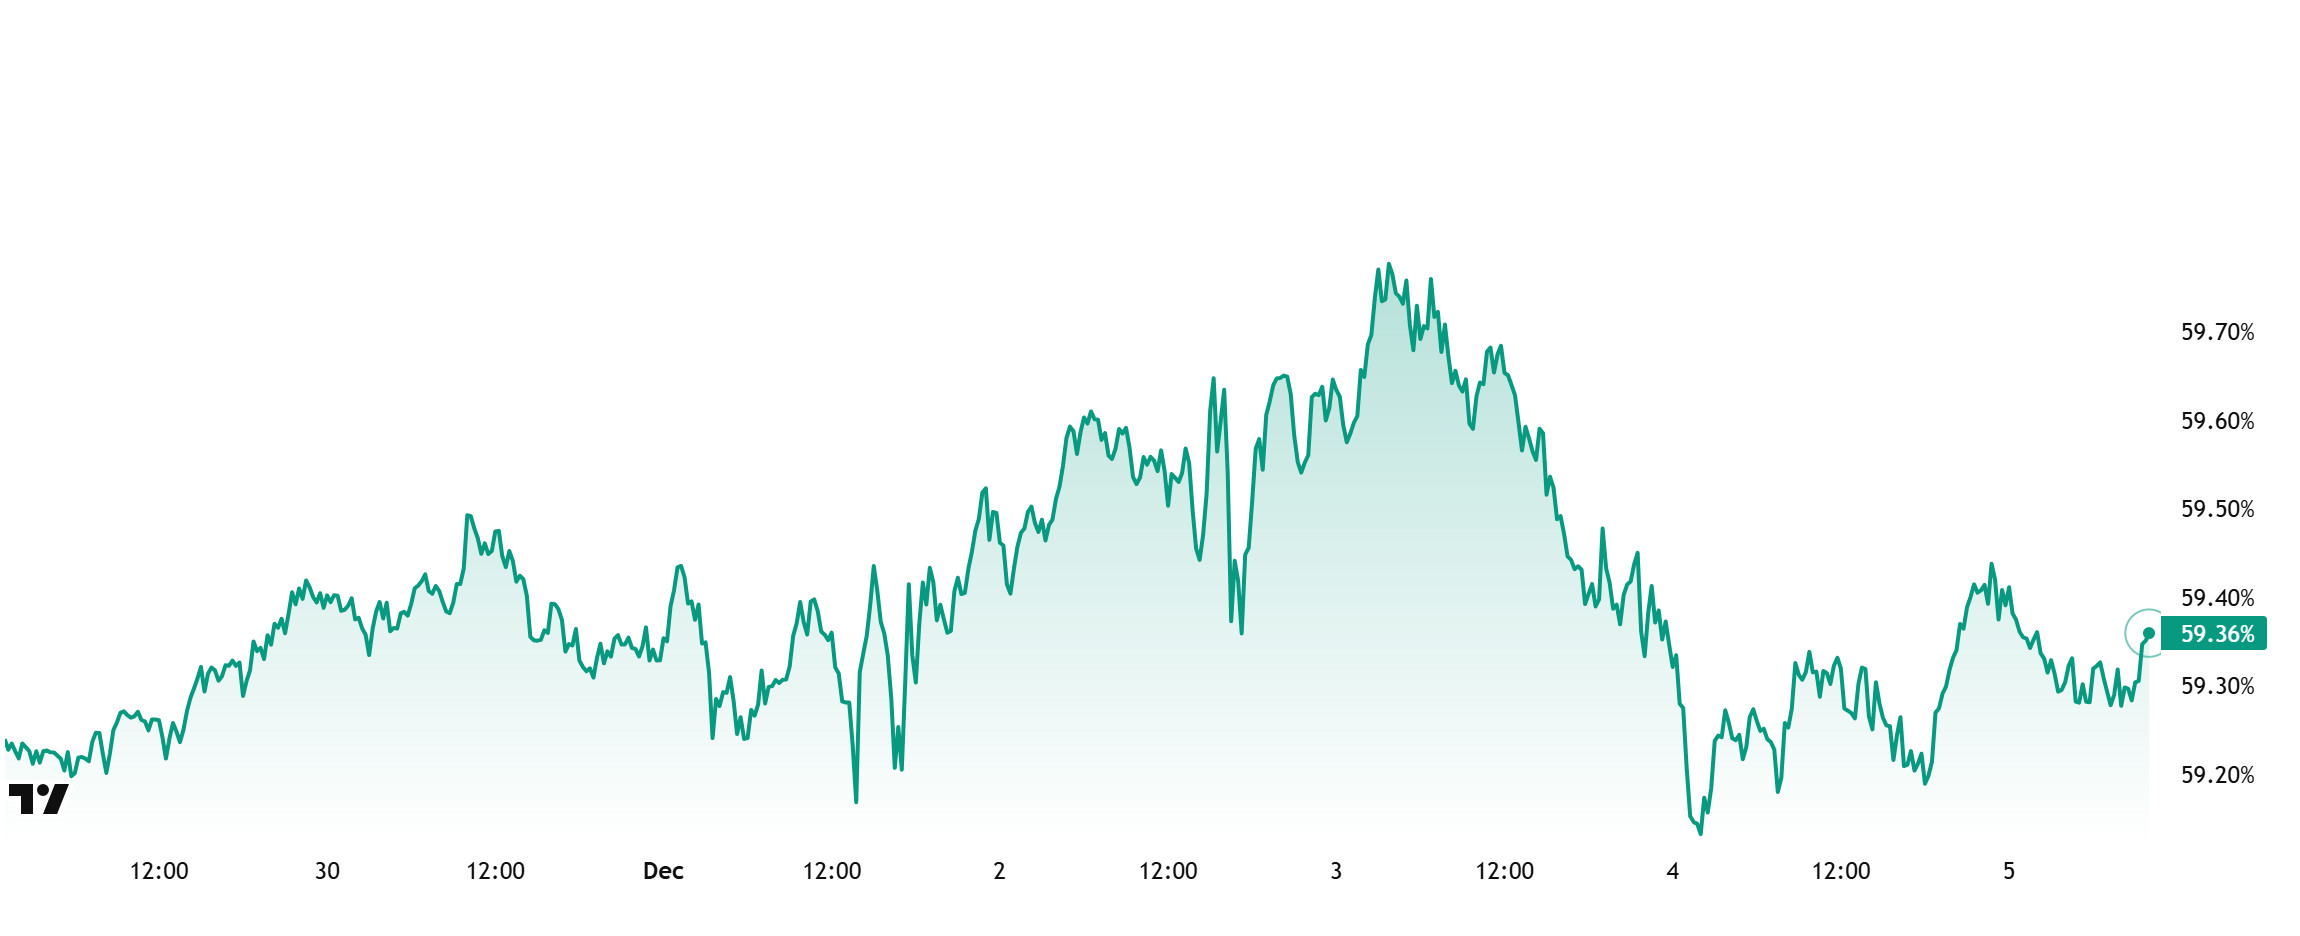
Weekly Change
- Last Week’s Level:28%
- This Week’s Level:36%
Bitcoin dominance started the week at 59.39%, rose to 59.59% during the week, but then fell back slightly and is currently at 59.36%.
This week, Strategy purchased 310 Bitcoin and ANAP purchased 54.5 Bitcoin. Additionally, data on Bitcoin spot ETFs shows a net outflow of $142.5 million to date.
While the weakness in institutional buying appetite persists, retail investors trading through the ETF channel have seen a slight increase in their sell positions compared to the previous week. The uncertainty in the markets, driven by the Fed, continues to weaken capital inflows into crypto assets and limit buying appetite for Bitcoin. The net outflows observed in spot ETFs indicate that selling pressure could regain strength in the short term. Even under all these macro pressures, Bitcoin is showing more resilient pricing compared to Ethereum and other major altcoins. In summary, a gradual recovery in institutional demand could pave the way for BTC dominance to continue its current strong structure and consolidate in the 58%–61% range.
Ethereum Dominance
Source: Tradingview
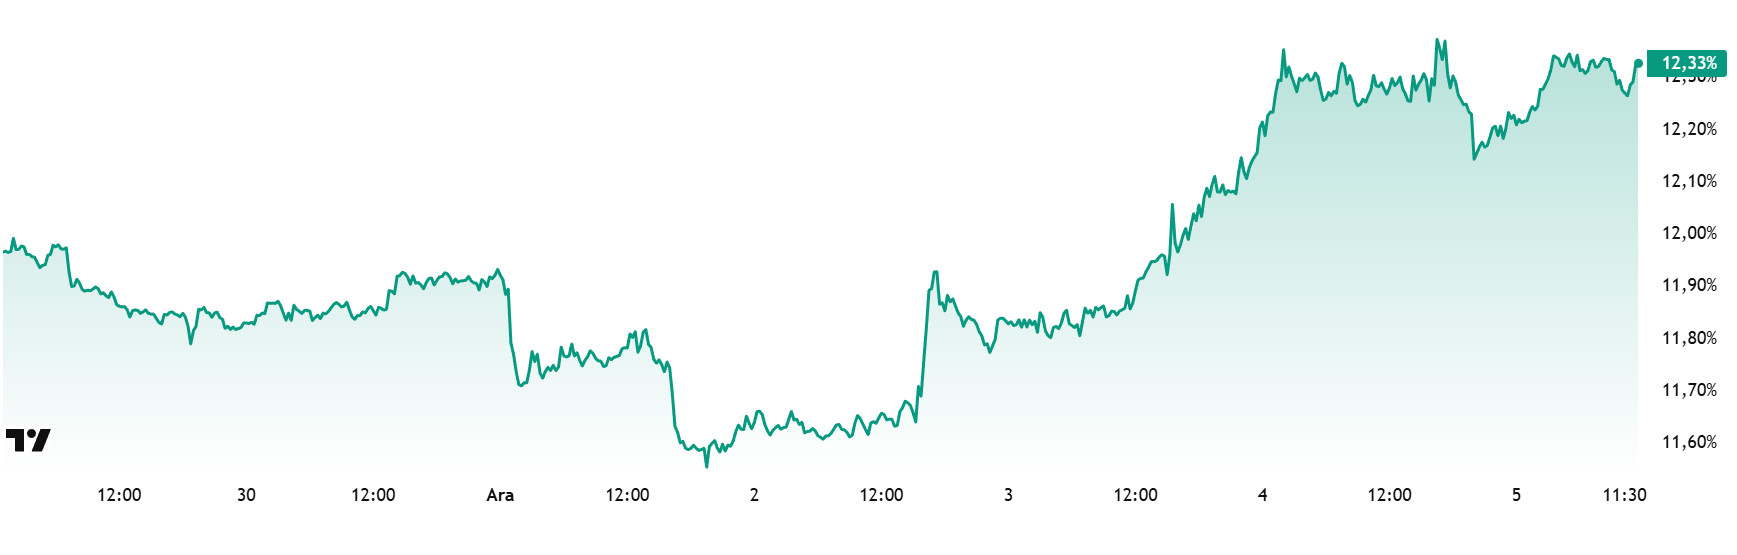
Weekly Change:
- Last Week’s Level: 11.89%
- This Week’s Level: 1 2.33%
Ethereum dominance, which rose to 15% levels in mid-August, lost momentum and entered a downward trend. However, this negative outlook ended above the 11.50% level last week and regained positive momentum.
Accordingly, Ethereum dominance ended last week at 11.89% and is currently trading at around 12.33% according to the latest data. During the same period, Bitcoin dominance also recorded a positive trend similar to Ethereum.
The key developments affecting Ethereum dominance are as follows:
According to CryptoQuant data, Binance’s ETH Taker ratio rose to 0.998 after the Fusaka update, reaching its highest level in four months. This increase indicates that buyers are aggressively opening positions in futures trading. While the ratio is rising, the price is still hovering around $3,130, indicating that the indicator points to leadership.
The Ethereum Foundation, in collaboration with the University of Buenos Aires and other educational institutions, has launched educational projects on blockchain and distributed systems. Starting in 2026, students will be able to obtain EF-approved certificates.
The Ethereum Foundation announced that nodes need to be reconfigured to resolve an issue identified in the Prysm consensus client. The Prysm team quickly released a patch, stating that users only need to add the signing node.
The Ethereum Fusaka upgrade will be activated at UTC 21:49:11. The upgrade will increase the block gas limit to 60 million, increasing the capacity of Layer 2 transactions. This is expected to reduce L2 fees by 40-60%. This development will enable parallel scaling in both the consensus and execution layers.
Bitcoin Spot ETF
Source: Darkex Research Department
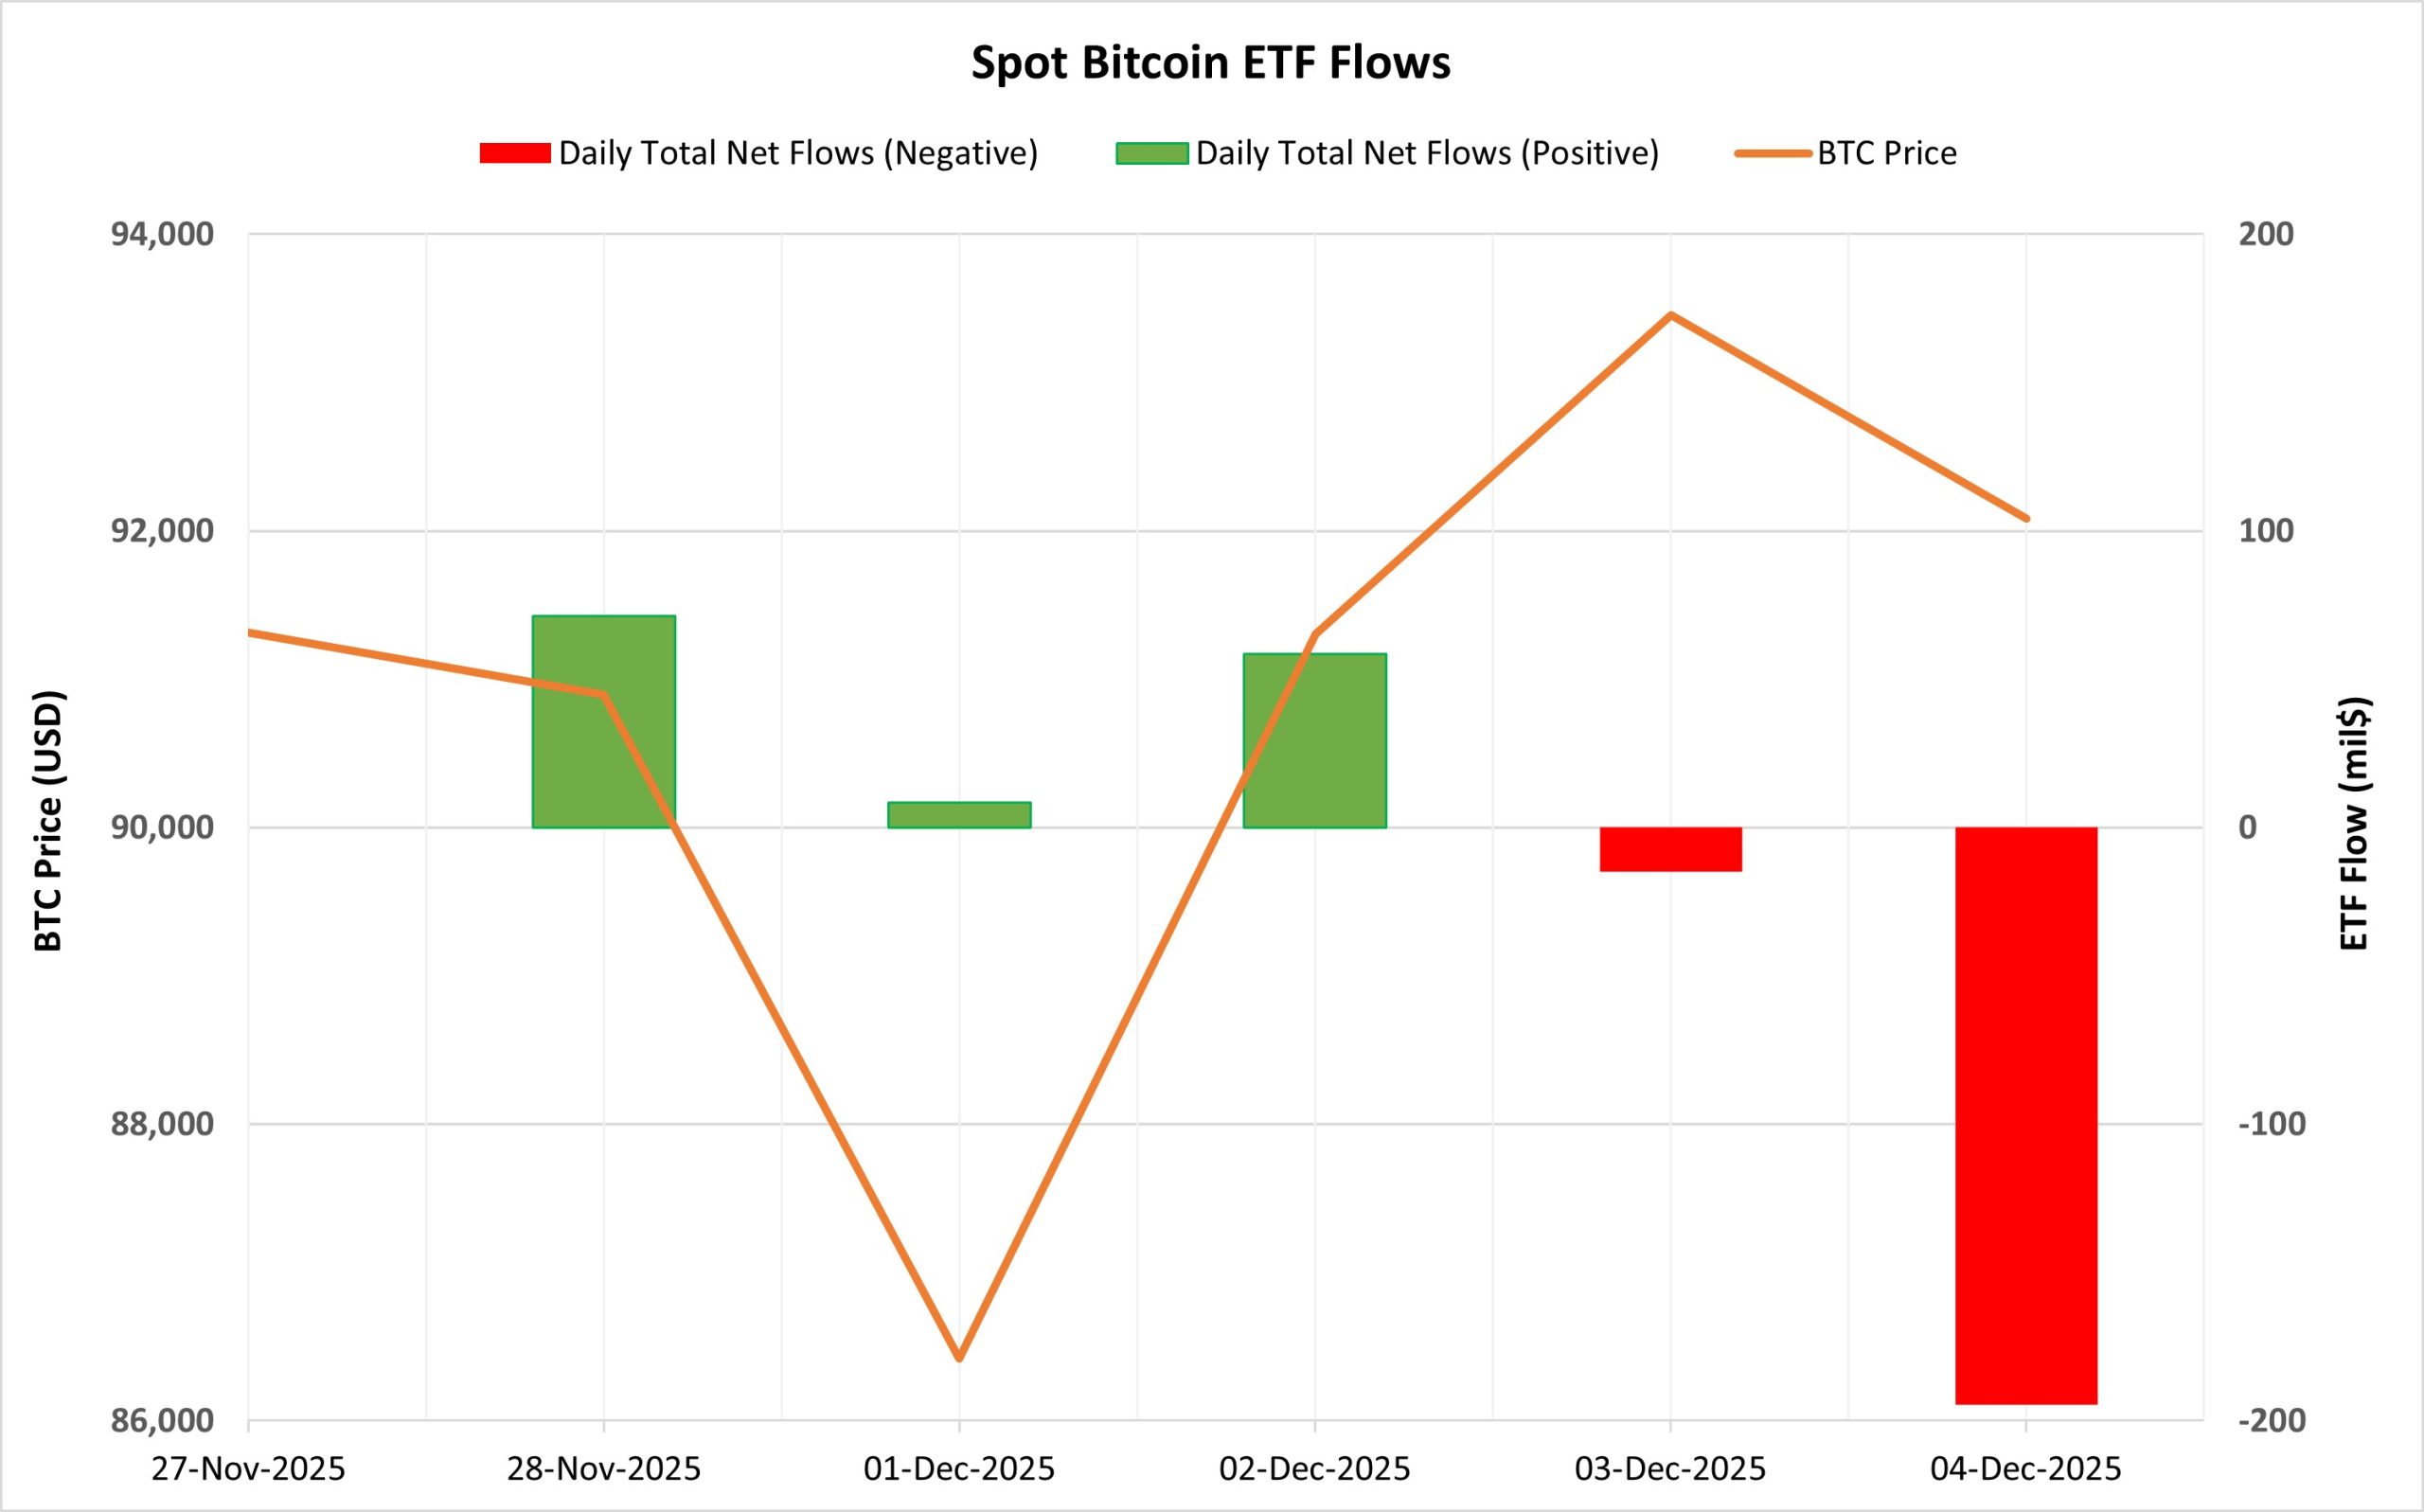
Netflow Status: Between November 28 and December 4, there was a total net outflow of $71.1 million from Spot Bitcoin ETFs. Positive flows during the first three days of this period signaled a short-term recovery. However, the five-day series of positive flows ended with a $14.9 million outflow on December 3, and a strong $194.6 million outflow on December 4 turned the net flow negative during this period. BlackRock IBIT and Ark ARKB showed the weakest performance on a fund basis, while Fidelity FBTC was the most stable fund in terms of inflows.
Bitcoin Price: Bitcoin opened at $91,315 on November 28 and closed at $92,084 on December 4. During this period, the Bitcoin price gained 0.84%. The 5.65% increase in the BTC price on December 2 indicated a positive market reaction in line with ETF inflows. However, the high net outflow on December 4 put pressure on the BTC price.
Cumulative Net Inflow: 475. At the end of the trading day, the cumulative total net inflow of Spot Bitcoin ETFs fell to $57.54 billion.
| DATE | COIN | Open | Close | Change % | ETF Flow (mil$) |
|---|---|---|---|---|---|
| November 28, 2025 | BTC | 91,315 | 90,895 | -0.46% | 71.4 |
| Dec 1, 2025 | BTC | 90,408 | 86,418 | -4.41% | 8.5 |
| December 2, 2025 | BTC | 86,418 | 91,301 | 5.65% | 58.5 |
| December 3, 2025 | BTC | 91,301 | 93,453 | 2.36% | -14.9 |
| December 4, 2025 | BTC | 93,453 | 92,084 | -1.47% | -194.6 |
| Total for Nov 28 – Dec 4, 2025 | — | — | — | 0.84% | -71.1 |
This period saw an uncertain outlook in ETF flows. While inflows in the early days sent a positive signal to the market, successive outflows after December 3 weakened this effect. In particular, the sharp outflow on December 4 signaled continued caution on the institutional side. Although the BTC price recorded a slight increase, the imbalance on the flow side indicated that volatility could continue in the short term. If fund inflows regain strength in the coming days, a clearer recovery could be seen on the price side. However, a continued outflow trend could put renewed pressure on Bitcoin.
Ethereum spot ETF
Source: Darkex Research Department
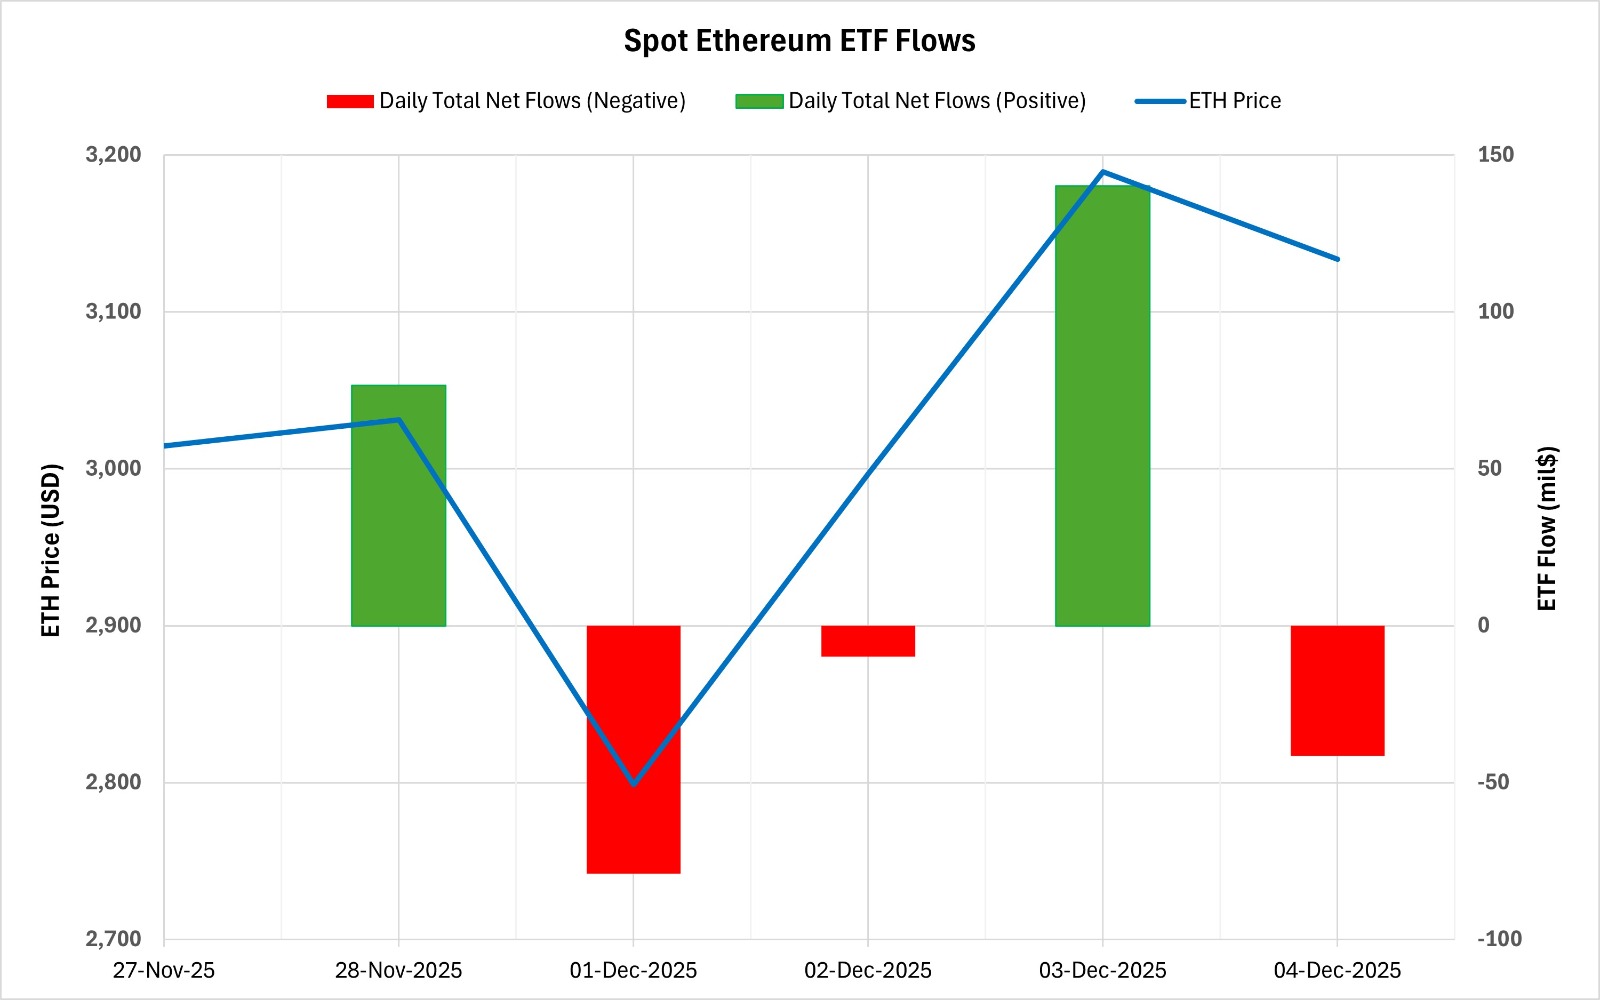
Between November 28 and December 4, 2025, a total of $86.4 million in net inflows occurred into Spot Ethereum ETFs. No clear direction emerged in ETF flows during this period. The alternating occurrence of positive and negative flows created a volatile picture. Only two days out of five trading days saw strong inflows, indicating that institutional investors maintained a cautious stance. The most notable movements by fund occurred through BlackRock ETHA and Fidelity FETH, while Grayscale ETHE experienced a week with limited inflows and outflows. The cumulative total net inflow of Spot Ethereum ETFs rose to $12.97 billion as of the 345th trading day.
| DATE | COIN | Open | Close | Change % | ETF Flow (mil$) |
|---|---|---|---|---|---|
| November 28, 2025 | ETH | 3,015 | 3,031 | 0.55% | 76.6 |
| December 1, 2025 | ETH | 2,992 | 2,799 | -6.47% | -79 |
| December 2, 2025 | ETH | 2,799 | 2,997 | 7.08% | -9.9 |
| December 3, 2025 | ETH | 2,997 | 3,189 | 6.43% | 140.2 |
| December 4, 2025 | ETH | 3,189 | 3,134 | -1.75% | -41.5 |
| Total for Nov 28 – Dec 4, 2025 | — | — | — | 3.95% | 86.4 |
Ethereum opened at $3,015 on November 28 and closed at $3,134 on December 4. During this period, ETH gained 3.95% in value. The rise in Ethereum’s price was particularly supported by strong daily increases on December 2-3. However, the fact that inflows were not as strong and stable indicated that a full confidence recovery had not yet taken place in the market. Overall, this period presented a picture of the price showing a recovery trend, but ETF flows remaining uncertain. If fund inflows regain momentum in the coming days, the upward movement in the Ethereum price could be based on more solid ground. However, if the weak and unstable flow continues, short-term increases in ETH may remain limited.
Bitcoin Options Distribution
Source: Laevitas
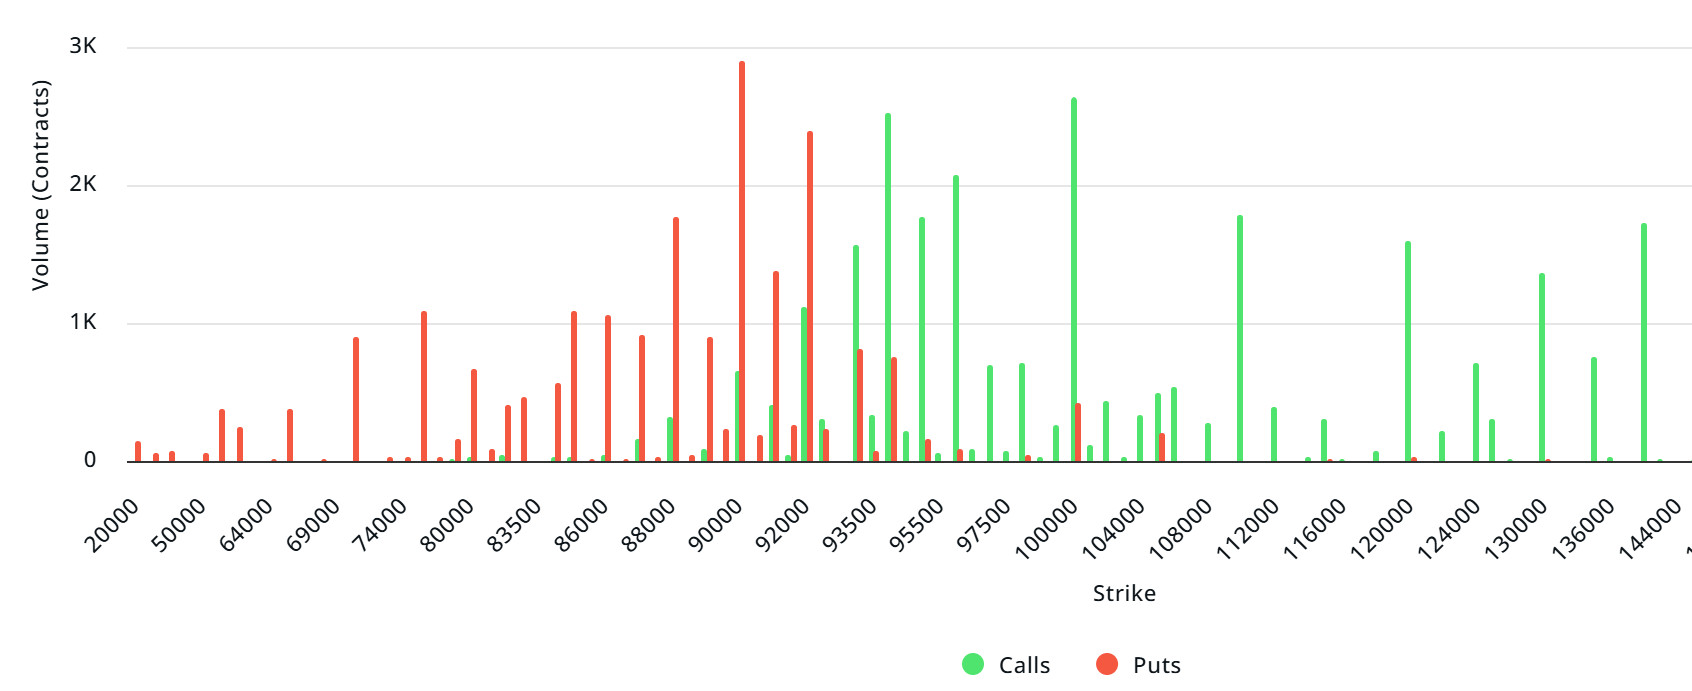
BTC: Notional: $3.38B | Put/Call: 0.72 | Max Pain: $91K
Deribit Data: Deribit data shows that BTC option contracts with a notional value of approximately $3.38 billion expire today. At the same time, looking at the risk transformation over the next week based on the last 24 hours’ data, put options are dominating over call options in terms of risk hedging. When examining expected volatility (IV), it is below realized volatility (RV). On the other hand, the negative spread metric indicates low risk appetite in the market and shows that put options are expensive. Skew values are also pointing downward today and for the coming week.
Laevitas Data: Examining the chart, we see that put options are concentrated in a wide band between $69,000 and $92,000. Call options, on the other hand, are spread across a broad base between $93,000 and $140,000. At the same time, the $100,000 level appears to be resistance, while the $90,000 level appears to be support. On the other hand, there are 2.89K put options at the $90,000 level, peaking here and showing a decline in put volume after this level. Meanwhile, 2.65K call option contracts peak at the $100,000 level. Looking at the options market, we see that put contracts dominate on a daily and weekly basis.
Option Maturity:
Call/Put Ratio and Maximum Pain Point: Looking at options based on the latest 7-day data from Laevitas, the number of call options decreased by approximately 27% compared to last week, reaching 147.58K. In contrast, the number of put options decreased by 26% compared to last week, reaching 116.29K. The put/call ratio for options is set at 0.72. This indicates that there is less demand for call options than put options among investors. Bitcoin’s maximum pain point is seen at $91,000. BTC is currently priced at $92,300, and if it does not break below the pain point of $91,000, the upward trend is expected to continue.
Ethereum Options Distribution
Source: Laevitas
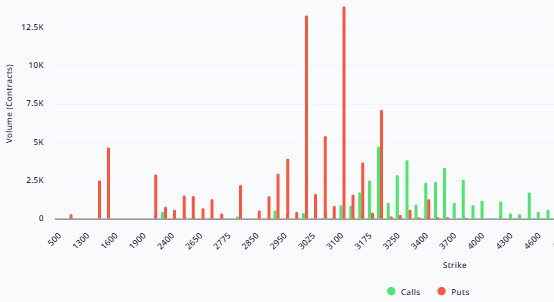
ETH: $0.67 B notional | Put/Call: 1.24 | Max Pain: $3,050
Laevitas Data: Looking at the data in the chart, we see that put options are concentrated in a fairly wide band, particularly between the $3,000 and $3,200 price levels. The highest put volume is at the $3,100 level, with approximately 14K contracts. On the other hand, in call options, there is a noticeable concentration at the $3,200 to $3,300 levels. The demand for put options has been ongoing for quite some time.
Deribit Data: First, we see that although ATM volatility has dropped significantly on a daily basis to 61.32, it remains at a high level. Therefore, we can expect uncertainty to continue and pricing to remain within a wider range. Looking at volume, while call volume has declined, the expansion in put volume is more pronounced. The significant increase in put volume suggests that the likelihood of downward expectations in the market being purchased is quite high.
Option Maturity:
Ethereum options with a nominal value of $0.67 billion expired on December 5. The Max Pain level was calculated at $3,050, while the put/call ratio stood at 1.00.
Legal Notice
The investment information, comments, and recommendations contained in this document do not constitute investment advisory services. Investment advisory services are provided by authorized institutions on a personal basis, taking into account the risk and return preferences of individuals. The comments and recommendations contained in this document are of a general nature. These recommendations may not be suitable for your financial situation and risk and return preferences. Therefore, making an investment decision based solely on the information contained in this document may not result in outcomes that align with your expectations.