
Weekly Technical Analysis Report – September 29 – October 6, 2025 –
BTC/USDT
Fed Chair Jerome Powell stated that inflationary pressures from tariffs would last for a few quarters but would not be permanent. While signs of softening in the labor market were highlighted, Fed members expressed differing views on interest rate policy. In the US, jobless claims reached 218K, second-quarter GDP was confirmed at 3.8%, and core PCE came in at 2.9%. Trump and Xi agreed to meet again at the APEC summit on October 31, while the White House is accelerating its efforts to regulate the crypto market. As companies continue to buy Bitcoin, the Trump administration announced a new wave of tariffs, and the risk of a government shutdown remains on the agenda.
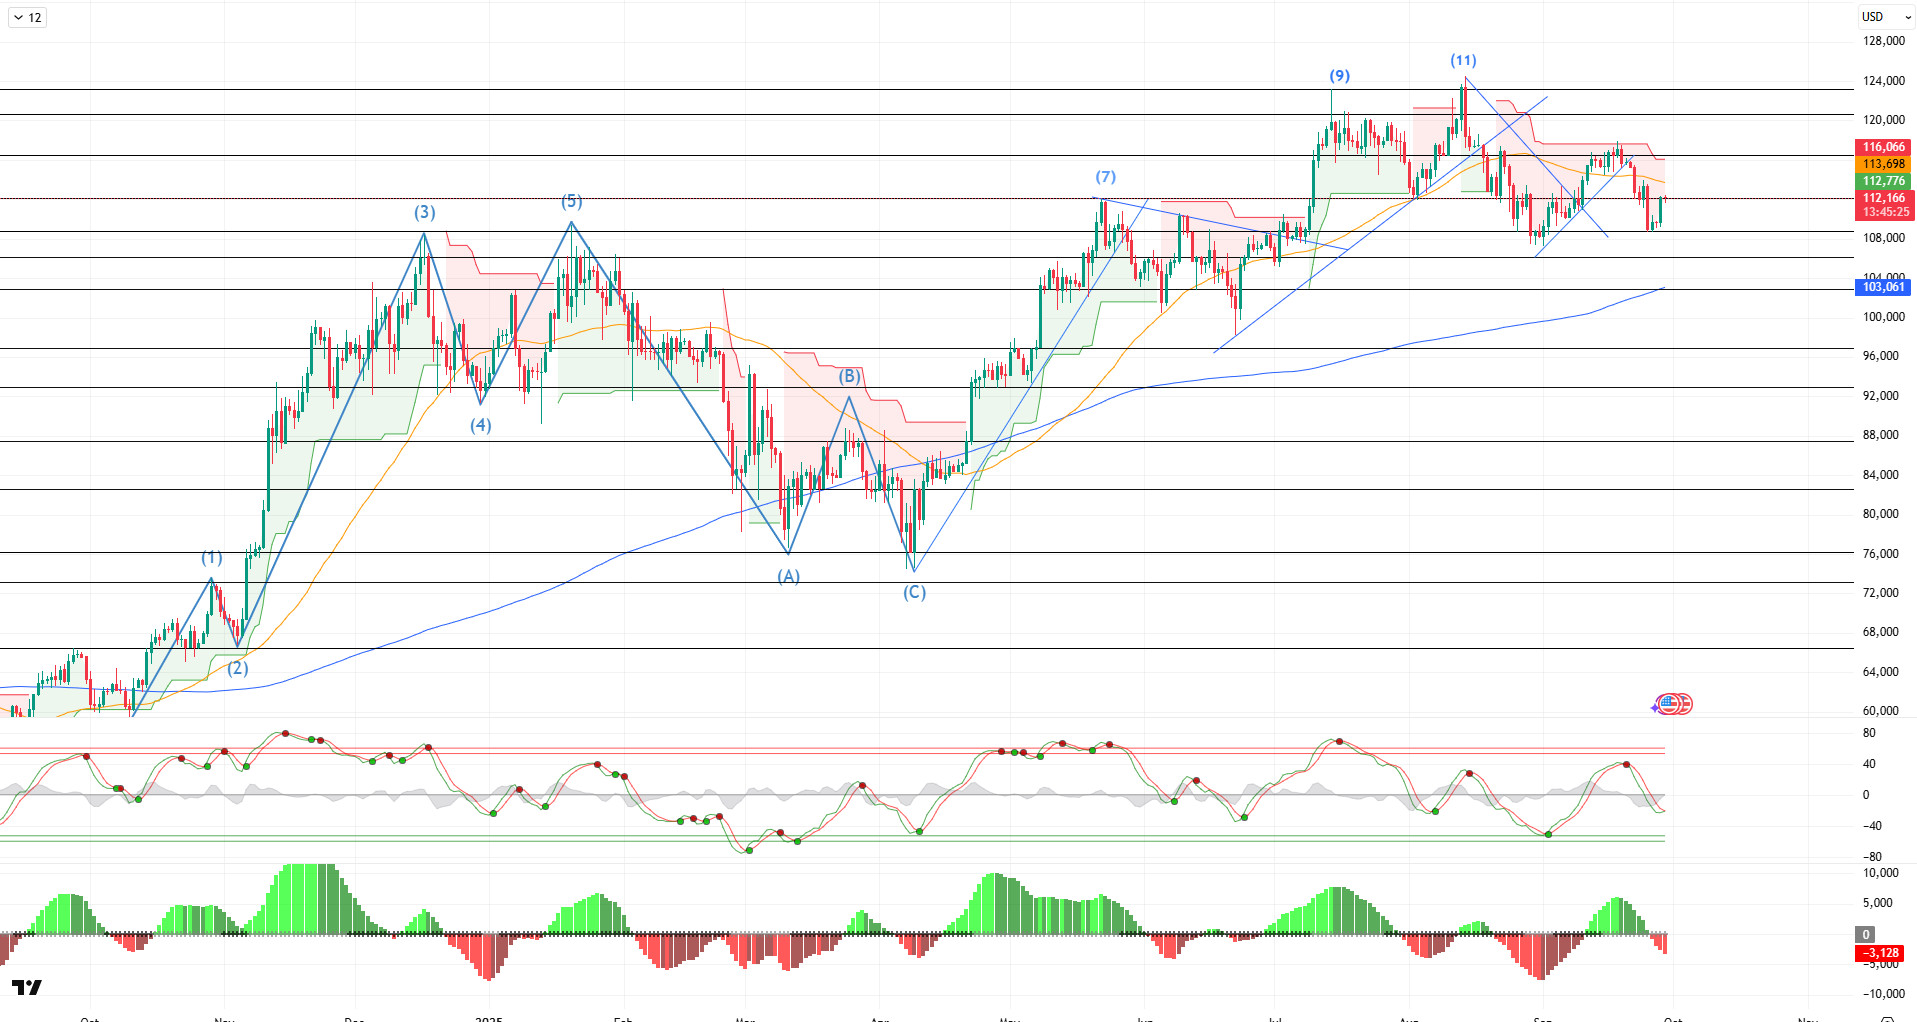
Looking at the daily technical picture after all these developments, BTC tested the 108,600 level with a minor downtrend starting from the 11th point it reached with its golden cross pattern. BTC, which also tested this level in late August, points to a W formation with the double bottom it created on the daily chart, with the completion line of the formation seen at the 116,000 level. BTC, which started the week at 112,800 levels, continues to trade at 112,100 with a 0.60% loss in value.
Looking at technical indicators, the Wave Trend (WT) oscillator is preparing for a buy signal on the daily chart, signaling a trend reversal in the middle band of the channel. While the Squeeze Momentum (SM) indicator is still moving in negative territory, the golden cross pattern continues in the moving averages as the 50-day SMA crosses above the 200-day SMA.
Looking at weekly liquidity data, buy-side transactions are starting to accumulate again within the 108,000-109,000 band, while selling pressure remains intense above the 114,000 level.
In summary, looking at the fundamental developments, the decline in interest rate cut expectations, along with US macro data reducing the risk of recession, caused the market to lose its positive short-term environment. Different views from Fed members regarding interest rate cuts and tariffs re-entering the equation emerged as pessimistic developments for the market. On the other hand, with October approaching, a month dominated by gains in crypto, the price appears to be recovering from its low. On the technical side, BTC, which appears to be recovering again with a double bottom, points to a “W” formation, while liquidity data shows that part of the monthly liquidity areas have been cleared and a new buying level is beginning to form. In the coming period, whether the price can regain the 115,000 level will be a critical reference point to follow, and staying above this level will be decisive in terms of gaining upward momentum. On the other hand, if selling pressure deepens, the 110,000 level stands out as a critical threshold for staying in positive territory.
Supports: 110,000 – 106,300 – 103,000
Resistances: 113,000 – 115,000 – 116,600
ETH/USDT
Ethereum experienced a volatile week last week, overshadowed by global macro data and technical developments. The August core PCE annual rate came in at 2.9%, in line with expectations, confirming that inflation remains stable and is one of the critical indicators guiding the Fed’s policy decisions. While this development created cautious optimism in the market, important technical steps were also taken in the Ethereum ecosystem. The Nimbus client released version v25.9.1. Although this update is of low importance for the main network, it is critical for the Hoodi, Sepolia, and Holesky testnets and stands out as a necessary step for compatibility with the upcoming Fusaka fork.
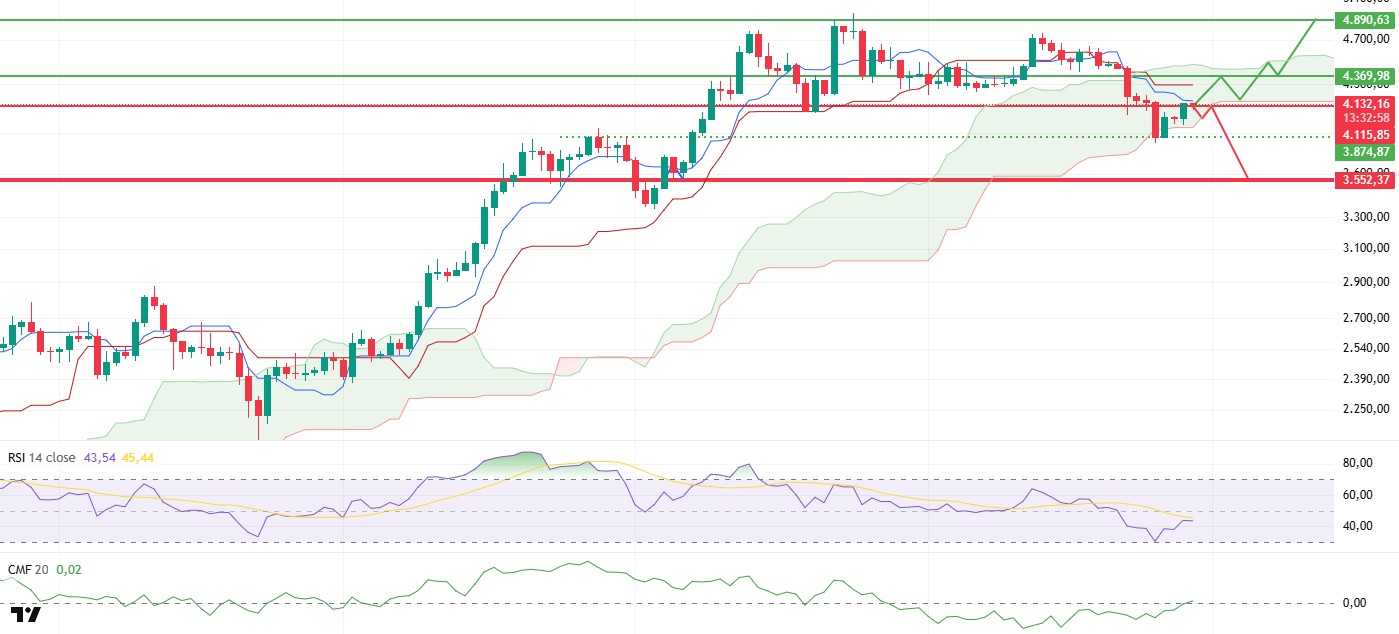
In terms of price movements, Ethereum fell to $3,827 levels after losing the $4,111 level last week due to intensified selling pressure. However, by the weekend, it found support in this region and managed to regain the $4,111 level. This recovery indicates that sellers are losing strength and buyers are re-entering at a critical threshold. On the on-chain side, it is noteworthy that despite this sharp pullback, there has been no change in the ETH Total Value Staked ratio. This view confirms that there has been no deterioration in investor confidence in the long term and signals that stability in the ecosystem has been maintained.
Technical indicators support the price recovery. The Chaikin Money Flow (CMF) indicator moved into positive territory for the first time since August 28. This pattern reveals that intense liquidity inflows have resumed in the market and that buyers’ strength is increasing.
In the Ichimoku indicator, the price’s upward movement after a fake break below the kumo cloud carries a positive signal for the medium-term outlook. However, for this outlook to be confirmed, the price needs to permanently gain the tenkan and kijun levels.
The Relative Strength Index (RSI) indicator has also turned upward again, supported by the oversold zone boundary. This movement indicates that momentum is gaining strength and a healthy foundation for an uptrend is beginning to form.
In the overall outlook, Ethereum maintaining the $4,111 level and ensuring sustainability will support the price’s rise towards the $4,369 resistance in the coming days. If this level is exceeded, upward momentum is expected to strengthen and buyer control to become more pronounced. However, closes below $4,111 could quickly reverse the positive picture and cause the price to retest the $3,850 support. Although risks remain alive in the short term, both the stable course of staking data and the increase in liquidity inflows confirm that Ethereum remains structurally strong.
Supports: 4,115 – 4,000 – 3,552
Resistances: 4,369 – 4,890 – 5,250
XRP/USDT
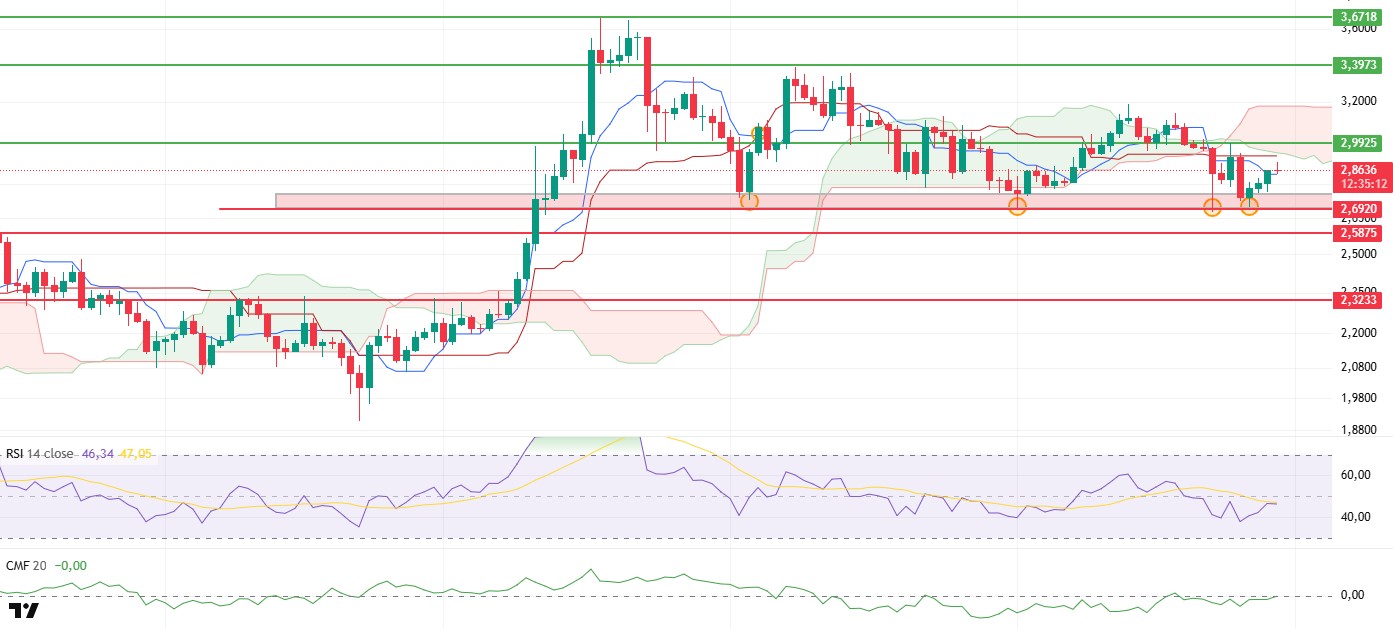
Last week, the XRP price retreated to the support area marked with a red box and rebounded from this zone, rising to the $2.85 level. This movement shows that despite the continued strong selling pressure, buyers stepped in, particularly at critical levels, to support the price, indicating that short-term recovery efforts are ongoing. The fact that the price reacted strongly from this area even when selling intensified in the market confirms that buyers still form an important line of defense.
Looking at technical indicators, the Chaikin Money Flow (CMF) indicator rising to the zero line after a long hiatus is noteworthy. This suggests that liquidity is returning to the market and selling pressure has eased somewhat. This recovery in liquidity stands out as important data that could support short-term upward price movements. In the Ichimoku indicator, the price gaining the tenkan level shows that short-term positive signals have strengthened and that upward attempts may continue. However, the fact that the price is still trading below both the kijun level and the kumo cloud confirms that the main trend remains negative. This outlook emphasizes that short-term buying attempts are possible, but stronger technical confirmation is needed for the trend to turn completely positive.
The Relative Strength Index (RSI) indicator is also giving recovery signals. Its upward movement from levels close to the oversold zone indicates that momentum is regaining strength. This picture shows that buyers have started to move again to push the price up and that a healthier ground for an upward movement is beginning to form in technical terms.
In the overall outlook, it is crucial for the XRP price to maintain the support area indicated by the red box. As long as it remains above this area, the price can be expected to attempt upward movements. The $2.99 level is particularly important in this process. Breaking above this level could accelerate the upward movement and push the price to higher resistance zones. However, if the red support area is lost, the likelihood of selling pressure accelerating again and the price experiencing much steeper pullbacks will increase. Consequently, whether the price maintains the red box support in the short term stands out as the most important factor determining the market’s direction. Sustained trading above $2.99 would strengthen the bullish scenario, while a loss of the support zone could accelerate declines and push XRP to deeper levels.
Supports: 2.7287 – 2.5875 – 2.3233
Resistances: 2.9925 – 3.3973 – 3.6718
SOL/USDT
Last week in the Solana ecosystem,
- Helius Medical Technologies, Inc. purchased over 760,190 Solana tokens at $231 each, using $335 million in cash for its digital asset arbitrage strategy.
- Fragmetric will launch the first Solana DAT for the South Korean market.
- ‘BITWISE SOLANA ETF SHS’ was added to the DTCC website with the BSOL ticker.
- Kazakhstan launched its national stablecoin on Solana with Mastercard’s support.
- Fitness equipment retailer Fitell Corporation (NASDAQ: FTEL) is moving into the cryptocurrency sector with a $100 million Solana treasury and is changing its brand name to “Solana Australia Corporation.”
- DeFi Development Corp has increased the size of its current share buyback to $100 million.
- Canary has submitted an updated version of its S-1 filing for a spot Solana ETF to the U.S. Securities and Exchange Commission (SEC).
- VanEck has updated the application documents for its Solana Spot ETF.
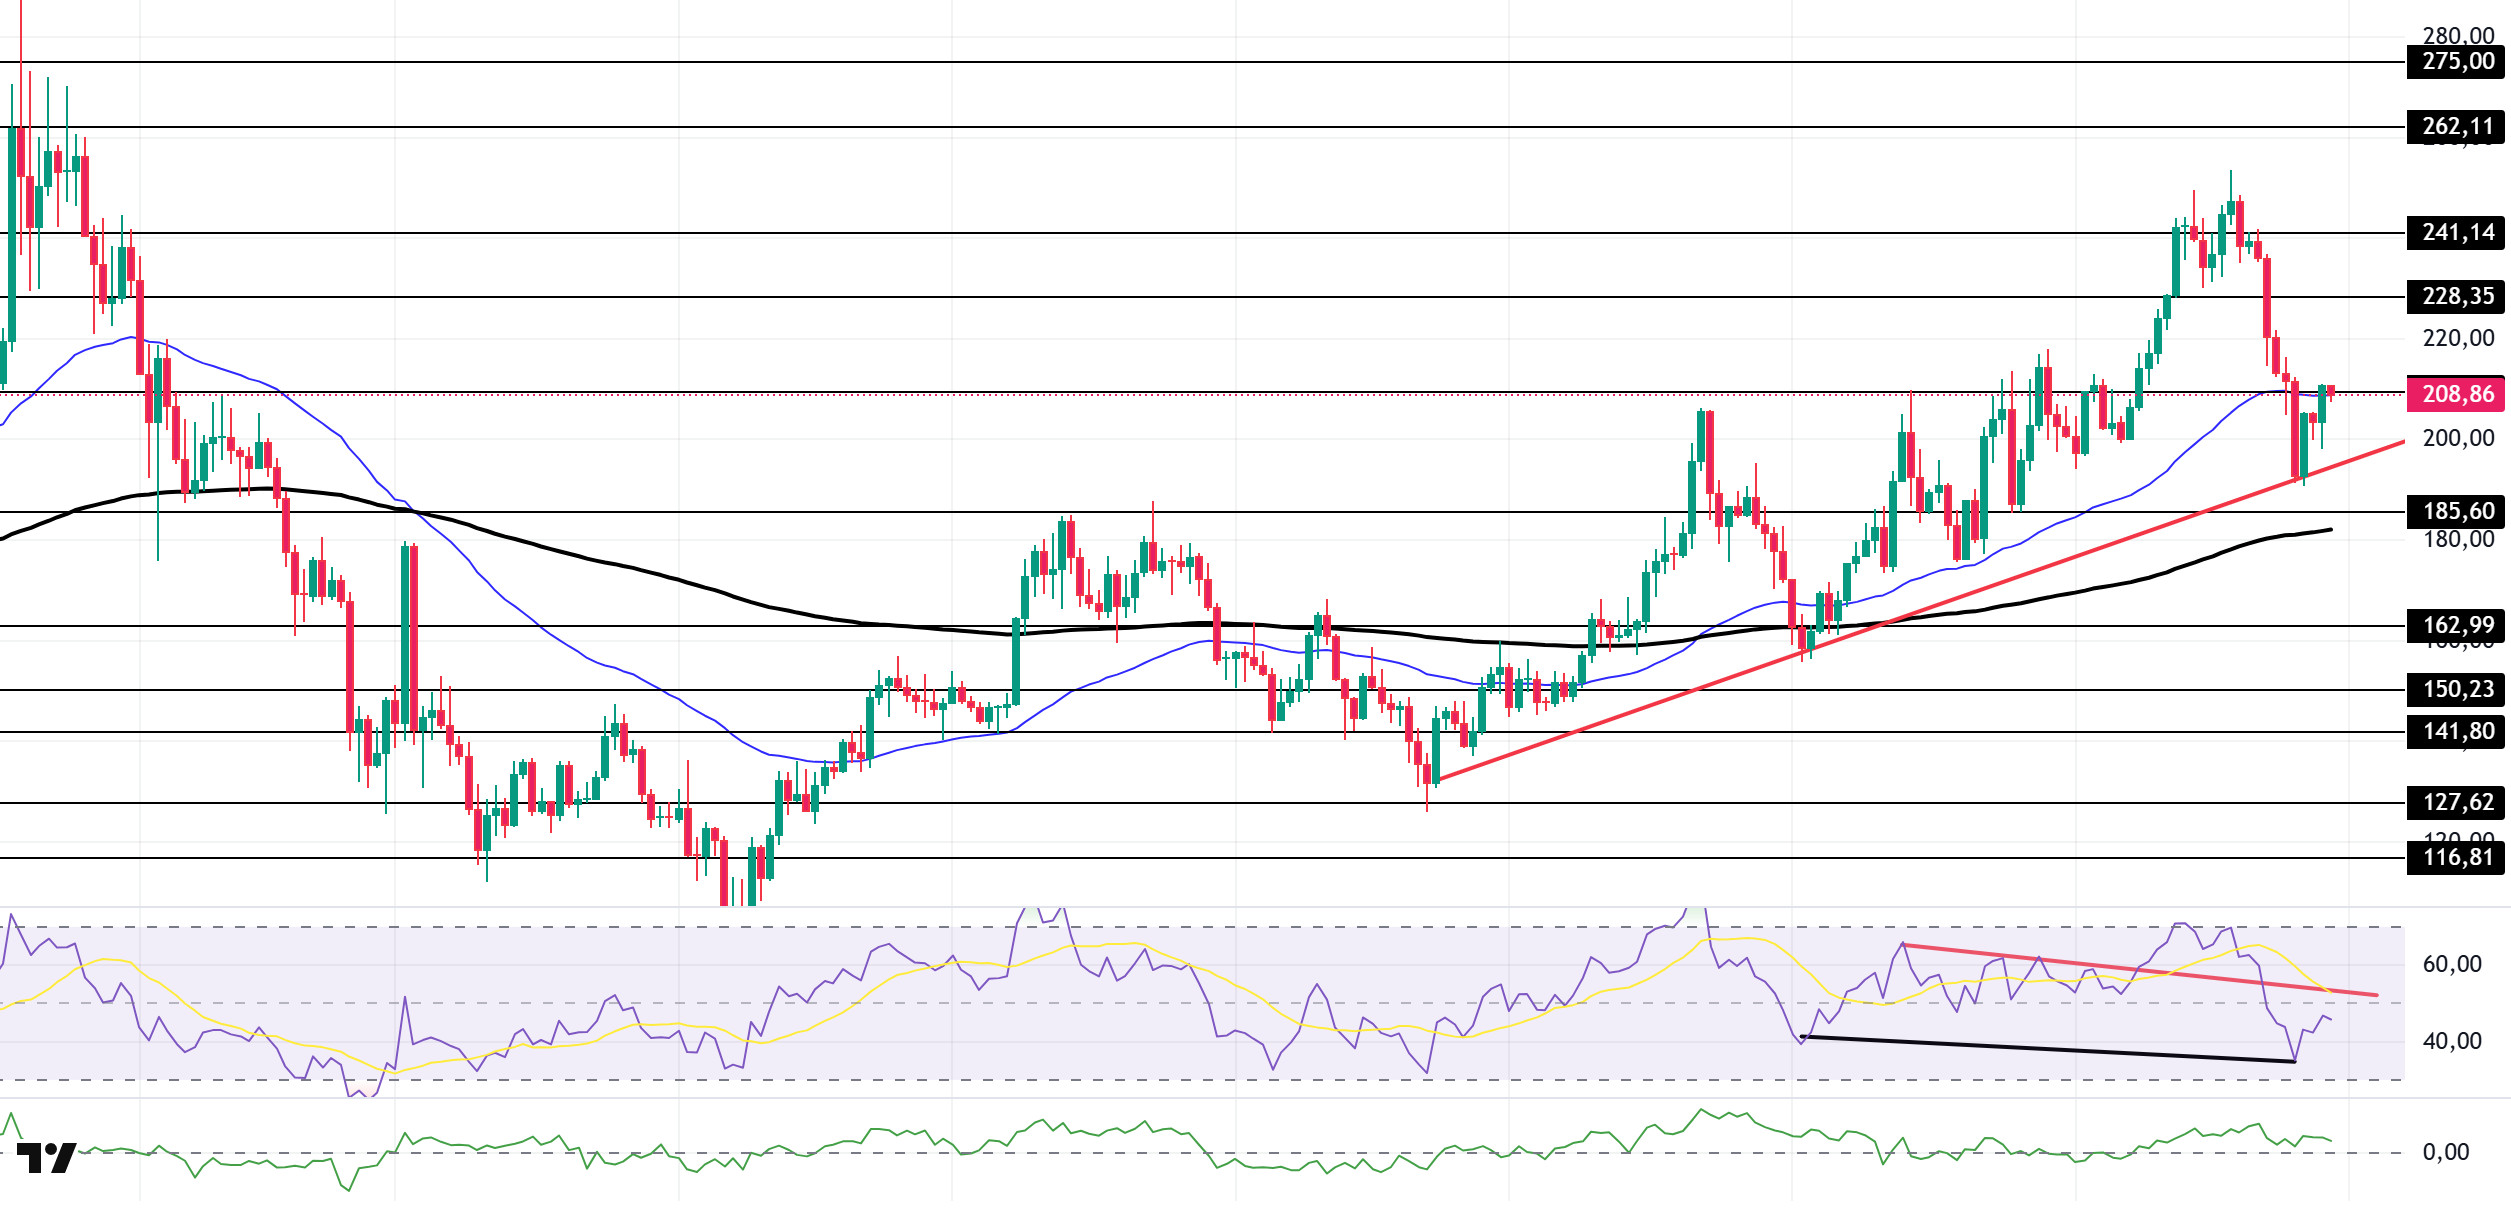
The SOL price has fallen by approximately 12% on the daily chart this week. The asset managed to stay in the upper region of the rising line that began on June 23. The price, supported by the base level of the rising line, is currently testing the strong support level of $209.39 while maintaining its momentum. It could test the rising line with candle closes below this level. If it continues to rise, it could climb to the $262.11 level seen on January 20 and form a cup pattern.
The asset is trading above its 50 EMA (Exponential Moving Average – Blue Line) and 200 EMA (Black Line) moving averages, indicating that the asset is in an uptrend. Furthermore, the 50 EMA continuing to sit above the 200 EMA signals the continuation of a technical “golden cross” formation. This indicates that the potential for upward movement continues in the medium term. On the other hand, the large gap between the two moving averages increases the likelihood of a sideways movement or decline. The RSI (14) has fallen to negative levels. At the same time, the indicator remained below the downward trend line that began on August 13. This indicates that selling pressure continues. On the other hand, there is a positive divergence. Chaikin Money Flow (CMF-20) remains in positive territory; at the same time, the increase in cash inflows could push the CMF-20 indicator to the upper levels of the positive zone. If macroeconomic data remains positive and developments in the ecosystem continue to be favorable, the first major resistance level of $228.35 could be retested. Conversely, in the event of potential negative news flow or deterioration in macro data, the $285.60 level could be monitored as a potential buying opportunity.
Supports: 209.39 – 185.60 – 162.99
Resistances: 228.35 – 241.14 – 262.11
DOGE/USDT
- Grayscale has filed to convert the Dogecoin Trust into an ETF.
- ’21SHARES DOGECOIN ETF SH BEN INT’ has been added to the DTCC site with the ticker TDOG.
- The director of the Dogecoin Foundation stated that it is time to create tools to take Dogecoin’s usability for traders to the next level.
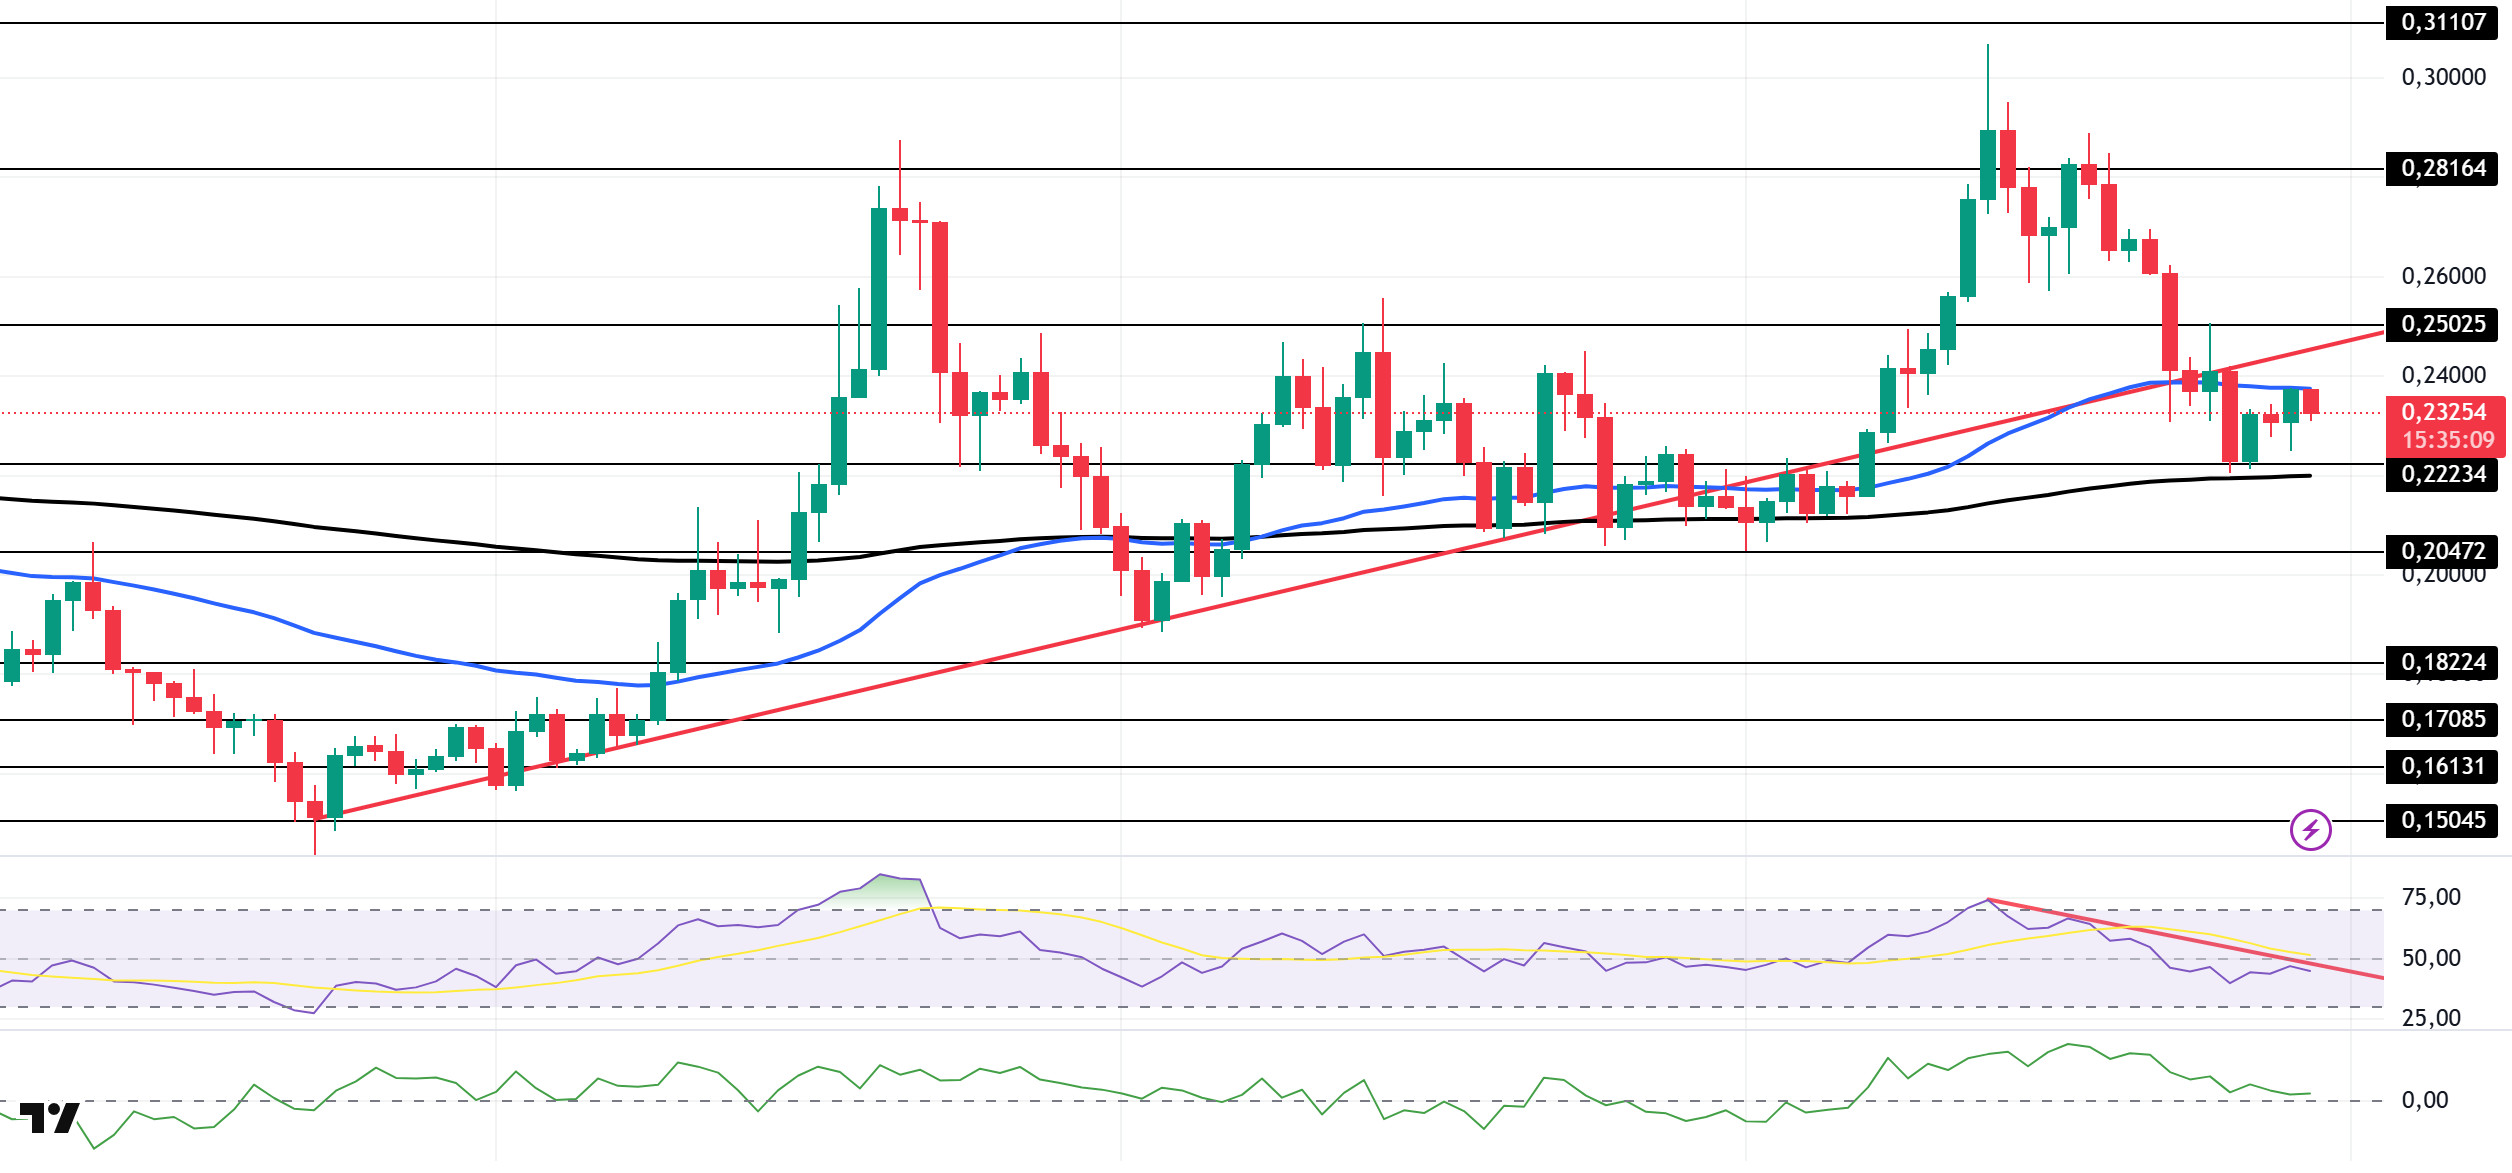
On the daily chart, DOGE has fallen approximately 11% since last week. Testing the strong resistance level of $0.25025, the price continued to retreat and tested the 200 EMA (Black Line) moving average as support, gaining slight momentum from there and rising. It is currently testing the 50 EMA (Exponential Moving Average – Blue Line) moving average as resistance. If the candle closes below the 50 EMA moving average, the decline could deepen, leading to a move below the 200 EMA (Black Line) moving average. If the uptrend begins, it could retest the $0.28164 level.
The asset is trading between the 50 EMA (Blue Line) and 200 EMA (Exponential Moving Average – Black Line) moving averages. This indicates that the asset is in a decision-making phase. On the other hand, the 50 EMA continues to be above the 200 EMA, indicating that the “golden cross” formation is continuing. This also signals that upward pressure may continue in the medium term. The Chaikin Money Flow (CMF–20) indicator remained in positive territory. Money inflows, however, continue to decline. This could push the CMF-20 into negative territory. Looking at the Relative Strength Index (RSI-14) indicator, it has been retreating from the overbought zone towards negative levels, continuing to remain in the lower region of the downtrend that has been ongoing since September 13. This indicates that selling pressure continues. In the event of macroeconomic risks or negative news from the ecosystem, the $0.20472 level can be monitored as strong support. On the other hand, if the upward movement gains strength, the $0.28164 level comes to the fore as the first strong resistance level.
Supports: 0.22234 – 0.20472 – 0.18224
Resistances: 0.25025 – 0.28164 – 0.31107
TRX/USDT
Last week, Tron founder Justin Sun announced that the logo had been revamped to mark the network’s 8th anniversary. Redesigned according to the golden ratio principle and rotated eight degrees to symbolize the eighth year, this new logo represents the first major brand change since its launch in 2017.
Last week, the TRON network generated a total of $53 million in revenue, continuing to be the highest-earning ecosystem among all blockchain networks. Maintaining this momentum is critical to solidifying TRON’s leadership in the DeFi and stablecoin ecosystems.
During the week of September 22-28, 2025, a total of 25.2 million TRX were burned on the TRON network. Despite this, the circulating supply increased by 2.2 million. The increase in circulating supply creates inflationary pressure on TRX. Additionally, the total number of addresses also increased by 1.4 million to 335.1 million during the same week.
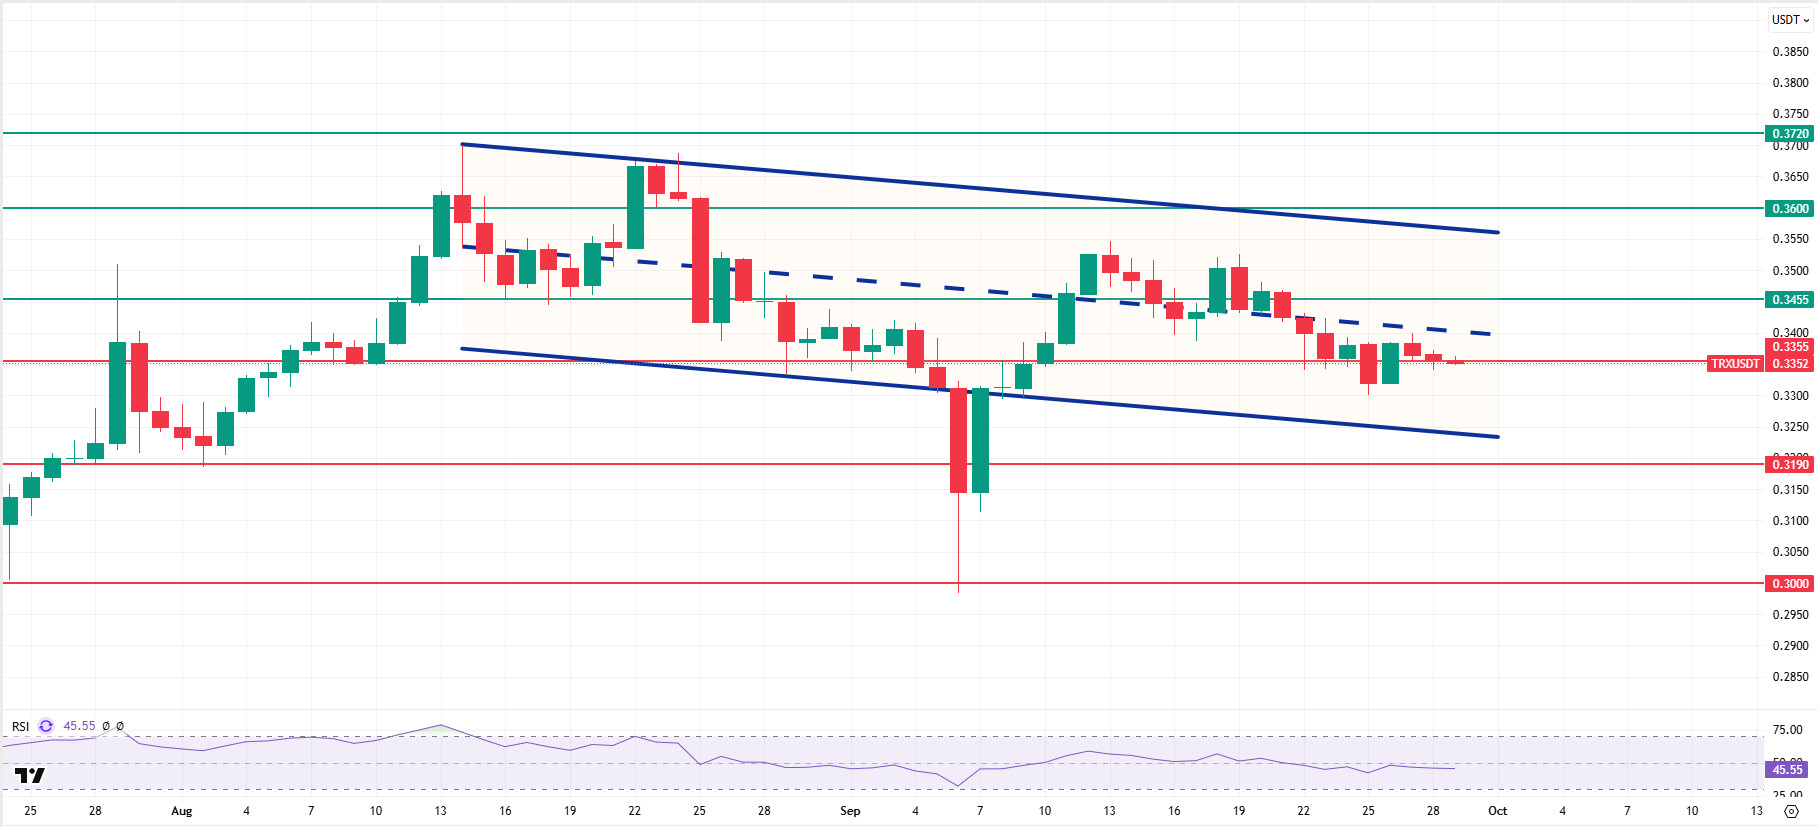
Technically speaking, TRX started last week at 0.3424 and closed the week at 0.3356, falling approximately 2% over the course of the week. Thus, it has completed its second consecutive week of decline, with its market value falling to $31.8 billion. Currently trading at 0.3352, TRX is just below the middle band of the bearish channel on the daily chart and is attempting to break the 0.3355 support level. The Relative Strength Index (RSI) value is also observed to be in the sell zone at 45. Considering its position within the bearish channel and the RSI indicator, the TRX price may rise slightly. This indicates that it may want to move towards the upper band of the channel. In such a case, it may test the 0.3455 resistance. If it closes above the 0.3455 resistance on a daily basis, it may want to test the 0.3600 resistance. If it fails to close above the 0.3455 resistance level and selling pressure increases in the market, it may decline due to potential selling from this area. In such a case, it may move towards the lower band of the bearish channel and test the 0.3190 support level.
The 0.3000 level is being monitored as a critical support point on the daily chart. Sustaining above this level could maintain the uptrend, while closes below it could lead to increased selling pressure and deeper downward price movements.
Supports: 0.3355 – 0.3190 – 0.3000
Resistances: 0.3455 – 0.3600 – 0.3720
AVAX/USDT
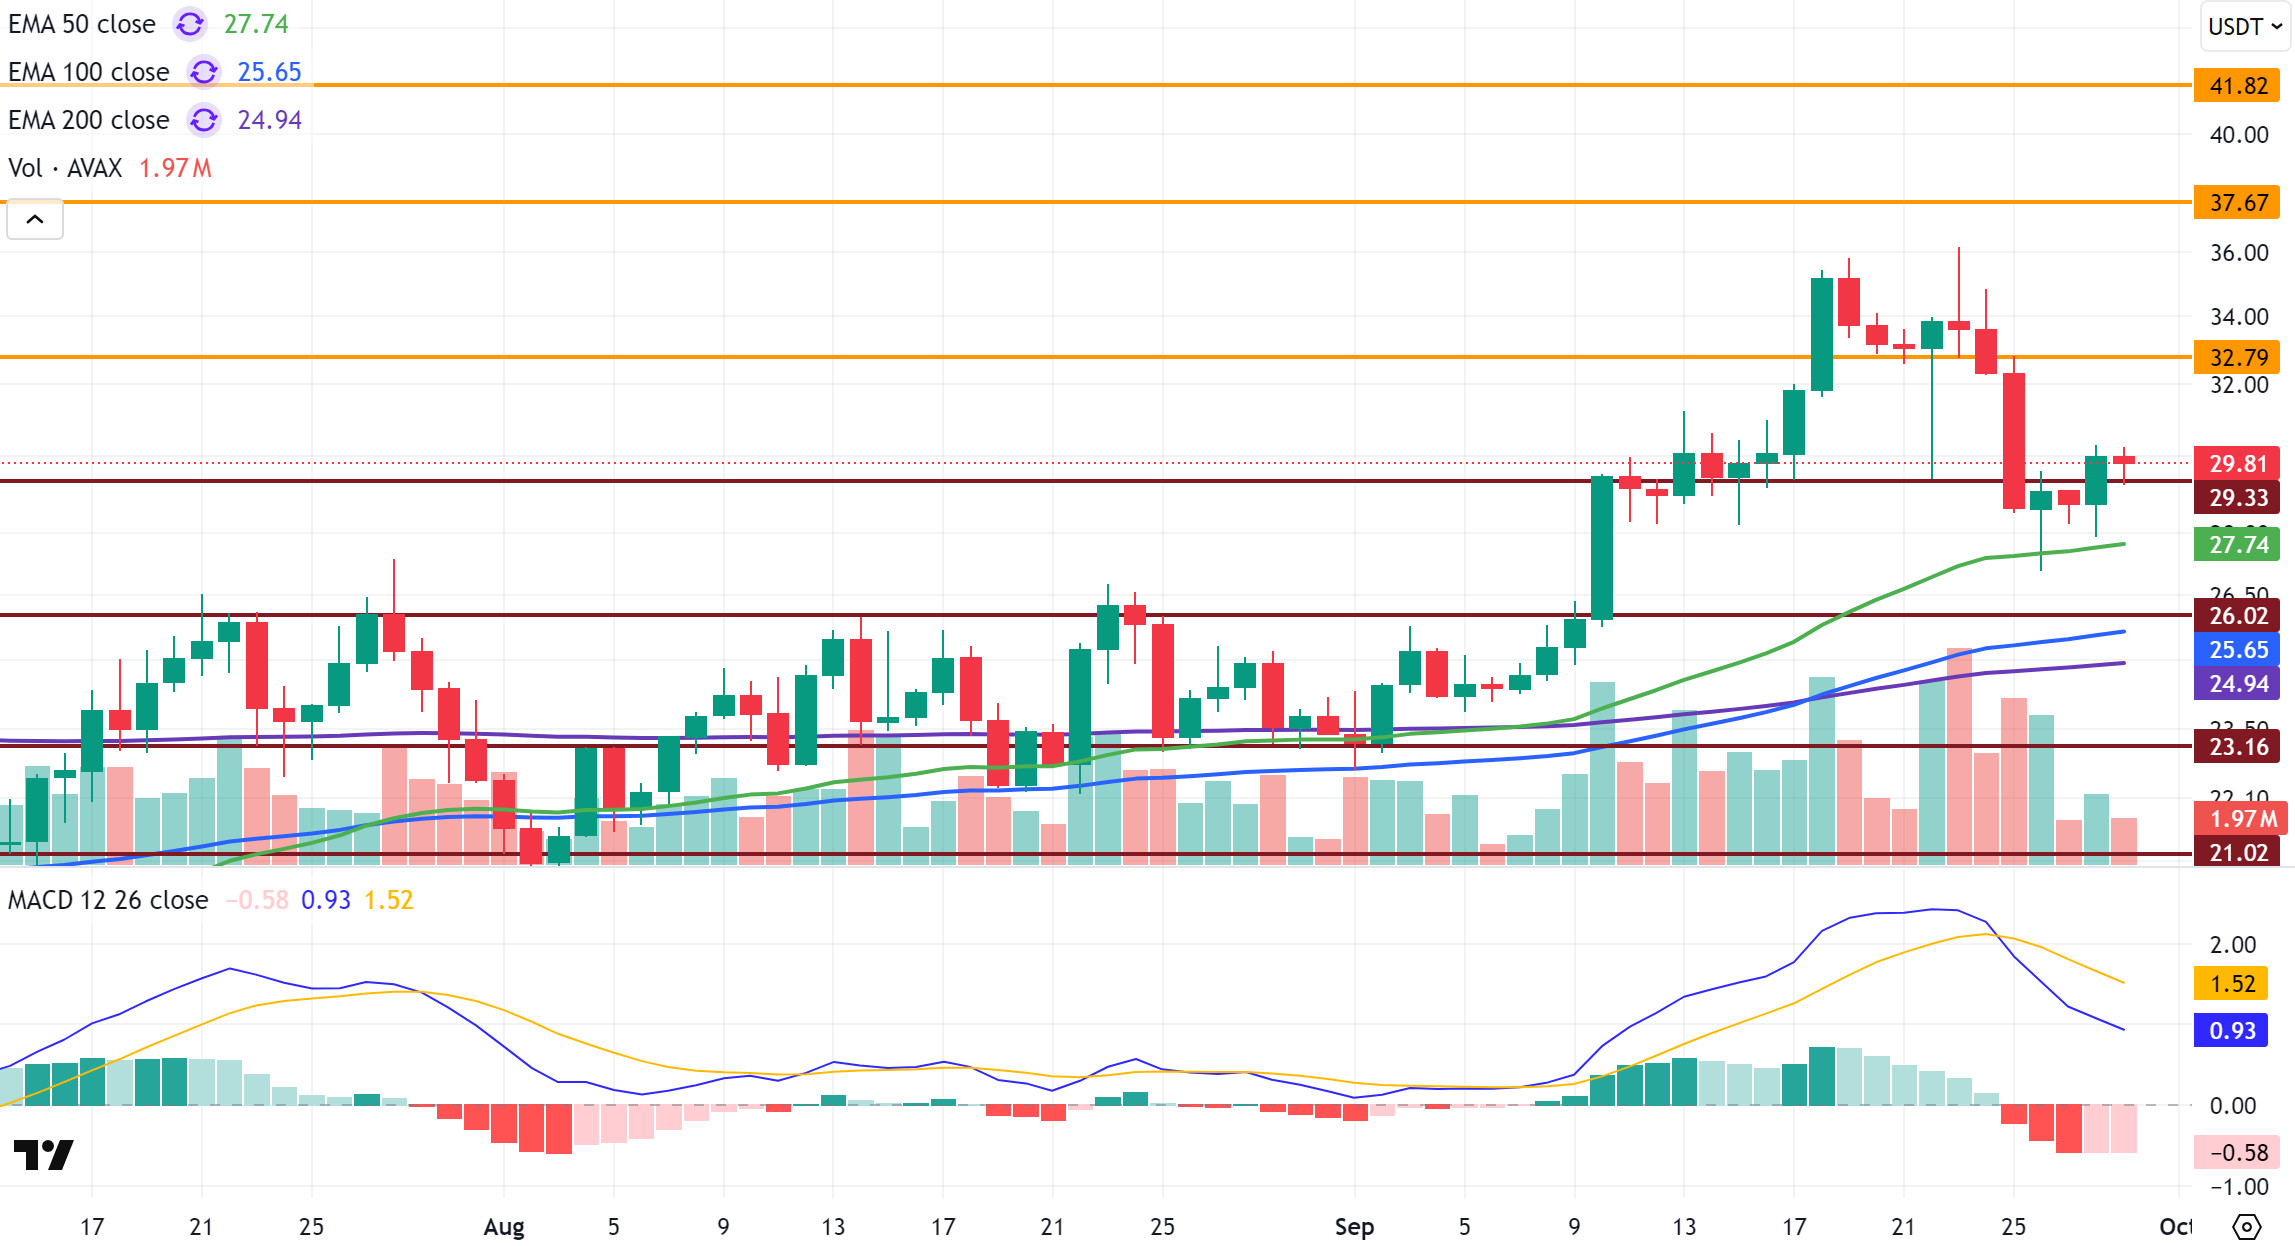
Starting last week at $33.05, AVAX rose to $36 during the week before falling back to $27 in line with the sharp selling pressure seen across the cryptocurrency market. AVAX then recovered with buying from the 50-period Exponential Moving Average (EMA50) level and closed the week at $30.01, thus experiencing an approximate 9.17% loss in value on a weekly basis. On the ecosystem side, while initiatives involving real-world assets (RWA) on Avalanche and the increase in transaction volume continued to attract attention, the negative sentiment prevailing in the market overall suppressed AVAX’s rise.
On the daily chart, the Moving Average Convergence/Divergence (MACD) line continued its downward trend, crossing the signal line and causing the decline to deepen. Although the MACD currently remains in positive territory, its position below the signal line indicates weak momentum. This limits the potential for gains. On the other hand, AVAX still trading above critical Exponential Moving Average (EMA) levels supports the positive outlook. Looking at the overall picture, a clear direction has not yet formed.
In the coming period, if momentum continues to weaken, AVAX may retest the $29.33 support level. If it closes below this level, the probability of a pullback to the critical support at $26.02, followed by $23.16 and $21.02, will increase. Conversely, if strong buying comes into play, closing above the $32.79 level could revive the uptrend. In this scenario, the $37.67 and $41.82 resistance levels could come into play. The overall picture shows a negative MACD and a positive EMA. This indicates that AVAX has not yet found a clear direction. Maintaining stability above $30 and confirming positive momentum are critical for the resumption of the uptrend. Otherwise, selling pressure could intensify.
(EMA50: Green Line, EMA100: Blue Line, EMA200: Purple Line)
Supports: 29.33 – 26.02 – 23.16
Resistances: 32.79 – 37.67 – 41.82
LTC/USDT
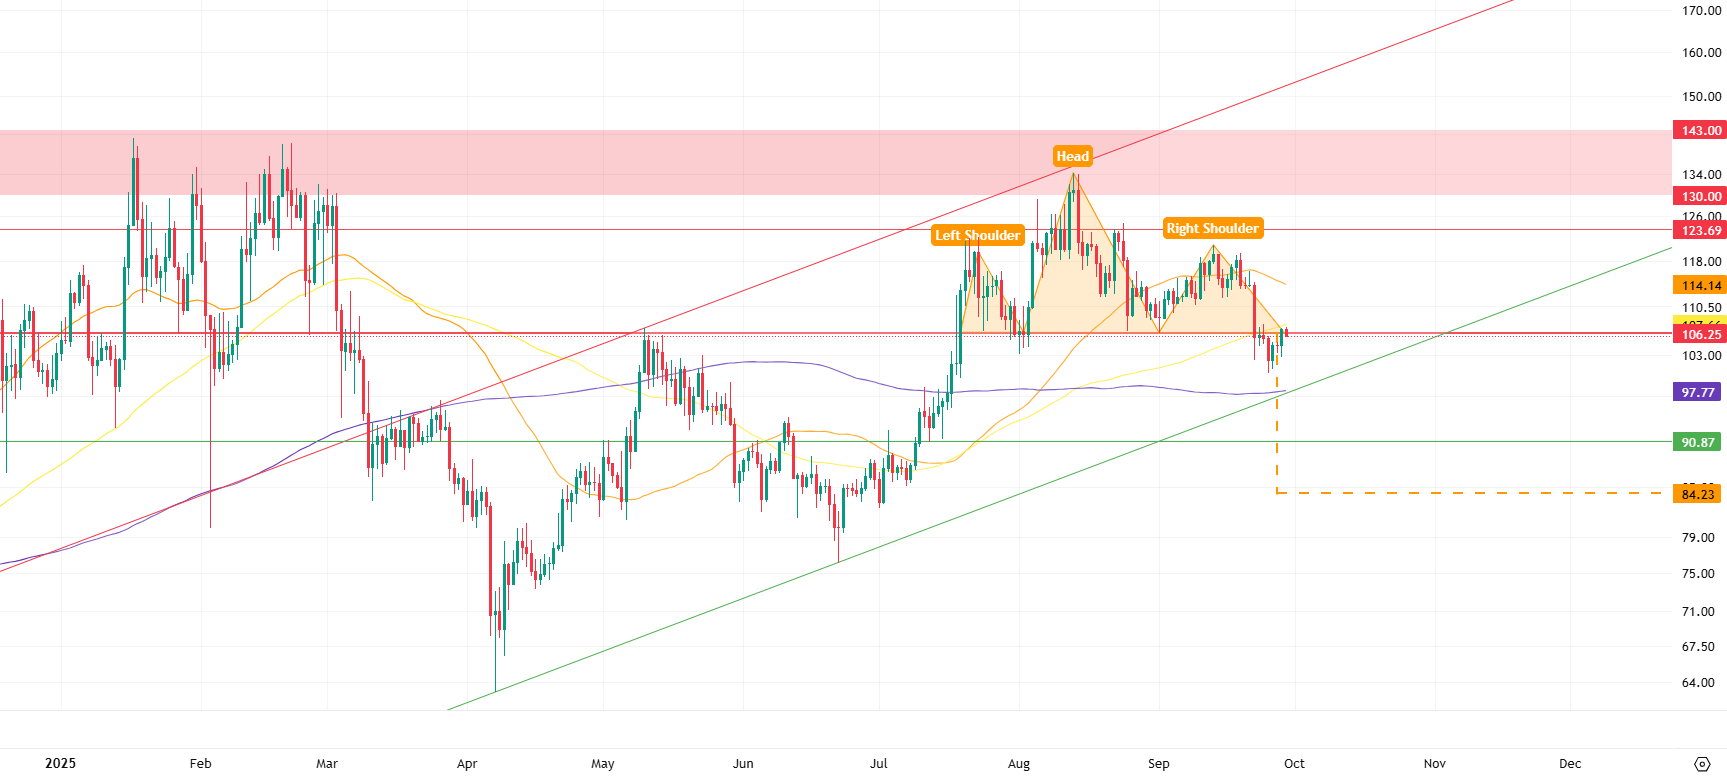
LTC ended last week with a 6.25% decline and started the new week at $106.88. LTC also lost 3.84% against Bitcoin during the same period, with its market value falling to approximately $8.1 billion and maintaining its 20th place in the market capitalization ranking. Open positions in futures trading decreased by 15.3% compared to the previous week, while funding rates continued their positive trend. The majority of positions observed on centralized exchanges in the liquidation map are short positions, liquidated at $110.4, while most of the long-weighted positions opened on the DeFi side are liquidated at $84.2. Overall, the table shows a clear divergence in direction between investors trading on centralized exchanges and DeFi users. However, due to the large concentration of Litecoin trading volume on centralized exchanges, it can be said that centralized exchanges are in a decisive position in terms of total position size.
On the technical side, Litecoin is trading above the 200-period (purple) moving average but below the 50-period (orange) and 100-period (yellow) moving averages. The former horizontal support at $106.25 has broken down sharply and turned into resistance, continuing to exert pressure on the price. Breaking through this resistance and maintaining a position above it is critical for Litecoin. Otherwise, the continuation of the downward price formation is likely. A possible breakout of resistance could initially push the price up to $114.14 (the selling pressure created by the 50-period moving average). The positioning of large-scale liquidations near these levels increases the possibility of a short squeeze in the region. Above the 50-period moving average, the horizontal resistance at $123.69 could emerge as a new selling zone.
The current outlook indicates a Head & Shoulders formation that could generate downward momentum, and the structure remains intact. In this scenario, the first point to monitor will be the 200-period moving average at $97.77, which also serves as the rising trend support. If this support breaks, the formation’s target of $84.23 could come into play. However, within this bearish scenario, the price could attempt a temporary rebound by finding support at the horizontal support zone around the 90.87 dollar level.
Supports: 97.41 – 90.87 – 84.23
Resistances: 106.25 – 114.14 – 123.69
BNB/USDT
Looking at the key developments this week, the HEMI, XPL, MIRA, FF, and EDEN projects in the BNB ecosystem have been listed on Binance Launchpool. These listings are expected to increase demand for BNB, which is used for transaction fees, and reduce the circulating supply through users staking BNB. This situation is expected to have a generally positive impact on the price of BNB.
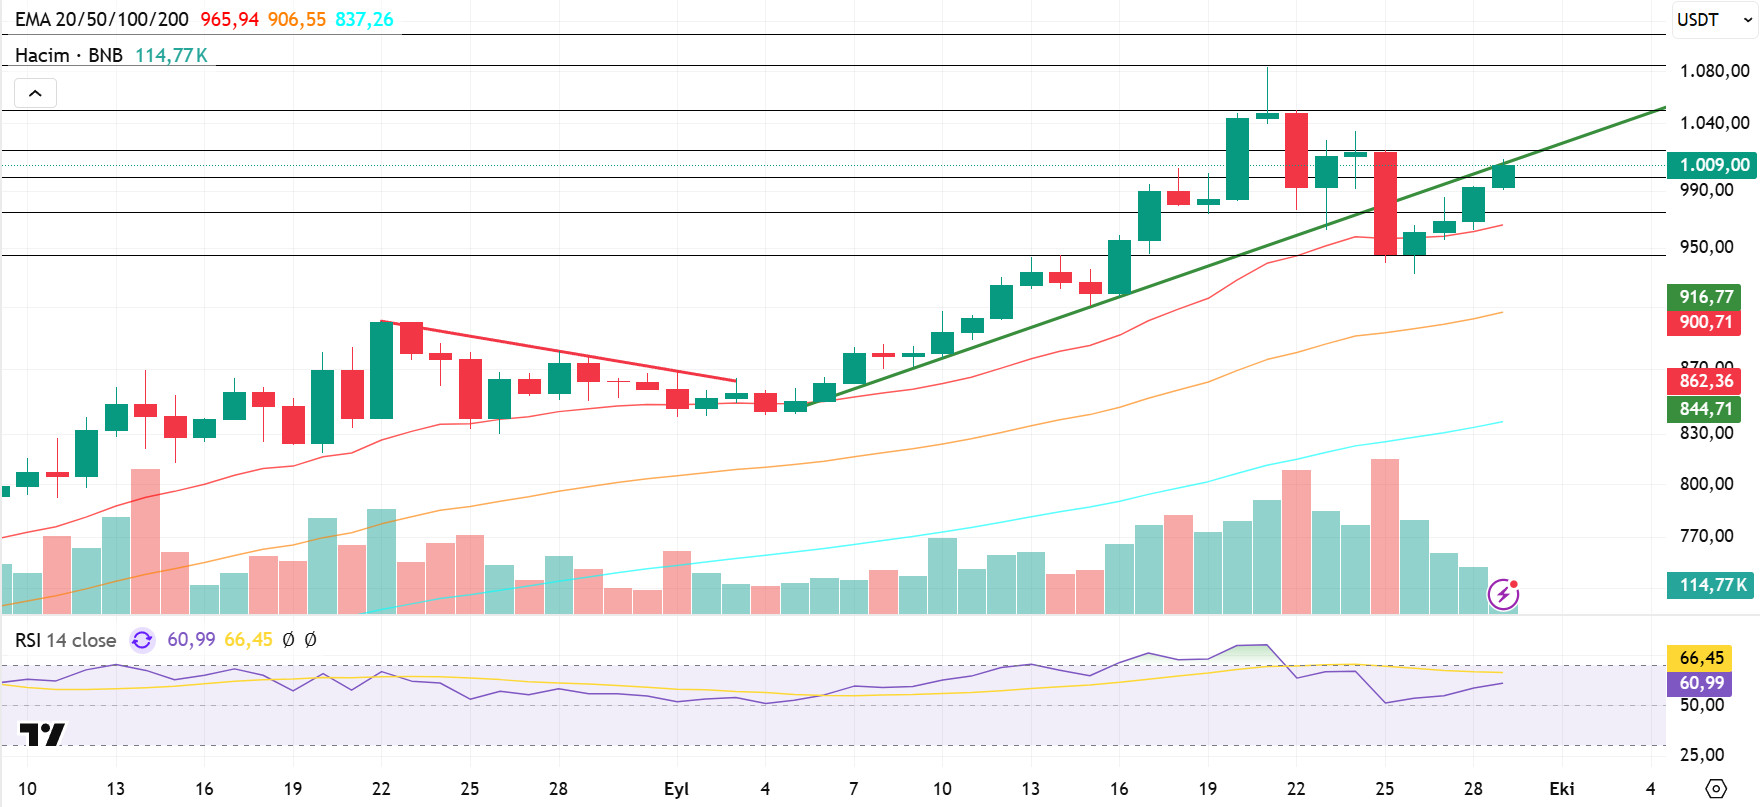
From a technical perspective, BNB/USDT, which ended its correction movement starting from the previous all-time high (ATH) of $1,083 at the $940 level, continued its rise with strong support from this region and climbed back above $1,000.
Technical indicators for BNB/USDT, currently trading in the $1,000–$1,020 range, show that the recent increase in trading volume has supported buying. This picture indicates that the positive outlook in the market is gaining strength. Furthermore, the Relative Strength Index (RSI) fell to the 50 level following recent pullbacks; however, it found support at these levels and resumed its upward trajectory. This technical structure indicates that positive momentum in BNB is strengthening.
Within the current outlook, if buying appetite is maintained, BNB is expected to test the $1,020 resistance level in the first stage. If this level is exceeded, the price may move towards the $1,050 and $1,080 levels, respectively. On the other hand, if selling pressure increases, the price may retreat back to the $1,000 support level ( ). If this level is broken downward, the $975 and $945 levels emerge as critical areas to monitor.
Supports: 1000 – 975 – 945
Resistances: 1020 – 1050 – 1080
LINK/USDT
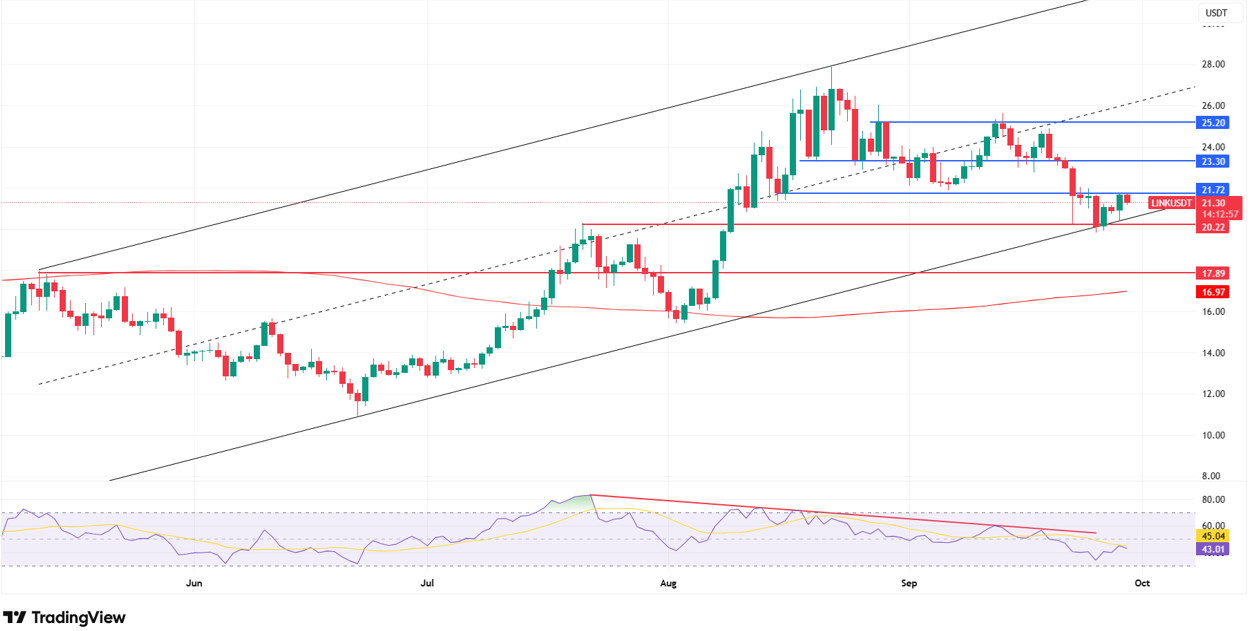
The LINK price has been maintaining its upward channel structure since June 22, continuing its upward movement by making its third contact with the lower band of the channel. However, with the recent selling pressure, the critical support level of 21.85 mentioned last week was broken downward, and the price retreated to the 20.22 level, as we had predicted. This area worked on the first test, bringing buyer reaction, and the price rebounded above the 21.00 level. However, this rise has been limited for now, and reactionary buying failed to gain strength as the price could not sustain itself above 21.85.
An important point to note on the chart is that after losing the channel’s middle band, the price is currently trending towards the channel’s lower band. This increases the critical importance of the 20.22 support level. If this area is tested again and breaks down, the price could potentially retreat to the 17.89–16.97 range, supported by the lower band of the channel. This area is a highly critical demand zone for maintaining the main trend in the medium to long term.
On the upside, the 21.72–21.85 range stands out as the nearest resistance zone. It is difficult to talk about strong upward momentum unless prices remain above this level. Four-hour closes above 21.85 could push prices to the 23.30 level first. If sustainability is achieved here, a new wave of upward movement towards the 25.20 and then 27.00 levels can be expected. In particular, volume-supported daily closes in the 24.00–25.20 range will ensure that the upward movement is more sustainable and stronger.
On the Relative Strength Index (RSI) side, the indicator is still at the 45 level and shows weak recovery efforts. The pullback that occurred after the negative divergence formed in the previous process has taken place as expected . Now, for a strong momentum confirmation, the RSI needs to rise above at least 55. Otherwise, the current rises may remain limited reaction movements.
Supports: 20.22 – 17.89 – 16.97
Resistances: 21.72 – 23.30 – 25.20
SUI/USDT
This week, there were significant and noteworthy developments in the Sui (SUI) ecosystem. In particular, Sui’s collaboration with Google and changes in its token supply resonated in the cryptocurrency market.
First, Sui was selected as a launch partner in Google’s Agentic Payments Protocol initiative. This partnership is significant not only for the Sui network but also for the entire cryptocurrency world. The selection of a giant technology company like Google as a partner in such an initiative demonstrates that Sui has become a recognized network at the corporate level. Google’s vast user base and reputation in the industry will help Sui gain wider acceptance and strengthen the network.
On the other hand, it was announced that approximately 10.9 million tokens will be unlocked on the Sui network. Such a large token release can often cause noticeable price movements in the market. In this case, an oversupply may occur in the market, and volatility may be observed in the Sui coin. The release of tokens from lock-ups could be a significant factor that could put pressure on the Sui price, especially in the short term.
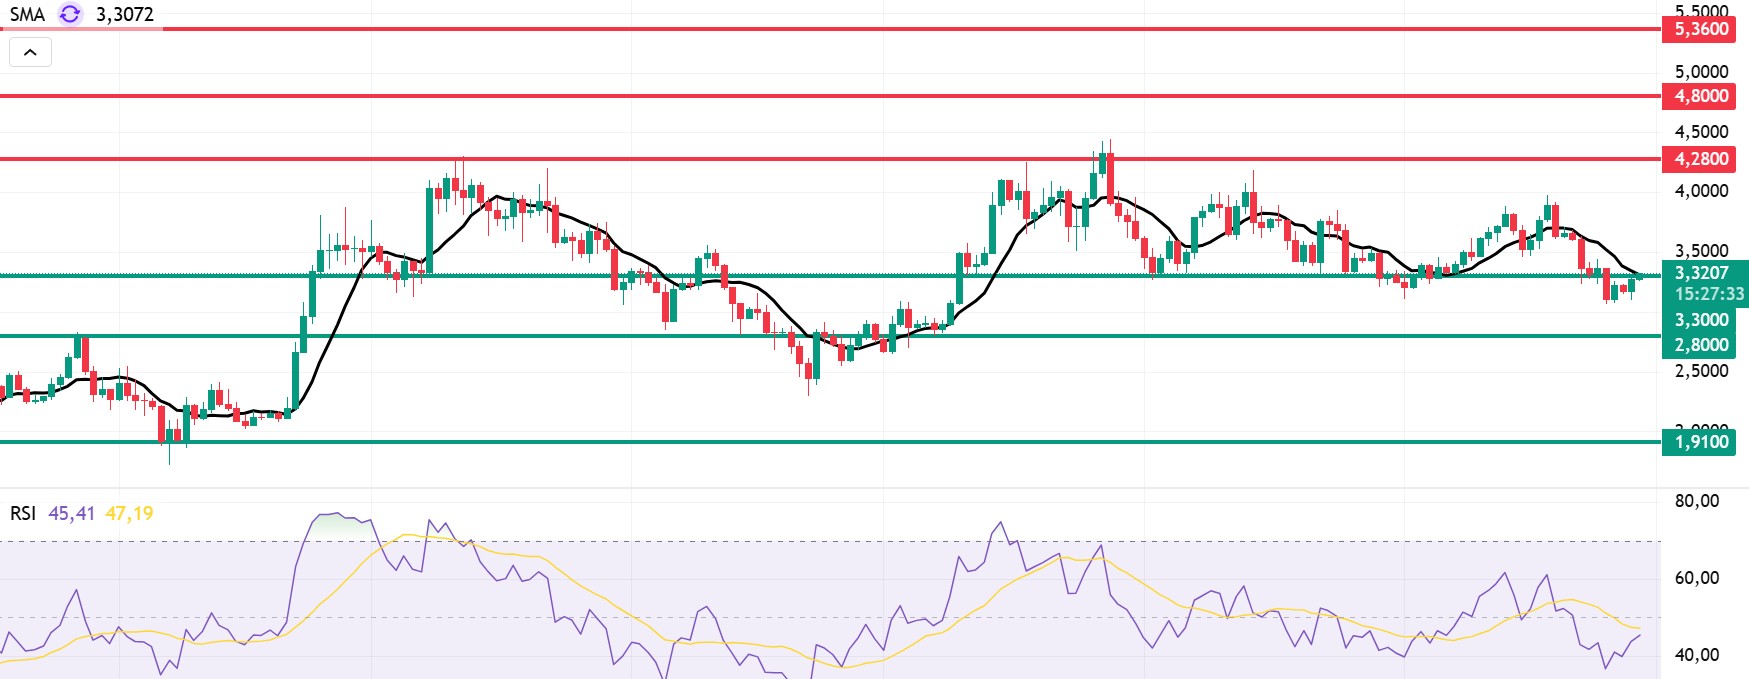
Following recent developments, when we look at Sui’s technical outlook, we see that the price has fallen on a weekly basis, moving sideways at around $3.32, influenced by fundamental developments. The Relative Strength Index (RSI) is currently in the 45.41 – 47.19 range. This range indicates that the market is trading close to the sell zone; however, if the RSI weakens and falls to the 35.00 – 40.00 range, it could signal a potential buying point. If the price moves upward, the resistance levels of $ , $4.28, $4.80, and $5.36 can be monitored. However, if the price falls to new lows, it could indicate that selling pressure is intensifying. In this case, the support levels of $3.30, $2.80, and $1.91 come to the fore. Based on the trend line, a pullback to $2.80 appears technically possible. According to Simple Moving Averages (SMA) data, Sui’s average price is currently at $3.30. The price remaining above this level indicates that the current uptrend could technically continue.
Supports: 1.91 – 2.80 – 3.30
Resistances: 4.28 – 4.80 – 5.36
ADA/USDT
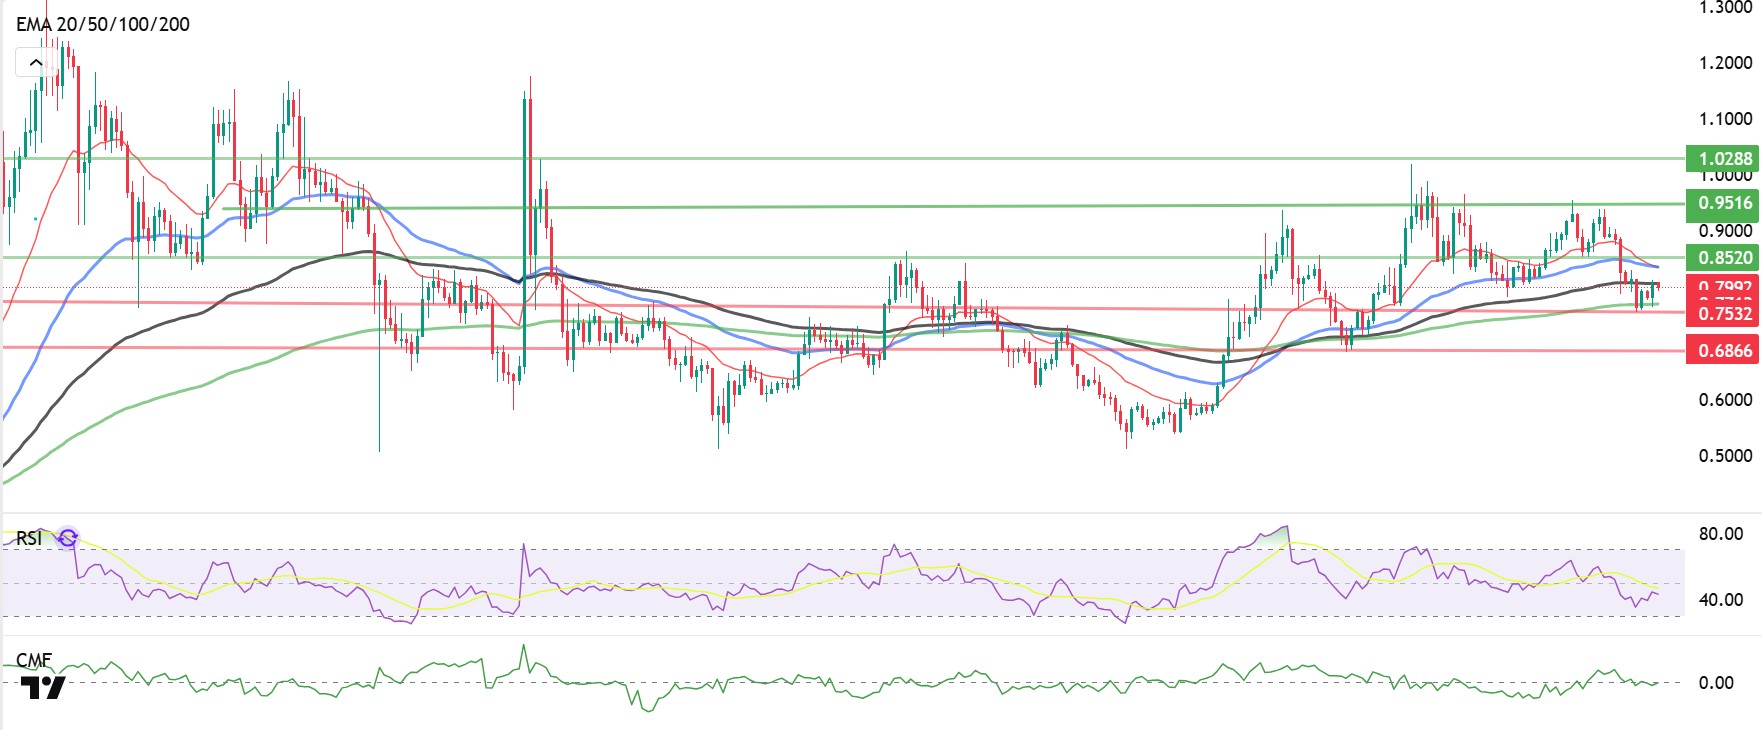
The Cardano Foundation announced that it will focus on integrations, listings, and real-world asset (RWA) support, and plans to adopt the latest payment framework, x402. As of this week, ADA signaled a positive regulatory stance toward digital assets in the US and new developments. The ADA price experienced negative days this week following the FED decision, falling during the day and liquidating short positions at the 0.7710 level. The ADA price continues to trade at 0.7986 levels, down 2.22% this week. The 20-day Exponential Moving Average (EMA 20 – Red Line) and (EMA 50 – Blue Line) closed below the price, falling below all moving averages. The price has been in a downtrend since the day it fell below the 100-day Exponential Moving Average (EMA 100 – Black Line).
Technically speaking, on the daily chart, the ADA price could first target $0.9500 if it closes above $0.8520. If momentum continues, the $1.0245 level could be our first resistance level within the wide range. The Relative Strength Index (RSI) has risen to 50 levels, moving away from the oversold zone, while the Chaikin Money Flow (CMF-20) has risen to 0.23 levels, indicating a decrease in selling potential. The increase in money inflows may keep the CMF in positive territory, and positive signals from both indicators could herald a bullish effect. If macroeconomic data is released this week or positive news emerges regarding the Cardano ecosystem, the $0.9500 level could emerge as our strong resistance point . If a decline begins, the 0.8075 level will be the key support level we monitor.
Supports: 0.7532 – 0.7380 – 0.7170
Resistances: 1.1943 – 1.0245 – 0.950
Legal Notice
The investment information, comments, and recommendations contained in this document do not constitute investment advisory services. Investment advisory services are provided by authorized institutions on a personal basis, taking into account the risk and return preferences of individuals. The comments and recommendations contained in this document are of a general nature. These recommendations may not be suitable for your financial situation and risk and return preferences. Therefore, making an investment decision based solely on the information contained in this document may not result in outcomes that align with your expectations.