
BTC/USDT
Last week was dominated by headlines such as the resolution of the US government shutdown through compromise, disagreements among Fed members, the slowdown in the labor market, and progress in trade diplomacy. The Senate’s agreement on a temporary budget signaled the end of the six-week federal shutdown, while the White House emphasized that the economic damage was “deeper than expected.” On the Fed front, Jefferson and Williams signaled that interest rates were approaching neutral levels, while members such as Milan and Goolsbee indicated that a potential rate cut in December was still on the table. In US-China relations, the fentanyl tariff reduction and the China-Netherlands agreement on Nexperia sent positive signals for the global supply chain.
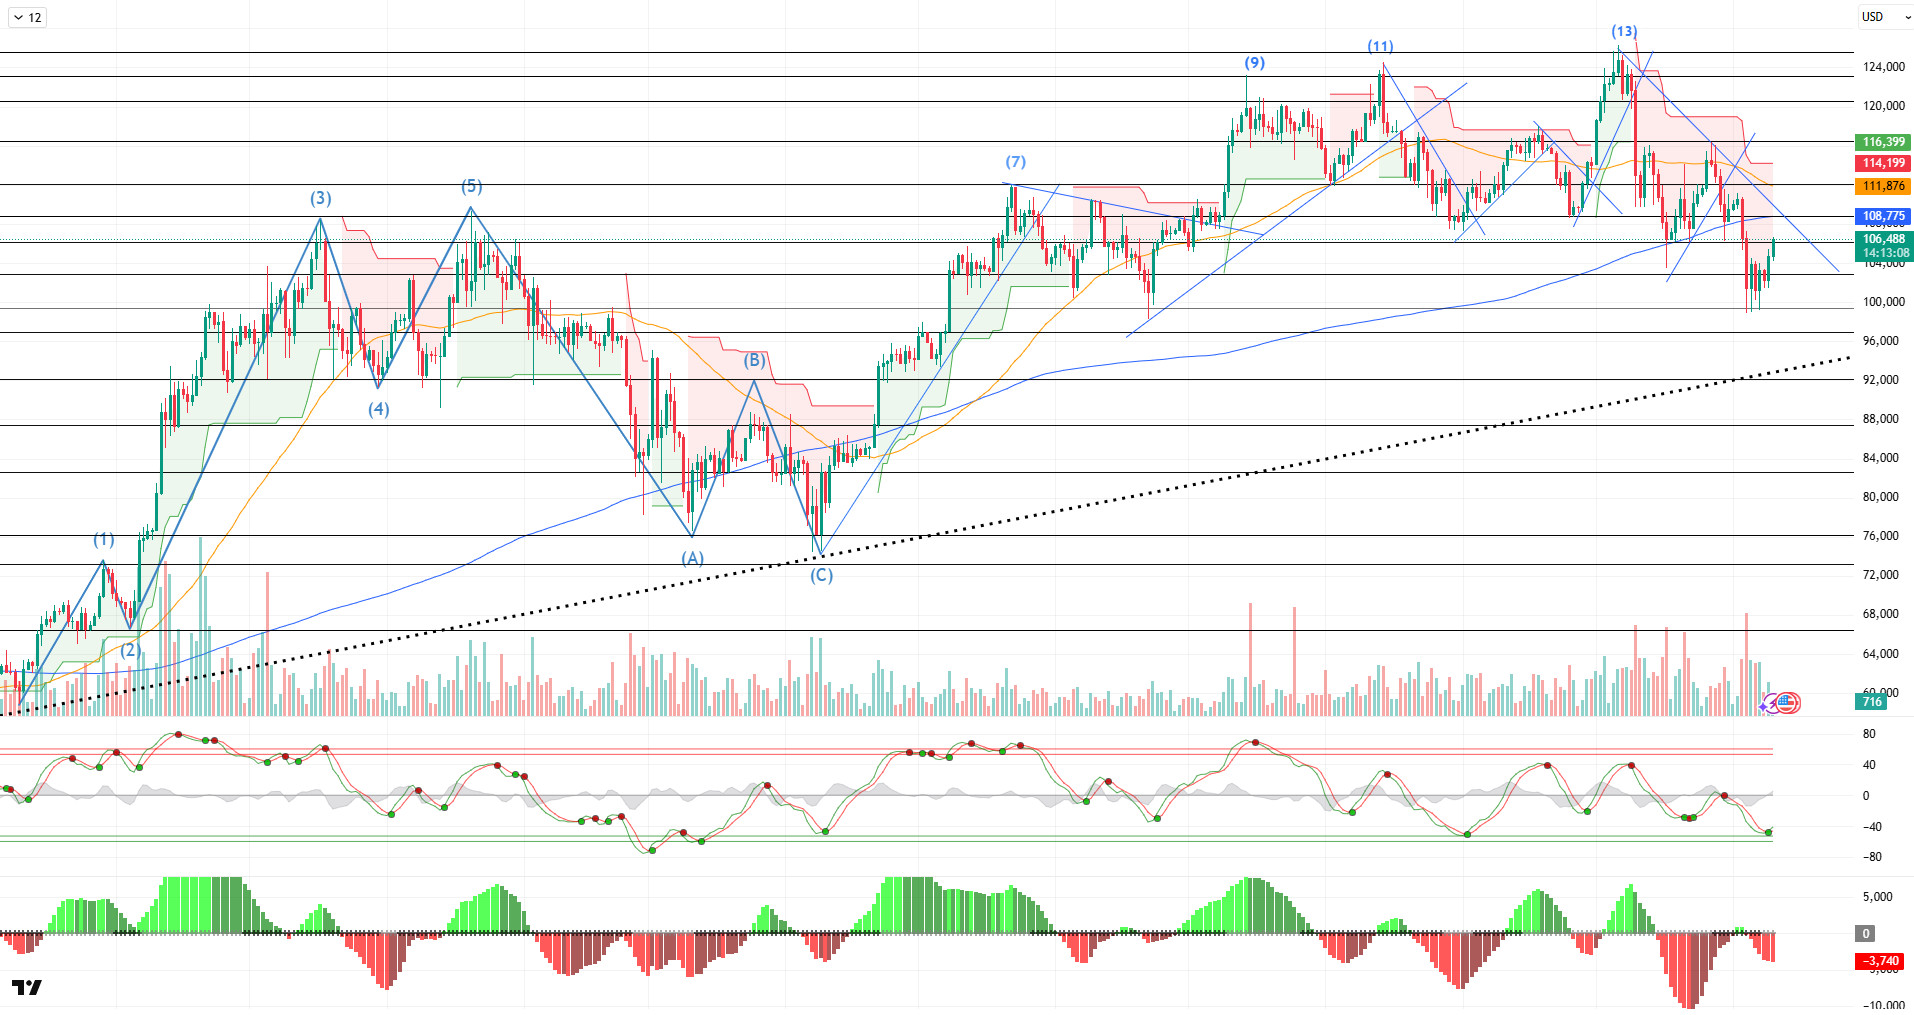
Looking at the daily technical outlook after all these developments, BTC continues its downward trend, retreating to the 99,000 level for the third time, following the golden cross pattern it reached at the 13th point and the decline from the ATH level of 126,200. With the reaction it received from there, the price, which recorded occasional interim rises and reached the 106,000 level, continues to trade below the SMA 200 level. After previous attempts to reach the peak, the price, which touched the major uptrend, regained momentum, and as of now, the gap between it and the trend line has narrowed to 10%. If the price consolidates further, this gap is expected to narrow, potentially triggering a touch.
Looking at technical indicators, the Wave Trend (WT) oscillator is giving a buy signal in the oversold zone on the daily chart, while the Squeeze Momentum (SM) indicator continues to attempt to move into positive territory after reaching maximum weakness in the negative zone. In moving averages, the golden cross pattern continues to narrow as the 50-day SMA crosses above the 200-day SMA.
Looking at weekly liquidity data, the buying level is intensifying at 98,200, while the selling level is intensifying at 112,000. Looking at the last 7 days’ liquidity data, there is a $250 million accumulation of transactions in the buying tier, while in the selling tier, there is approximately $100 million accumulation of transactions as a result of liquidations following the recent rise.
In summary, the Senate agreement to reopen the US government stood out as an optimistic development. While uncertainty persists regarding the Fed’s interest rate cuts, it is taking steps toward monetary expansion. Trump’s statements regarding the distribution of revenue from tariffs have reignited debate. Technically, while the price continues its downward trend, liquidity data shows that the buying level has gained the upper hand on a weekly basis. In the coming period, holding above the 105,000 reference level is crucial for the continuation of the uptrend. Closings above this level will bring a renewed move towards the 110,000 level, and if breached, the liquidity zone will be monitored. In the event of potential selling pressure, 105,000 remains a critical reference zone.
Supports: 105,000 – 103,000 – 100,000
Resistances: 110,000 – 112,400 – 115,000
ETH/USDT
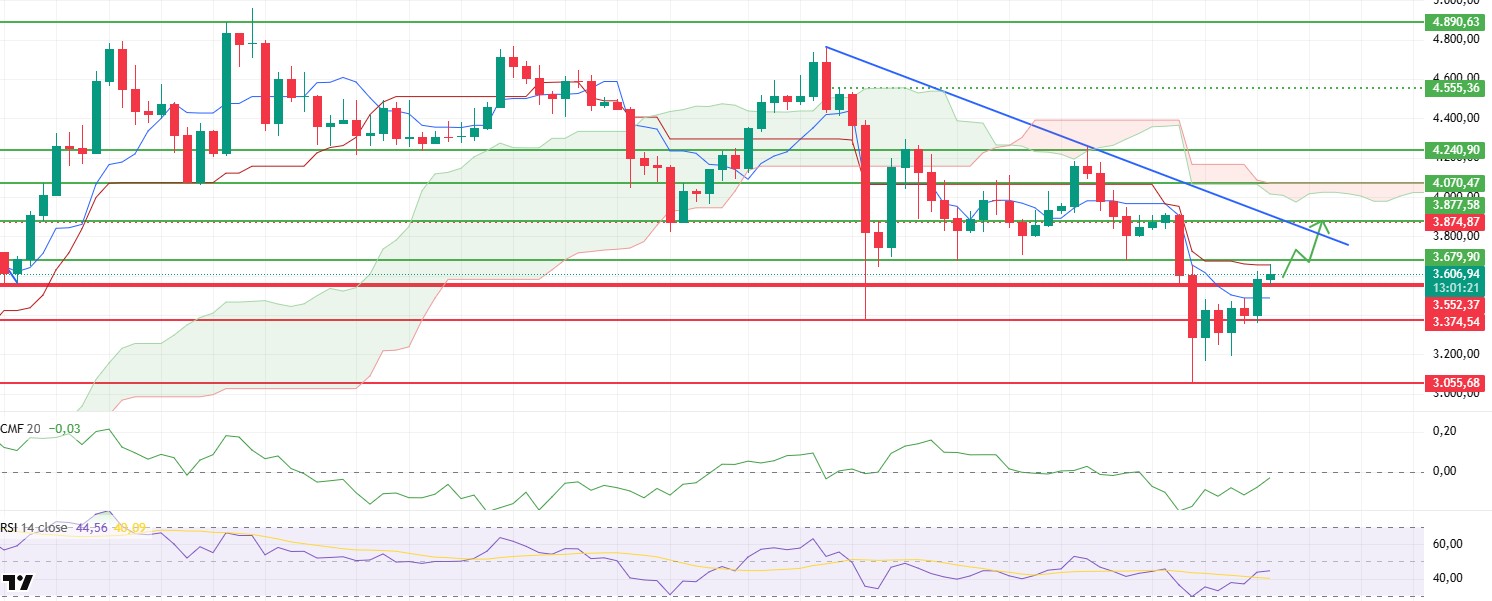
The Ethereum price started the week weakly last week amid heavy selling pressure and fell to $3,055 on Tuesday. However, strong buying at this level reversed the price direction, and it managed to recover to the Kijun line at $3,660 by the end of the week. This rise signaled that the market momentum, which had been weakening in recent weeks, was beginning to show signs of recovery.
The most notable development on the network side was the drop in gas fees on the Ethereum layer-1 chain to as low as 0.067 Gwei on Sunday. This historic drop in transaction fees indicates a significant decrease in activity on the chain. While advantageous for users in the short term, low gas fees weaken validator revenues, creating an unsustainable situation in terms of network security. This situation shows that the economic balance in the core layer of the Ethereum ecosystem has been disrupted.
Investor confidence continues to weaken in chain data. The decline in the total amount of ETH staked from 36.13 million to 36.07 million indicates that long-term investors remain cautious and that staking activity has slowed. This structure signals that market confidence has not fully recovered in the medium term.
There has been a notable improvement in liquidity indicators. The Chaikin Money Flow (CMF) indicator, after a prolonged period of weakness, has recorded a sharp rise and is approaching the zero line, indicating that liquidity flows are turning positive again. This picture supports the view that investor appetite is beginning to increase and capital inflows into the market are reviving.
The Relative Strength Index (RSI) indicator crossing above its MA line and rising to the 45 level confirms that short-term momentum is gaining strength. Although the RSI remains far from the overbought zone, its continued positive trend indicates that upside potential is preserved.
Although the price crossing above the Tenkan level in the Ichimoku indicator supports a short-term positive outlook, it is too early to say that the trend has completely turned positive, as the price is still trading below the kumo cloud. Even though reactions from the lower boundary of the cloud are strengthening, it can be assumed that medium-term pressure persists unless there is a sustained breakout towards the upper band.
Looking at the overall technical picture, the upward trend is expected to continue as long as the key support level of $3,552 holds. If the price breaks through the intermediate resistance level of $3,679, a new surge towards the $3,874 level could be seen. However, a sustained move below the $3,552 level could weaken the positive outlook and accelerate a decline to the $3,374 level. In the short term, maintaining support levels appears critical for Ethereum to continue its recovery process.
Supports: 3,552 – 3,374 – 3,055
Resistances: 3,679 – 3,877 – 4,070
XRP/USDT
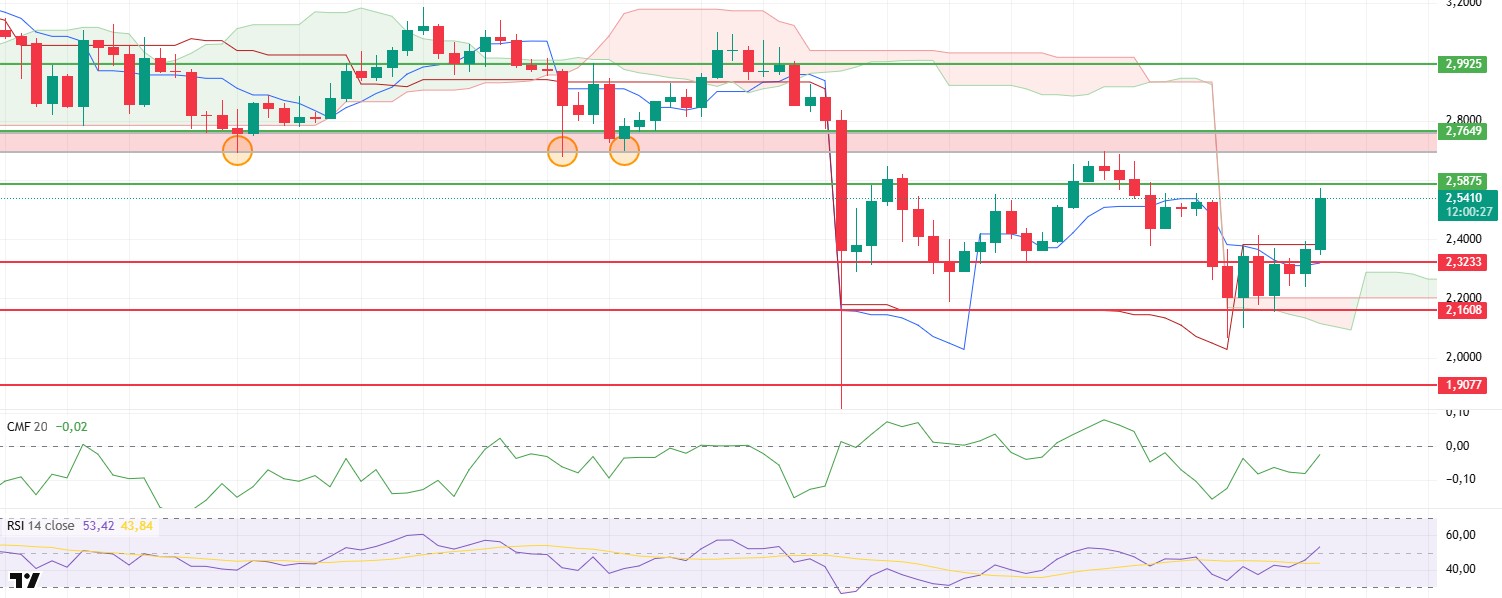
The XRP price fell to $2.07 last week amid heavy selling pressure. However, strong buying from this level reversed the price direction, and it managed to rise to $2.58. This recovery movement showed that selling pressure had weakened and buyers had regained strength. The price stabilizing at these levels, especially with increased volume towards the end of the week, created a positive reversal signal in short-term market dynamics.
The most significant development in the market agenda this week was the acceleration of preparations for the launch of spot XRP ETFs in the US. The Depository Trust & Clearing Corporation (DTCC) listed five separate spot XRP ETFs in the “active and pre-launch” category. This listing, which includes major financial institutions such as Bitwise, Franklin Templeton, 21Shares, Canary, and CoinShares, paves the way for expanded institutional access to XRP and increased liquidity depth. If the ETFs go live next week, this development could be a turning point not only for XRP specifically but also for the broader crypto markets, strengthening institutional legitimacy.
Technical indicators also point to an improvement supporting this theme. The Chaikin Money Flow (CMF) indicator moving up from negative territory into positive territory shows that liquidity flows, which had been weak for a long time, have turned back toward buying. This outlook confirms that fresh capital inflows into the market have begun and investor appetite has increased again.
The Relative Strength Index (RSI) indicator breaking above both its base moving average and the 50 level indicates that momentum is strengthening and buyers are becoming more active in the market. This structure in the RSI suggests that the upward trend may continue to be supported in the short term.
When the price manages to rise above the Ichimoku cloud, it generates positive signals for the medium-term outlook. Furthermore, the price remaining above the Tenkan and Kijun levels indicates that the uptrend is technically supported. However, for the trend to gain strength, the price needs to maintain its position above the cloud.
Looking at the overall technical chart, if the XRP price can maintain stability above the $2.58 level, it is likely to rise to the critical resistance zone marked by the red rectangle on the chart, which is the $2.76 level. Breaking above this level could significantly increase the upward momentum and trigger a new move towards the $2.89 level. However, closes below the $2.32 key support level could weaken the positive outlook and lead to renewed selling pressure. In the short term, the $2.58 level remains decisive for the continuation of the uptrend.
Supports: 2.3233 – 2.1608 – 1.9077
Resistances: 2.5875 – 2.7649 – 2.9925
SOL/USDT
Last week in the Solana ecosystem:
- Invesco Galaxy announced a 0.25% fee. Forward Industries initiated a $1 billion share buyback.
- Grayscale waived fees for the Solana Trust ETF to boost investor participation.
- Solmate launched Solana’s first UAE validator, combining staking, RPC, and colocation for stronger blockchain performance.
- Solana established a global blockchain payments consortium to standardize stablecoin transactions.
The SOL price traded sideways on the daily chart this week. The asset remained in the lower region of the downtrend that began on September 18. Testing the 200 EMA (Black Line) moving average and the strong support level of $185.60 as support, the price failed to hold and deepened its decline. Gaining momentum after finding support at the strong support level of $150.23, the price managed to hold above the $162.99 level. If the uptrend continues, it may test the 50 EMA (Blue Line) moving average as resistance. In case of a pullback, the $127.62 level should be monitored.
The asset is trading below its 50 EMA (Exponential Moving Average – Blue Line) and 200 EMA (Black Line) moving averages, indicating that the asset is trending downward. Furthermore, the 50 EMA continuing to sit above the 200 EMA signals the continuation of a technical “golden cross” formation. This indicates that the potential for an uptrend in the medium term remains intact. The RSI (14) has retreated to the middle of the negative zone. At the same time, the indicator has remained below the downward trend line that began on July 22. This indicates that selling pressure continues. The Chaikin Money Flow (CMF-20) remains in negative territory. At the same time, balanced cash inflows and outflows may keep the CMF-20 indicator in negative territory. If macroeconomic data remains positive and developments in the ecosystem continue to be favorable, the first major resistance level of $209.39 could be retested. Conversely, in the event of potential negative news flow or deterioration in macro data, the $150.23 level could be monitored as a potential buying opportunity.
Supports: 162.99 – 150.23 – 141.80
Resistances: 185.60 – 209.39 – 228.35
DOGE/USDT
Grayscale announced a 0.35% fee for Dogecoin ETFs. Bitwise initiated the automatic approval process by submitting Form 8(a) for its Spot Dogecoin ETF.
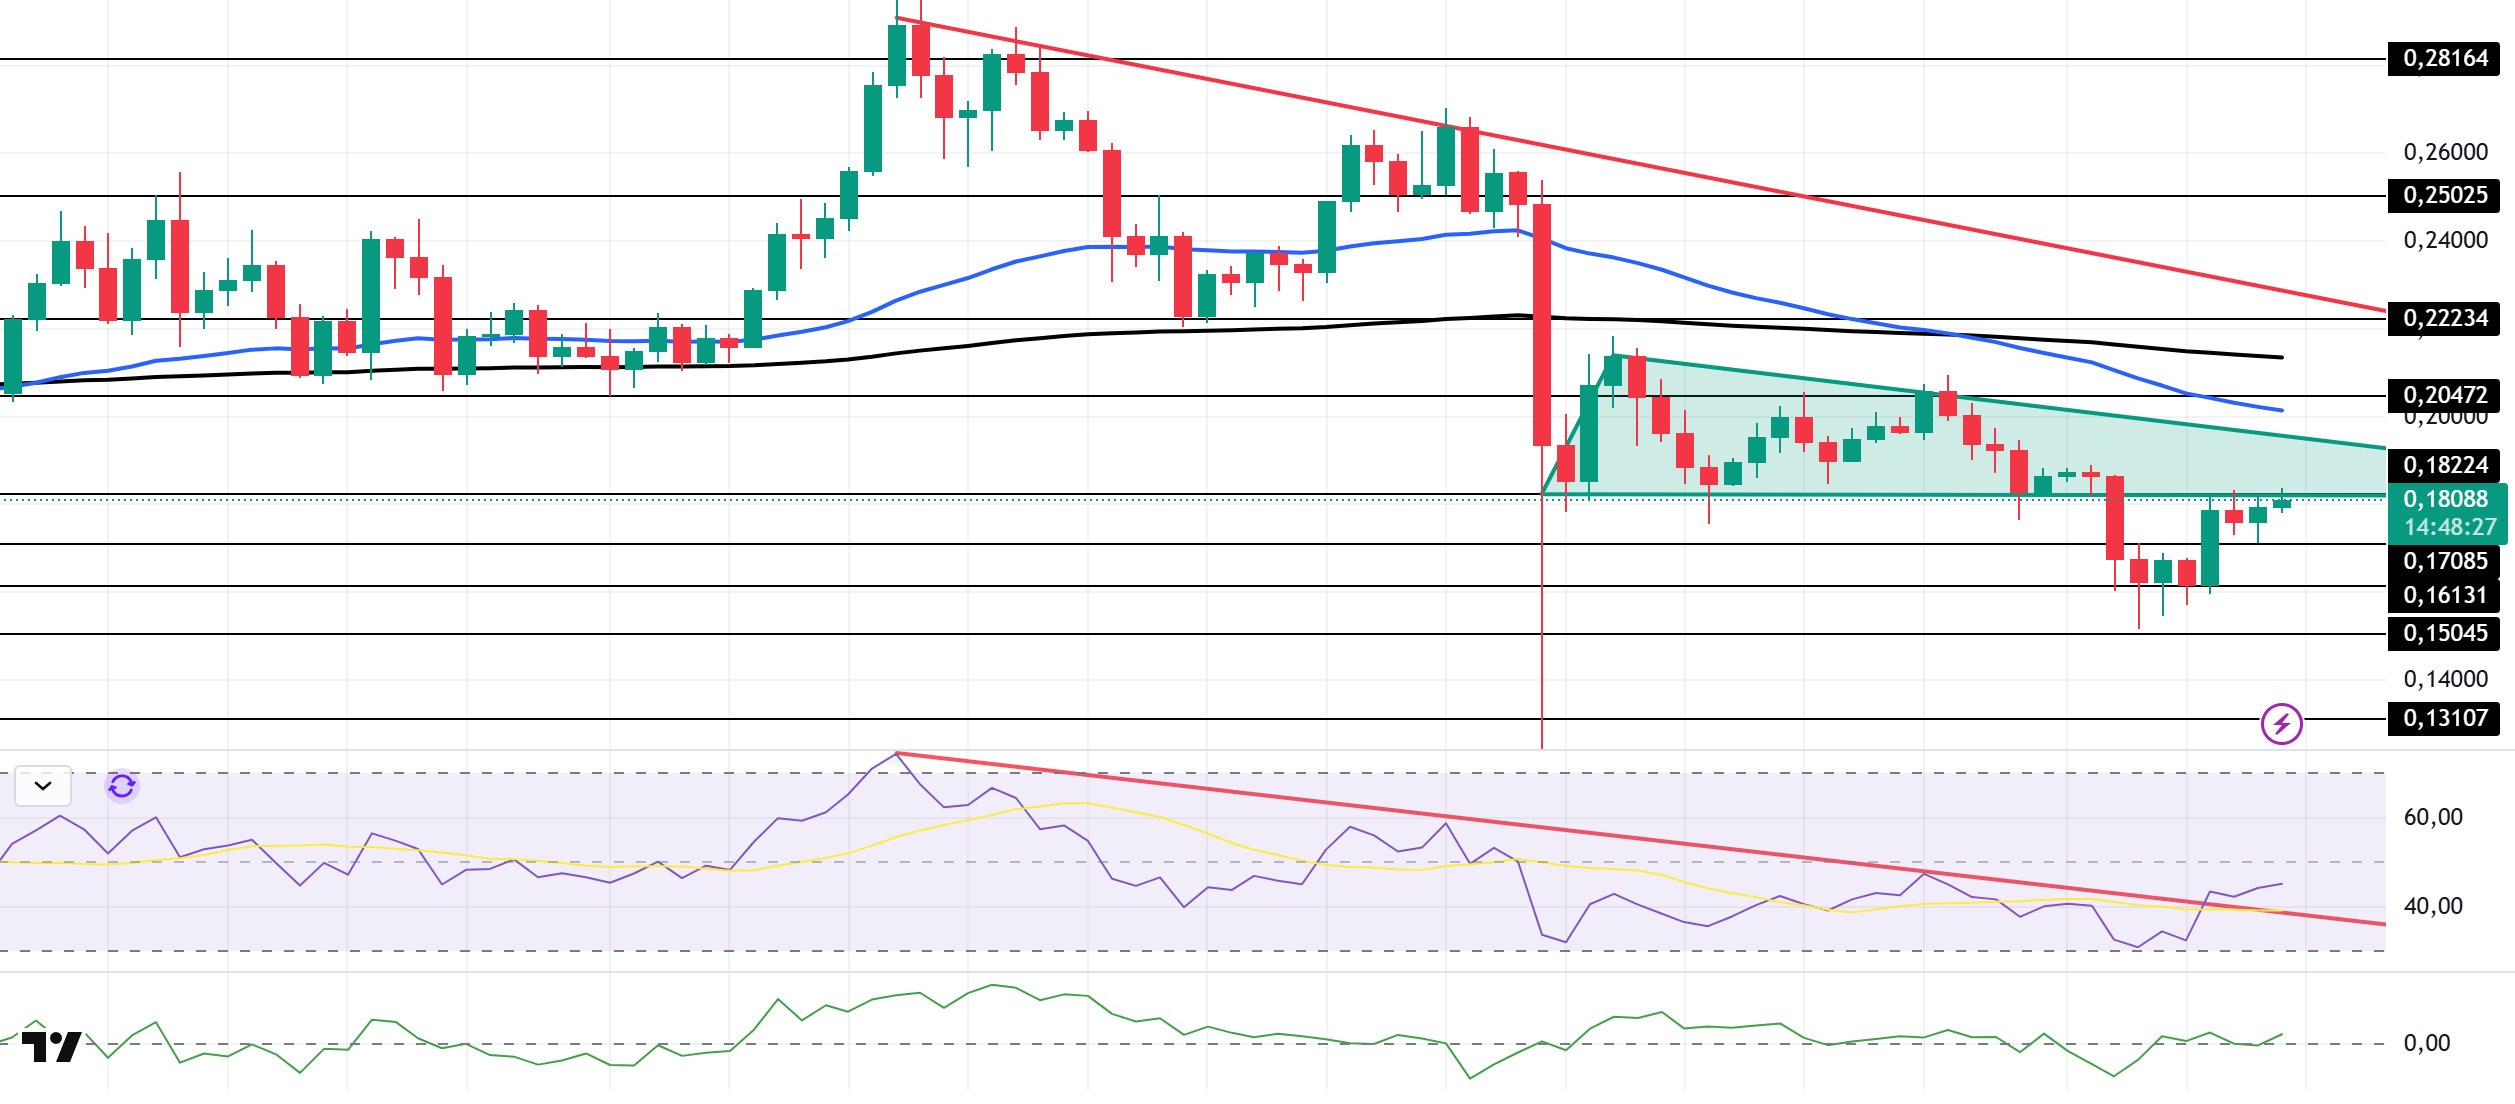
On the daily chart, DOGE has shown a slight increase since last week. Testing the strong support level of $0.18224 for the third time, the price broke down from the descending triangle formation. The asset then accelerated upward from the strong support level of $0.16131 and is currently testing the base level of the descending triangle formation as resistance. If it breaks above this level, the formation’s ceiling level could be targeted. In the event of a pullback, the $0.16131 level could act as support.
The asset continued to trade below the 50 EMA (Blue Line) and 200 EMA (Exponential Moving Average – Black Line) moving averages. This indicates that the asset is trending downward. On the other hand, the 50 EMA being below the 200 EMA shows us that the “dead cross” formation is continuing. This also indicates that the asset has an increased potential to lose value at this moment. The Chaikin Money Flow (CMF–20) indicator has moved into positive territory. Money inflows continue to decline. This could push the CMF-20 into negative territory. Looking at the Relative Strength Index (RSI-14) indicator, it remains in the middle of the negative zone. At the same time, it has moved into the upper zone of the downtrend that has been ongoing since September 13. This indicates that buying pressure is building. In the event of macroeconomic risks or negative news from the ecosystem, the $0.16131 level can be monitored as strong support. On the other hand, if the upward movement gains strength, the $0.20472 level comes to the fore as the first strong resistance level.
Supports: 0.17085 – 0.16131 – 0.15045
Resistances: 0.18224 – 0.20472 – 0.22234
TRX/USDT
Last week, the TRON network generated a total of $49.1 million in revenue, continuing to be the highest-earning ecosystem among all blockchain networks. The positive trend in revenues observed on the TRON network stands out as a factor supporting its dominance in the DeFi and stablecoin space.
During the week of November 3–9, 2025, a total of 25.9 million TRX were burned on the TRON network. Despite this, the circulating supply increased by 1.5 million. The increase in circulating supply creates an inflationary effect on TRX. This development may create slight supply pressure on the TRX price in the short term, but if the burn trend continues, a balance may be seen in the medium term. In addition, the total number of addresses also increased by 1.5 million to 344.5 million during the same week.
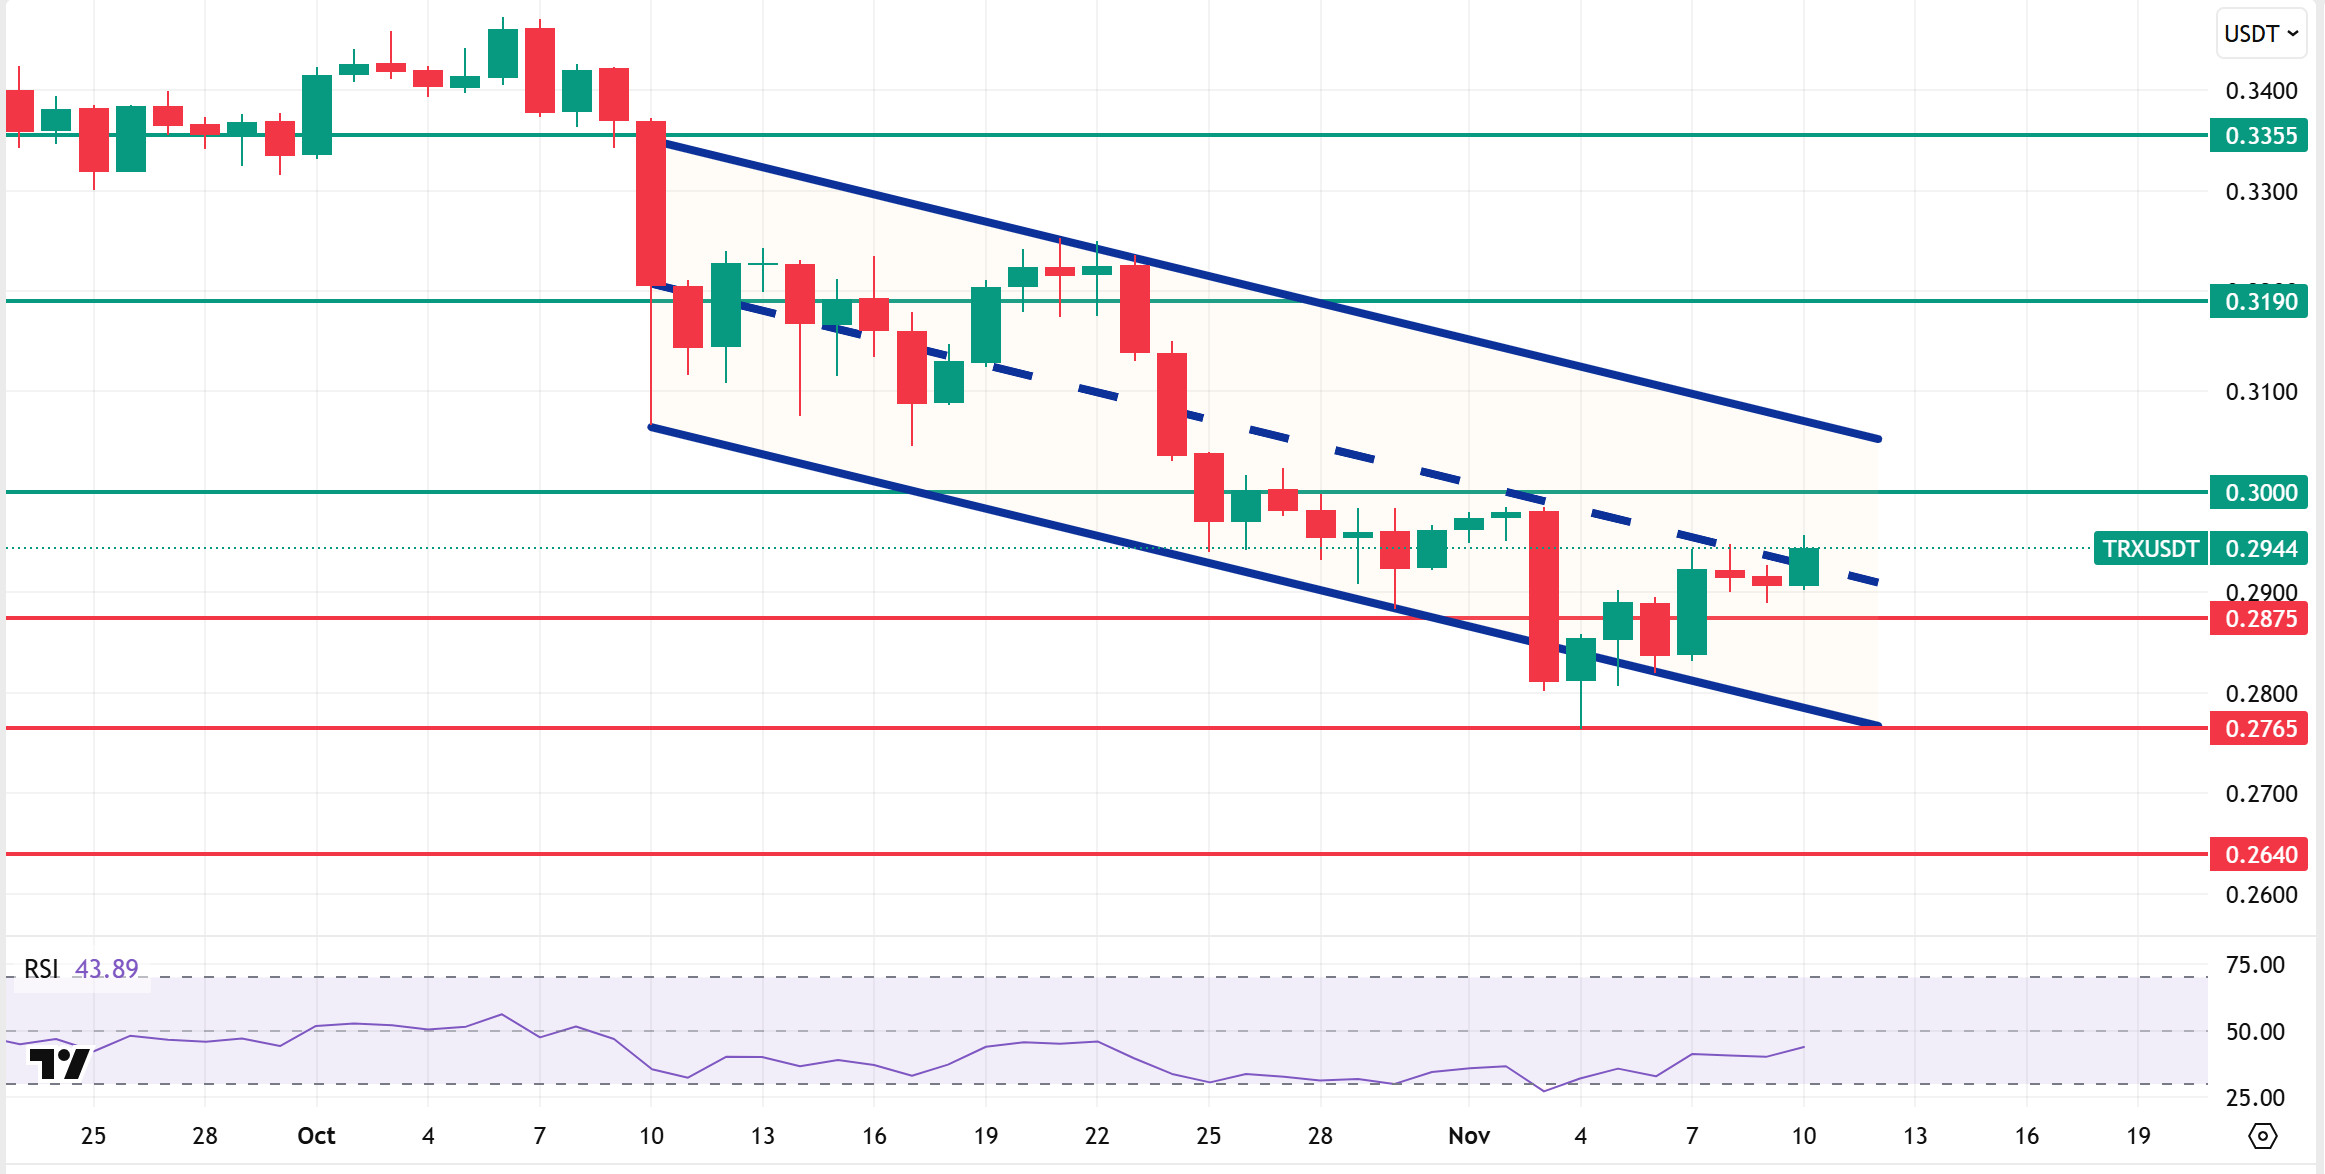
Technically speaking, TRX started last week at $0.2981 and closed the week at $0.2907, falling approximately 3% over the course of the week. Thus, TRON, which has completed its fifth consecutive week of decline, has a market value of $27.5 billion. Currently trading at 0.2944, TRX is in the middle band of the bearish channel on the daily chart and is hovering close to the 0.3000 resistance level. The Relative Strength Index (RSI) value is 43, indicating it has escaped the oversold zone. Considering its position within the bearish channel and the RSI indicator, the TRX price may be expected to rise. This suggests it may move towards the upper band of the channel. In such a case, it could test the 0.3000 resistance level. If it closes above the 0.3000 resistance level on a daily basis, it may test the 0.3190 resistance level. If it fails to close above the 0.3000 resistance level on a daily basis and selling pressure increases in the market, it may decline due to potential selling from this area. In such a case, it may test the 0.2875 support level. The 0.2640 level is being monitored as a critical support point on the daily chart. Staying above this level could maintain the upward trend, while closes below it could lead to increased selling pressure and deeper downward price movements.
Supports: 0.2875 – 0.2765 – 0.2640
Resistances: 0.3000 – 0.3190 – 0.3355
AVAX/USDT
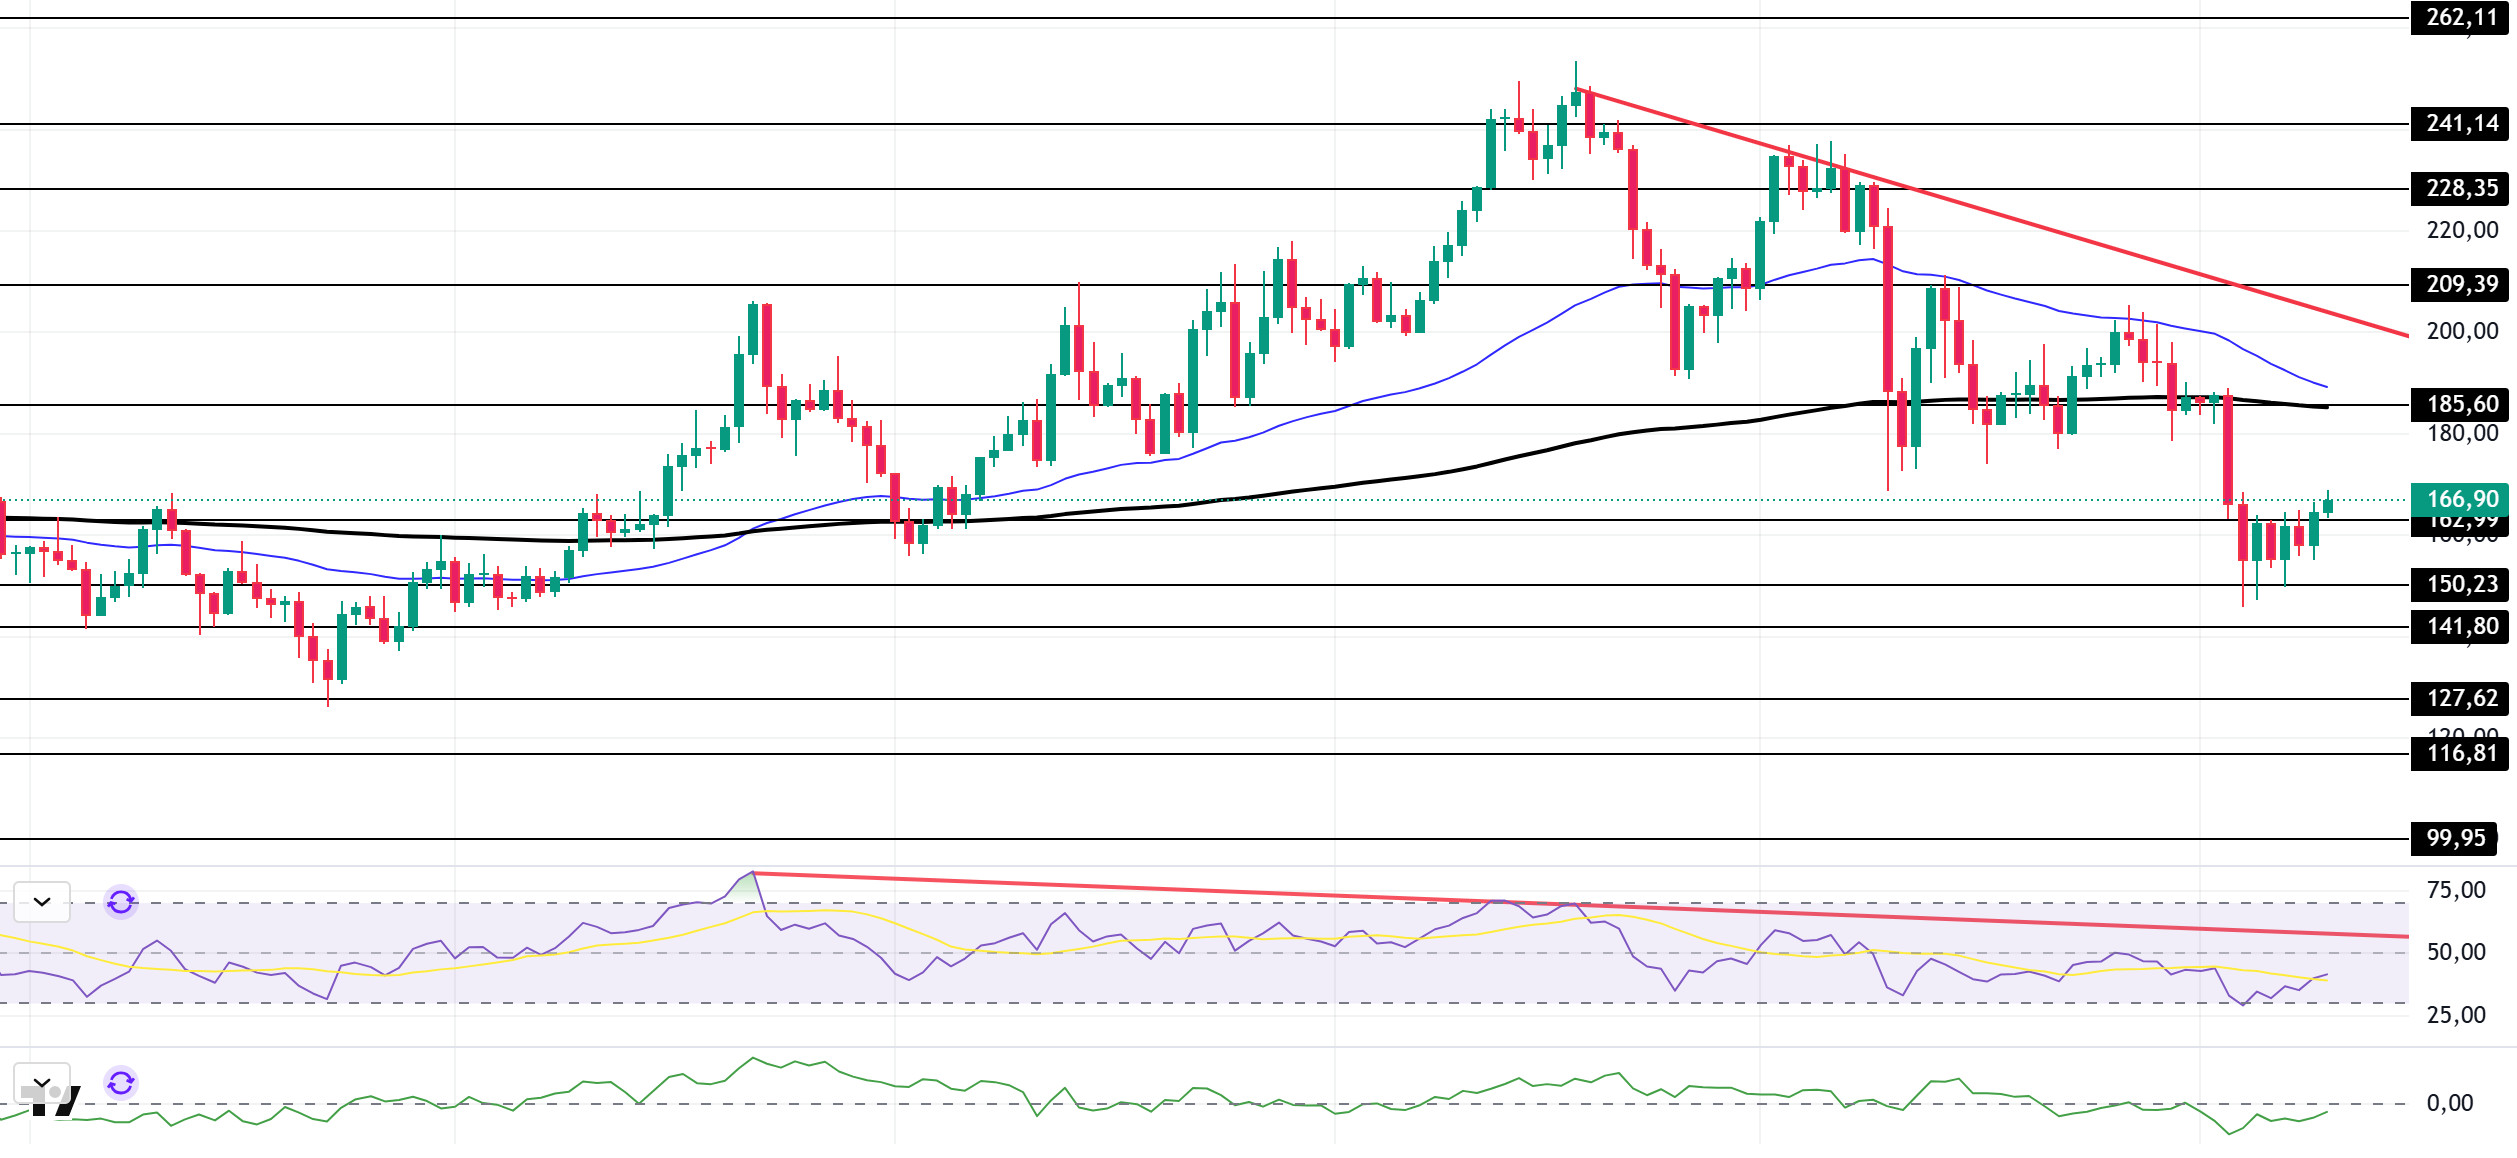
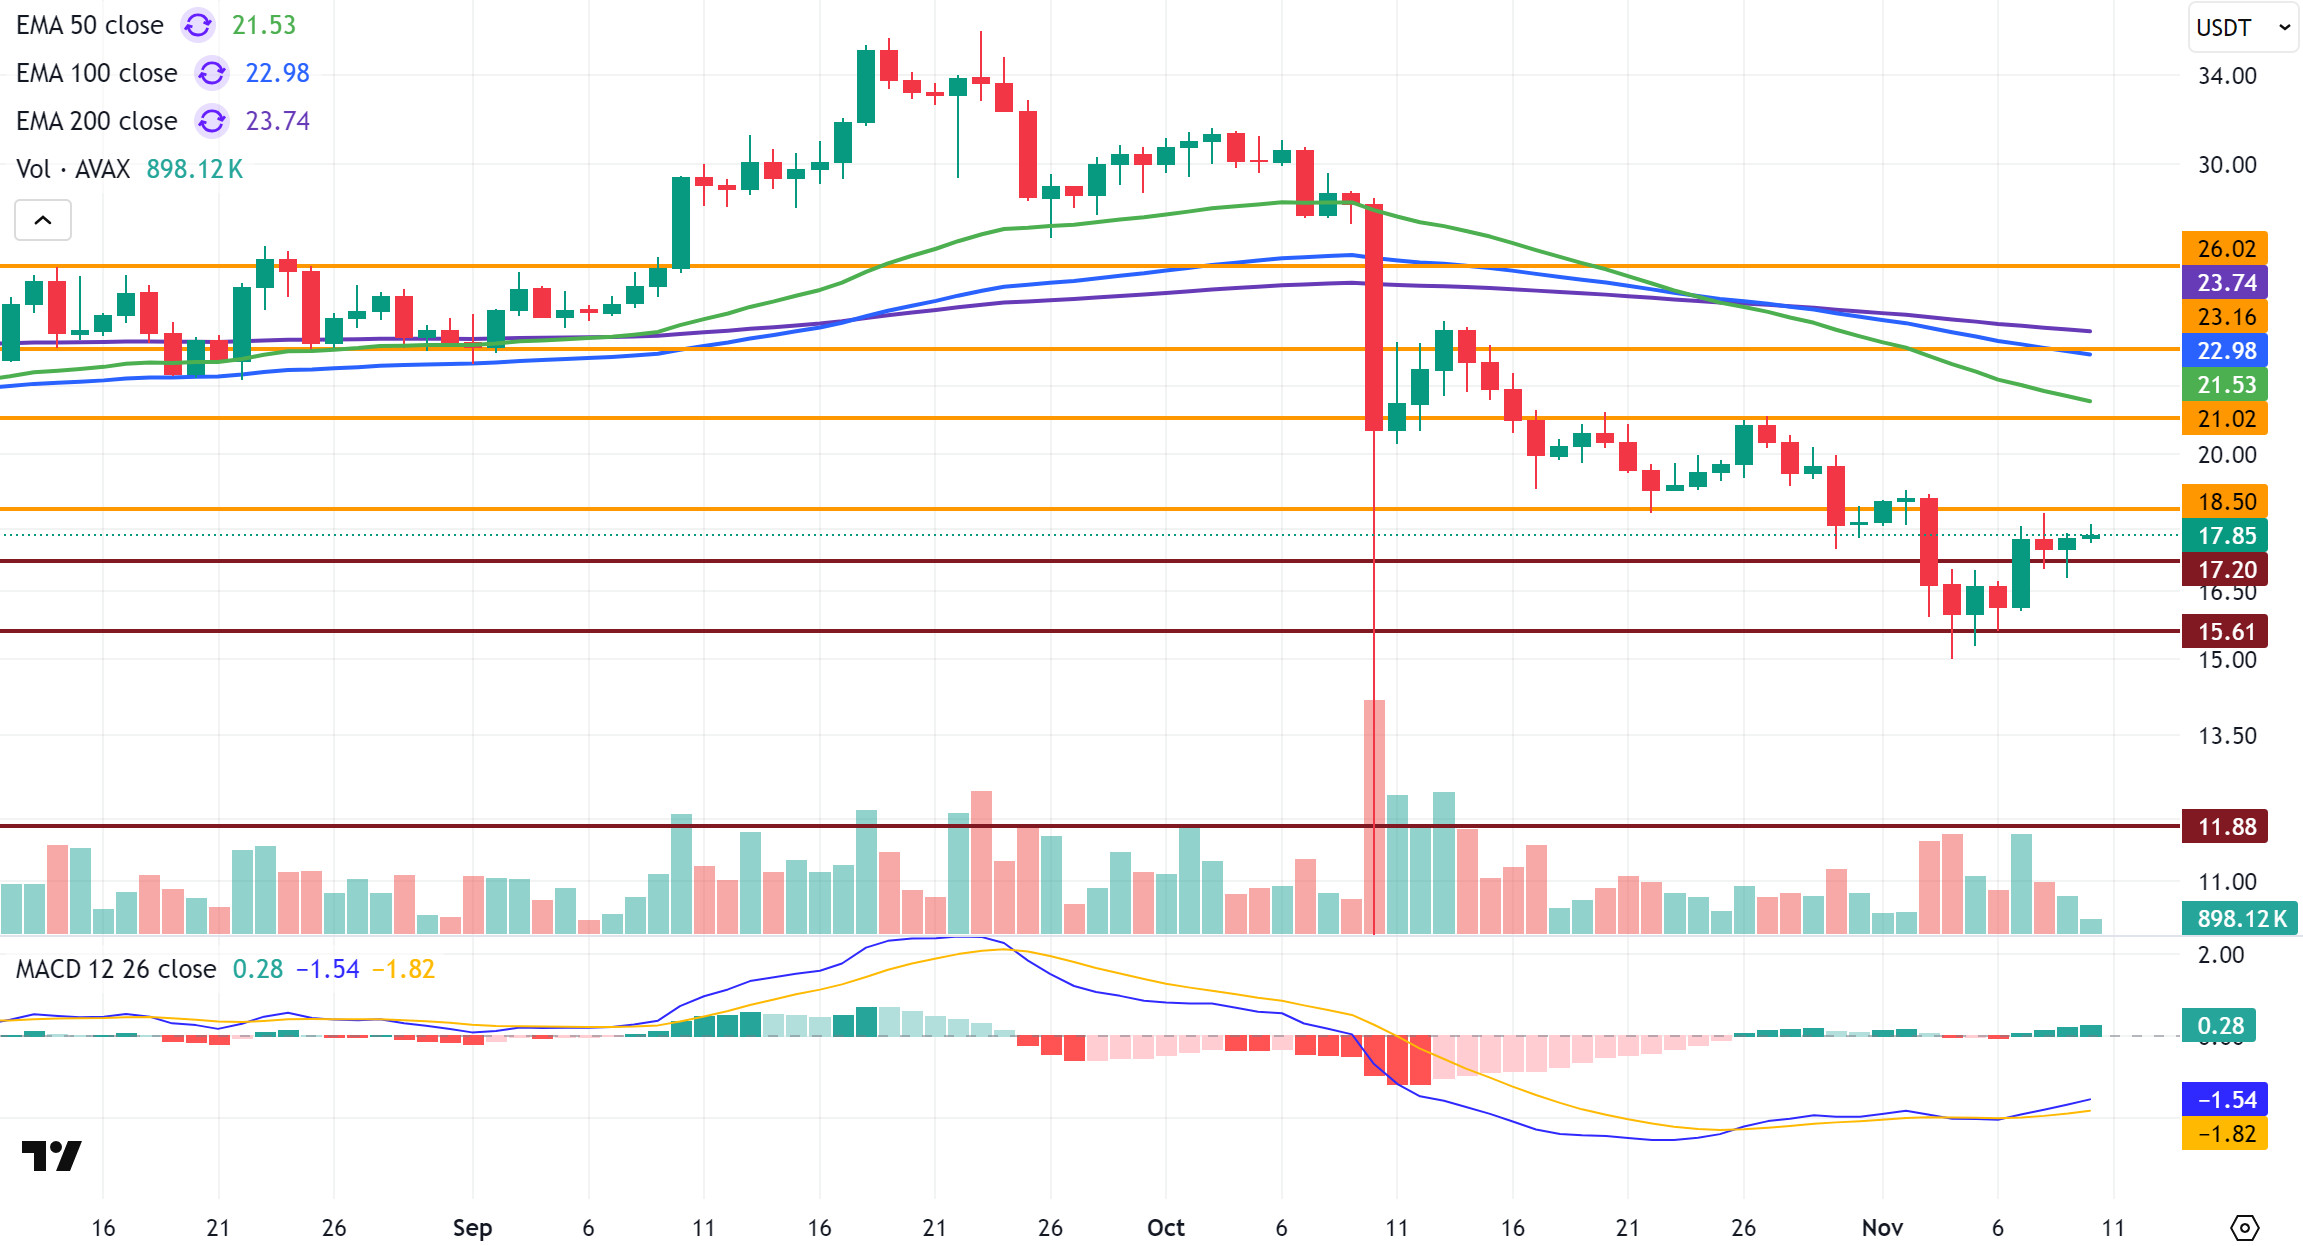
AVAX started last week at $18.80 and lost 5.5% of its value over the week due to weak market conditions. Selling pressure was effective in the first two days of the week, causing AVAX to fall to $15.00. AVAX recovered with buying activity in this region and closed the week at $17.77 ( ). The crypto market continued to be characterized by low volume and low volatility, causing AVAX to experience a sharp decline and limiting its attempts to rebound. Although there were positive developments in the Avalanche ecosystem, these developments did not significantly contribute to short-term price performance due to low investor interest in the market overall.
On the daily chart, following the sharp decline last week, reaction buying caused the Moving Average Convergence/Divergence (MACD) line to cross above the signal line and turn upward. This crossover can be interpreted as a short-term recovery signal. However, the MACD line continues to trade in negative territory. Strengthening momentum and the MACD moving into positive territory will be decisive in breaking resistance levels for AVAX’s rise. Otherwise, weak momentum and selling pressure at resistance levels could limit the upside again. The MACD outlook is positively inclined but has not yet confirmed a strong trend reversal. AVAX continues to trade below all critical Exponential Moving Average (EMA) levels. These levels converge above the price, forming a strong resistance band. This indicates that the overall trend remains in negative territory. Although AVAX is attempting to regain the $21 level in its recovery movement, this region has become an important threshold support-resistance conversion zone in the short term, both psychologically and technically.
From a technical perspective, the $18.50 level stands out as the first strong resistance for AVAX in the short term. If this level is broken and sustained, the upward movement could continue towards the critical resistance zone of $21.02 and the EMA50 level. If sustainability is achieved in this zone, the EMA100 and $23.16 resistance zones will come into play. Conversely, in downward movements, the $17.20 level is the first strong support position. Closing below this level could lead to increased selling pressure and cause the price to retreat to the $15.61 and $11.88 support levels. In the overall outlook, although the momentum signal on the MACD side is a positive development in the short term, the price remaining below the EMA levels indicates that the trend is still in negative territory. For AVAX’s technical outlook to turn positive again, it needs to close above $21 and see a significant increase in trading volume. Otherwise, the price may continue its sideways consolidation in the $17-19 range.
(EMA50: Green Line, EMA100: Blue Line, EMA200: Purple Line)
Supports: 17.20 – 15.61 – 11.88
Resistances: 18.50 – 21.02 – 23.16
SHIB/USDT
This week, the Shiba Inu ecosystem reshaped itself around infrastructure security and supply discipline, while weakness remained evident on the L2 activity side. The team officially accelerated the transition to shut down legacy public RPC access on Shibarium and reiterated the announcement mandating migration to the new endpoint on the dApp side; this step, which may create friction in the short term due to configuration updates, is expected to reduce the single point of failure and increase resilience in the medium term.
Negotiations progressed on the security front: After K9 Finance’s call to highlight a 20 ETH white hat offer, the exploiter demanded 50 ETH; the ecosystem side then moved the process to an “take it or leave it” framework, announcing a final offer of 25 ETH and emphasizing that the reward flow was structured through a trustless contract. this shutdown move offered a tactical framework aimed at softening the risk narrative. The burn channel in supply management weakened this week: 32,297,688 SHIB were burned in the last 7 days (weekly pace -47.2%), while daily burns hovered around 919,747 SHIB; it appears that network activity is needed to support a lasting impact. L2 adoption signals were also weak: Shibarium’s daily transaction count fell to 2,420, limiting the efficiency of the transfer mechanism from BONE fees to SHIB burning and reinforcing the narrative of declining activity.
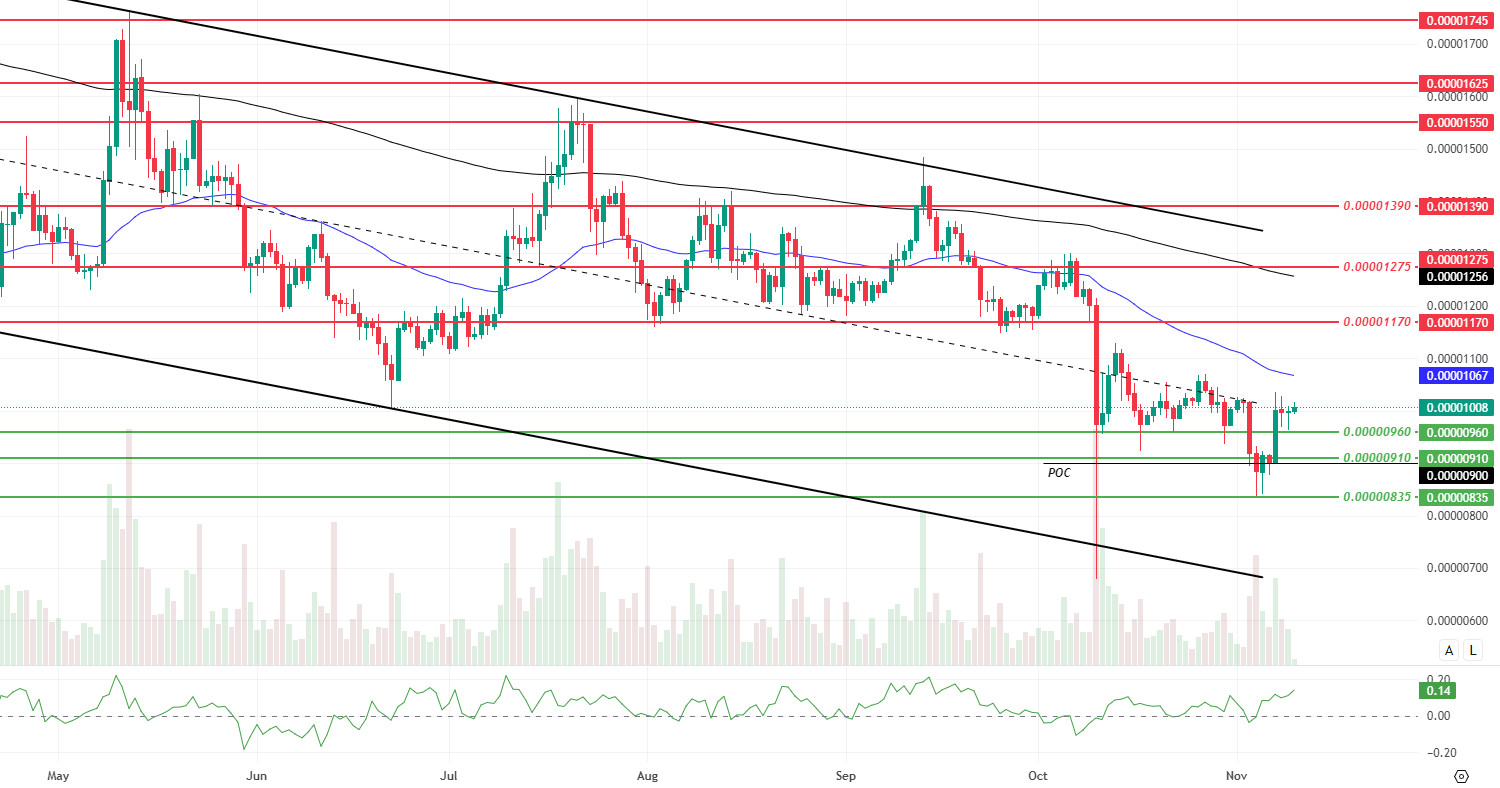
This week’s technical outlook shows the price hovering around the $0.00001000 level and the middle band of the descending channel, accompanied by increases in volume, momentum, and volatility. This week’s Point of Control (POC) level is $0.00000900, indicating that the value area is shifting downward. The Money Flow Index (MFI) remains in positive territory, confirming continued inflows. However, the price staying below the 50 EMA and 200 EMA indicates that trend confirmation has not yet been achieved. EMA50 is at $0.00001067, EMA200 at $0.00001256. In the broader picture, the price staying above the POC and holding above the channel midline maintains short-term equilibrium; for sustainability, increasing volume must continue and volatility must support upward movement.
In terms of upward attempts, closes above $0.00001020 continue to be the first supportive signal. If this is followed by settling above the EMA50 around $0.00001067 and volume-driven retakes of intermediate resistances, the momentum of the recovery could increase. If these conditions materialize, $0.00001170 and $0.00001275 can be monitored as intermediate targets; a move above the EMA200 at $0.00001256 could strengthen the medium-term outlook. Failure to hold the $0.00000960 level below could accelerate the decline and pave the way for a retest of $0.00000910. Below this level, $0.00000835 stands out as a broad support level. In summary, while the price continues to appear stuck around the POC, as long as it remains below the EMA 50 and EMA 200, upward attempts retain their corrective character; for sustainability, the need for volume and volatility recovery and a breakout from the channel persists.
(EMA200: Black line, EMA50: Blue line)
Supports: 0.00000960 – 0.00000910 – 0.00000835
Resistances: 0.00001170 – 0.00001275 – 0.00001390
LTC/USDT
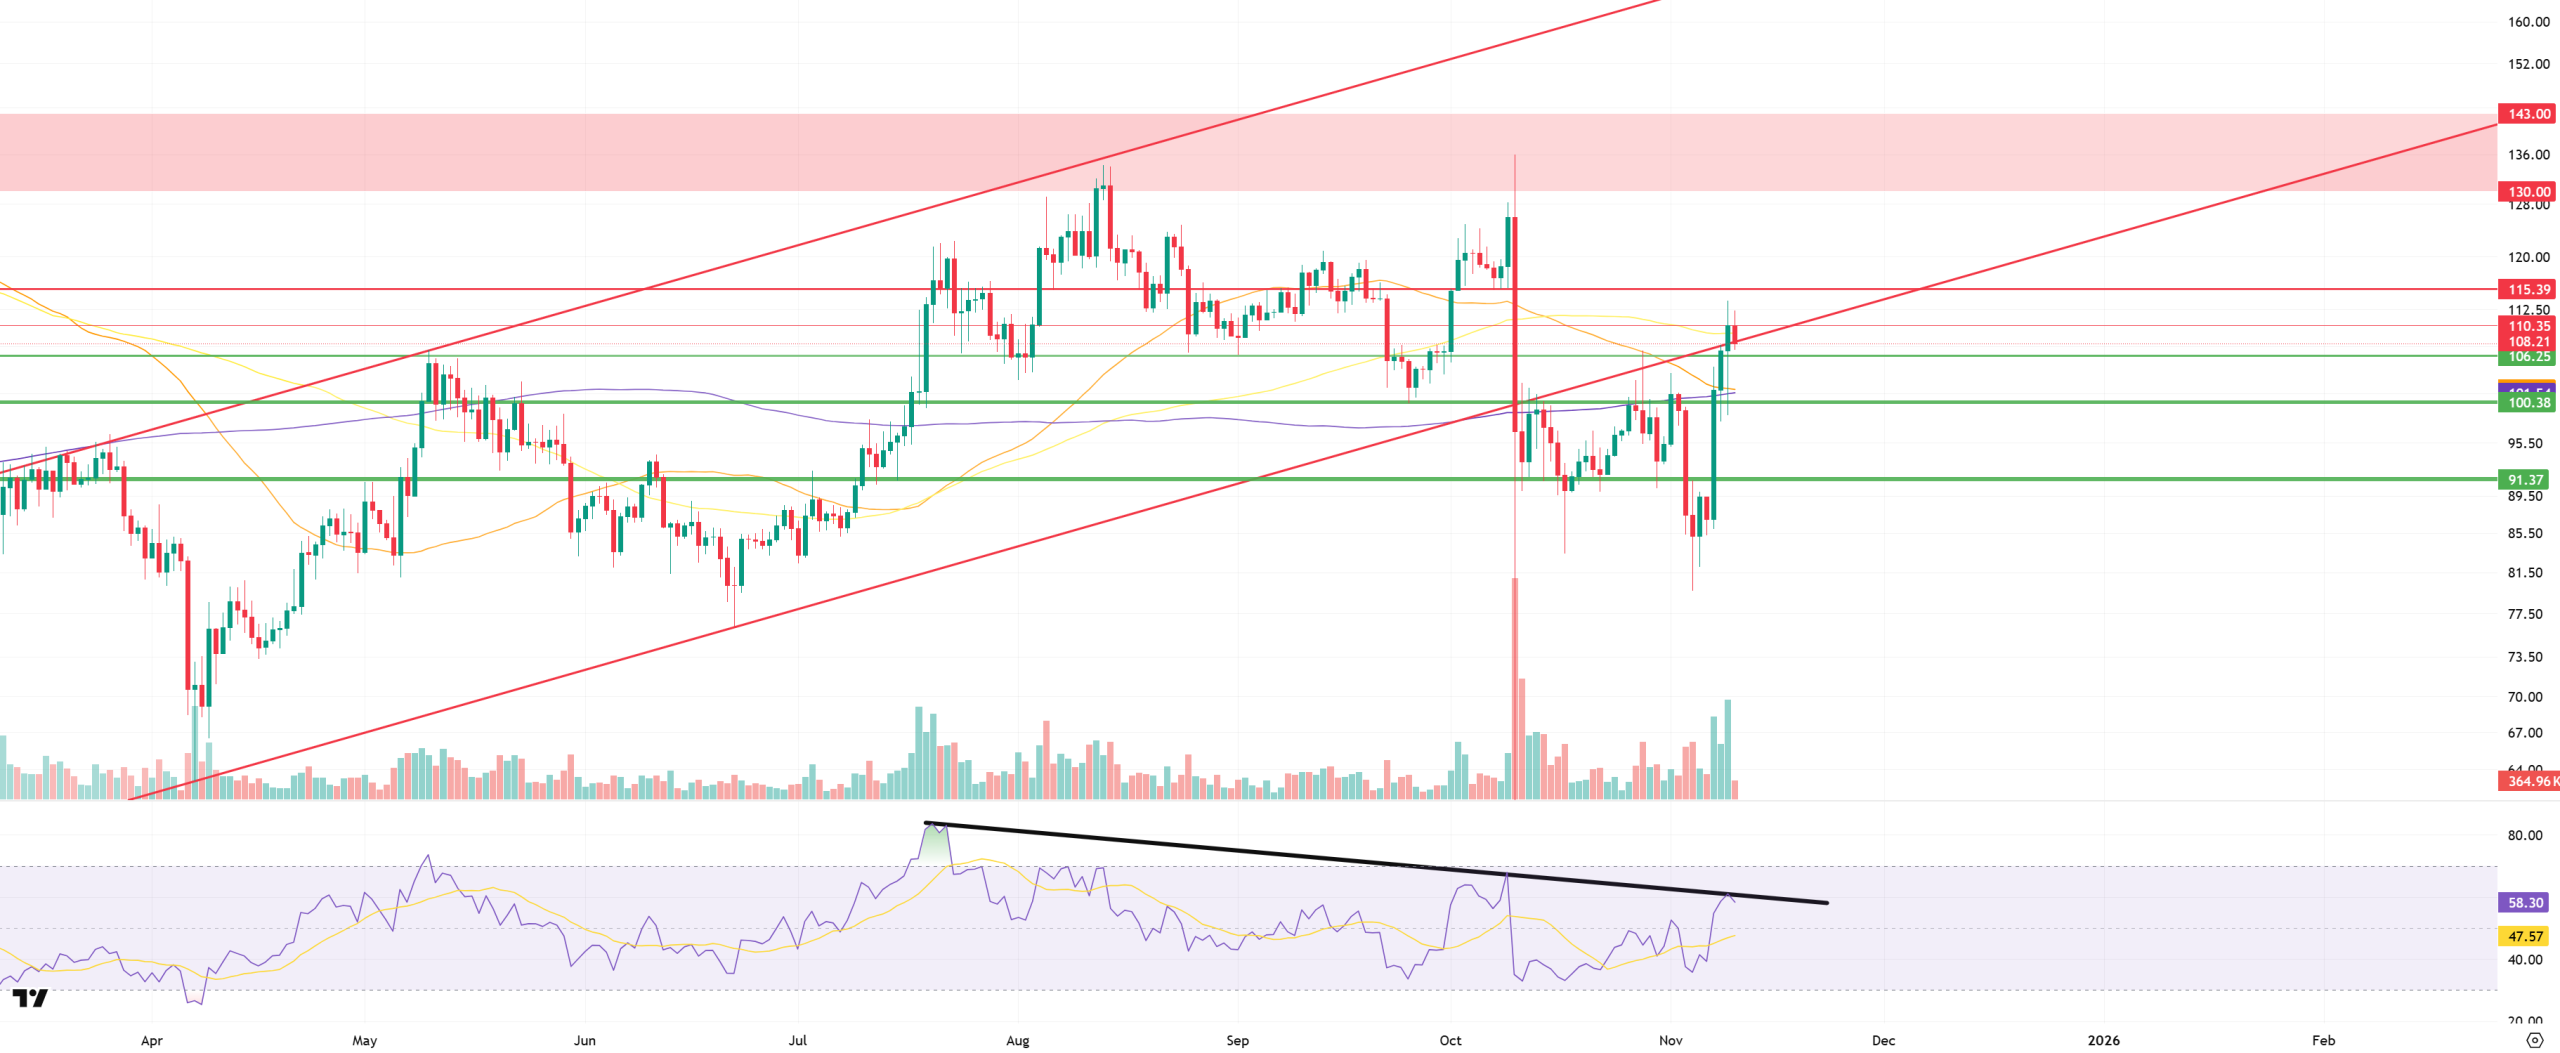
Litecoin (LTC) ended last week with a strong 10.95% increase, starting the new week at $110.31. LTC also recorded a 17% increase in value against Bitcoin during the same period, gaining significant momentum in terms of market value and reaching a total market value of approximately $8.2 billion. With this rise, Litecoin climbed two places in the global cryptocurrency rankings to 18th place. On the futures side, the total open interest has decreased by approximately 44% compared to last week. This decline is largely due to the closing of short positions opened in the previous period. On the other hand, funding rates remaining partially in negative territory indicate that market participants generally expect a slight decline.
From a technical perspective, the Litecoin price is still trading below the 100-period moving average (yellow line), while the 50-period (orange) and 200-period (purple) moving averages remain above the . This outlook indicates that the price is generally trending positively in the short and long term, but has reached a decision point in the medium term. Examining the chart formation, LTC is still seen trading just below the rising trend resistance. Despite last week’s strong rally, the price has not yet clearly broken this trend, making it difficult to say that the outlook has fully turned positive. The rising trend lower band, currently at $108.21, is a technically critical level. Sustained closes above this area could turn Litecoin’s outlook positive in the short term and enable the price to enter a bullish pattern targeting $110.35. If the 100-period moving average at $109.24 is broken, Litecoin’s momentum is expected to strengthen, leading to a more pronounced positive outlook. On a weekly basis, the $115.39 level stands out as a strong resistance point. This level is known as an area where both selling reactions and volume increases have intensified in the past. Therefore, if the price moves towards this level, profit-taking is likely to increase and short-term selling pressure is likely to emerge.
In downward price movements, the first minor support level stands out at $106.25. This area can be considered the first line of defense where short-term buyers may re-enter, as it is a region where the price has reacted several times in the past when moving both upward and downward. If this support is broken, the second and stronger support zone that could limit the decline is the $100.38 level. The 50- and 200-period moving averages, located close to this level, technically reinforce the support zone. The intersection of these two averages, in particular, creates a “dynamic support zone” that could increase the likelihood of a price rebound. In a deeper pullback scenario, the $91.37 level stands out as a critical support area on the weekly chart. This zone also coincides with Fibonacci retracement levels and can be considered an area where a potential bounce may occur. A possible contact with this level could pave the way for mid-term investors to take long positions on Litecoin.
Supports: 106.25 – 100.38 – 91.37
Resistances: 108.21 – 110.35 – 115.39
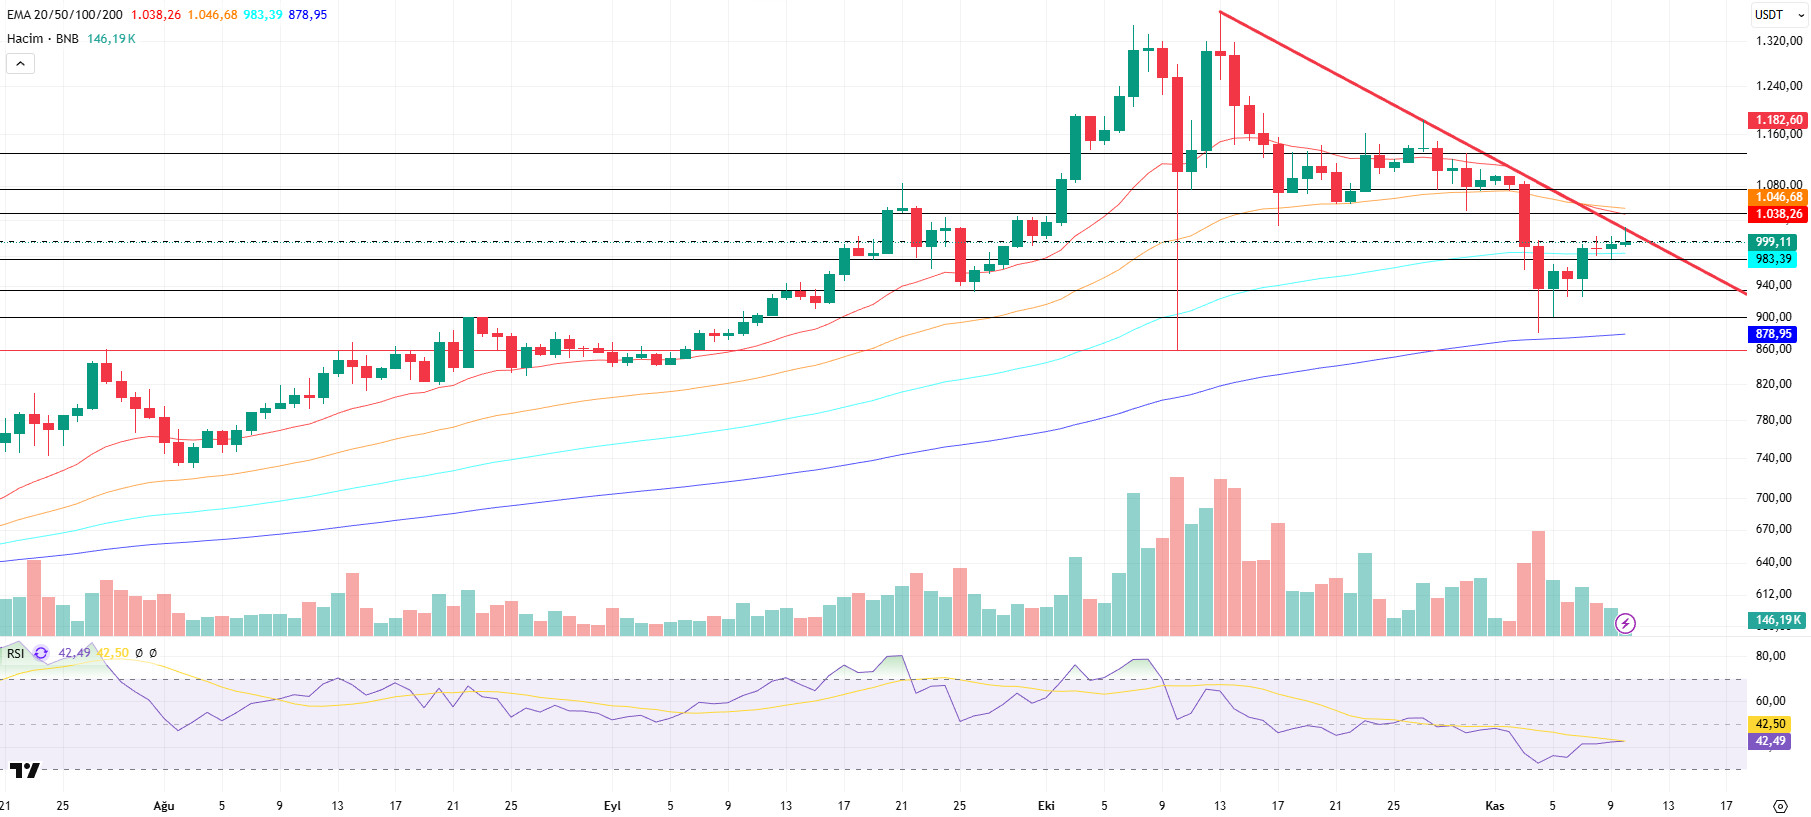
BNB/USDT
This week, the SAPIEN project was listed on Binance Launchpool in the BNB ecosystem. This listing is expected to increase demand for BNB, which is used for transaction fees, and reduce the circulating supply through users staking BNB. These dynamics are expected to have a positive impact on the BNB price in the medium term.
From a technical perspective, the correction that began after the all-time high (ATH) resulted in a pullback to the $900 support zone identified in previous technical analyses. After seeking support above these levels for a while, the asset ended its downward momentum with the formation of new candles and turned its direction upward again. With this rise, the price showed positive acceleration up to the falling trend zone.
Currently, BNB/USDT has broken through the psychological price level of $1,000 and is showing a positive outlook, but it has encountered resistance below the downtrend line and is now searching for direction.
Technical indicators for BNB, currently trading in the $975–1,040 range, suggest that the positive trading volume observed in recent rallies is supporting the upward momentum. Additionally, the Relative Strength Index (RSI) indicator has risen above the 40 level due to recent buying pressure, strengthening its positive outlook with support from this level.
Based on the current technical picture, if buying appetite is maintained and market momentum recovers, BNB is expected to break above the falling trend line in the first stage. If the downward trend is broken upward and sustainability is achieved at this level, the price is likely to retest the $1,040 resistance level. If this level is exceeded, it is technically possible for the price to rise towards the $1,075 and $1,130 levels, respectively.
On the other hand, if selling pressure increases again, the price is expected to test the psychological support level of $975. If this level is broken downward, the price may retreat to the support zones of $935 and $900, respectively.
Supports: 975 – 935 – 900
Resistances: 1,040 – 1,075 – 1,130
LINK/USDT
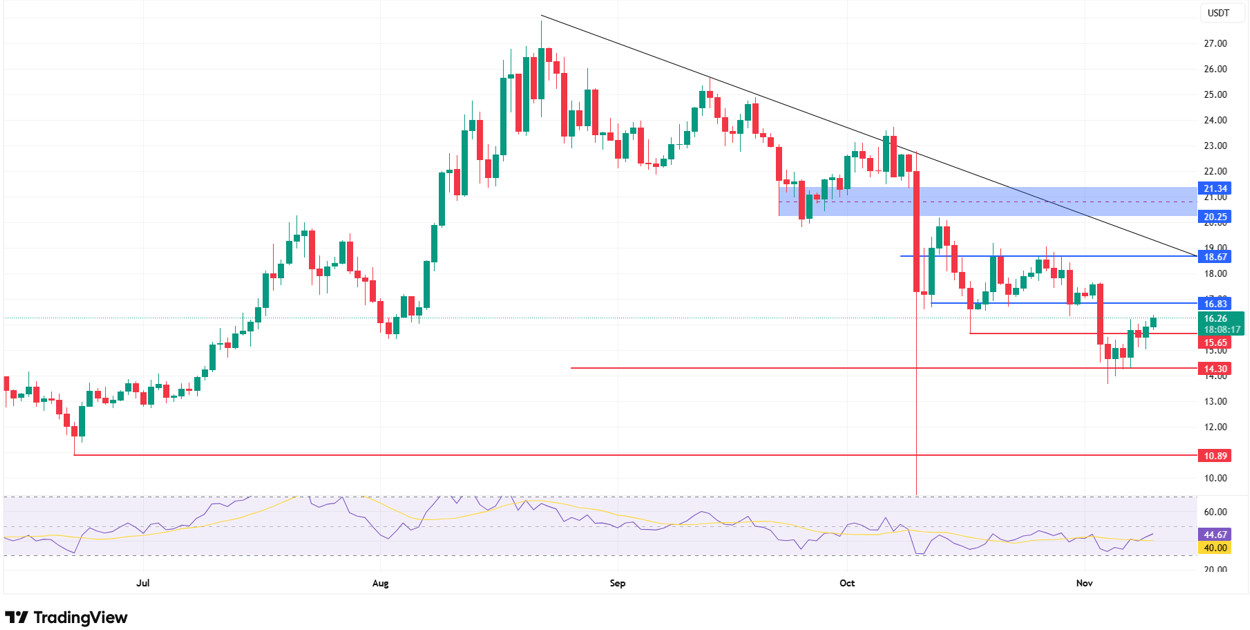
Over the past week, Chainlink announced several partnerships and developments. Through a collaboration between Chainlink and Chainalysis, Chainlink’s Automated Compliance Engine (ACE) infrastructure was integrated with Chainalysis’ Know Your Transaction (KYT) risk monitoring system, establishing a partnership in cross-chain compliance processes. Secondly, with the agreement with Tradeweb Markets Inc., Tradeweb’s “FTSE US Treasury Bond Closing Prices Index” data will now be transferred to the chain via the Chainlink Data Stream service. This will strengthen data integration between traditional financial markets and blockchain.
Technically, Link completed its movement towards the target zone we predicted in our analysis last week with the downward break of the $16.52 support level. With the price retreating to the $14 band, we see that the target level of the previous Head and Shoulders (H&S) formation worked exactly as predicted and that the decline has entered its final stage in technical terms.
On the current chart, the price has formed a bottom in the $14.30 region, rebounded in the short term, and with this rebound, the price has retested the $16.52 level that was broken last week. However, it is important to note that this region has now turned into a resistance level. The fact that the daily close did not occur above $16.52 indicates that the price is still moving within a downward trend and that the short-term rebound does not yet signal a trend reversal. Looking at the current pricing structure, the $16.83 level is the key area that will determine the direction of the short-term movement. If the price stays above this level, we can talk about a potential recovery up to the $17.70 and $18.67 levels. The $18.67 level, in particular, intersects with both horizontal resistance and the falling trend line. If broken, the price could end its medium-term downtrend and gain momentum towards the $19.80 – $21.00 range.
However, it should be noted that if the price falls below $16, selling pressure could increase again, and the $15.65–$14.30 support zone could come back into play. Falling below this region would confirm that buyers are losing strength and could put the price into a correction process that could pull it back below the formation target, to the $10.80–11.00 range. The Relative Strength Index (RSI) indicator is currently at 44.60, having partially recovered from last week’s negative zone. The positive divergence formed by the RSI in the bottom zone supports the price forming a base in the $14 band. However, the indicator still trading below the neutral level indicates that there is no sharp recovery in momentum.
Supports: 15.65 – 14.30 – 10.89
Resistances: 16.83 – 18.67 – 20.25
SUI/USDT
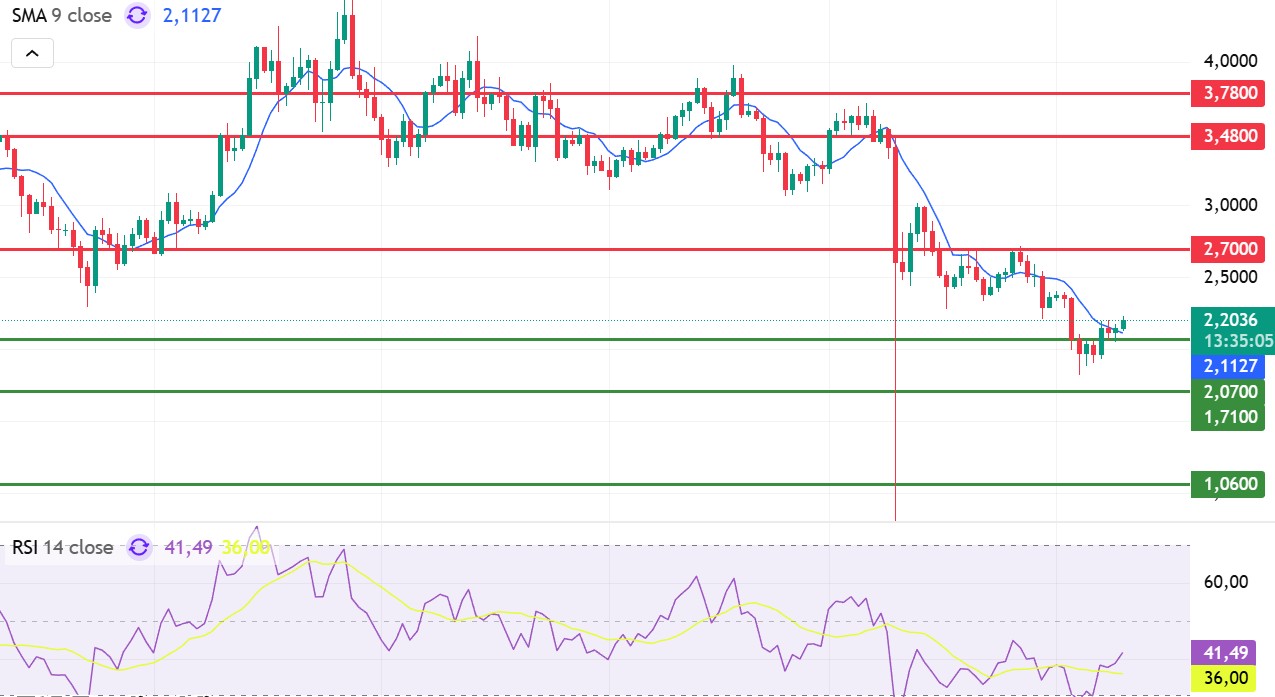
This week, the Sui (SUI) ecosystem attracted attention with significant developments despite the downturn in the crypto market. The new consensus engine called “Mysticeti v2” developed for the SUI network was released. With this update, the transaction confirmation process was improved, erroneous steps were eliminated, and the overall efficiency of the system was increased. This resulted in significant progress in the transaction speed and scalability of the SUI network.
Additionally, the Sui Foundation, SUI Group Holdings (NASDAQ SUI G), and Ethena Labs continue to work on the stablecoin USDi. This collaboration aims to bring new stablecoin solutions to the SUI network.
Overall, the SUI ecosystem has taken a major step forward this week with increased liquidity, updates to infrastructure improvements, and new tools offered to developers.
Following recent developments, when we look at Sui’s technical outlook, we see that the price has been moving sideways at around $2.20 on a weekly basis, influenced by fundamental developments. The Relative Strength Index (RSI) is currently in the 41.49 – 36.00 range. This range indicates that the market is trading close to the buy zone; a drop in the RSI to the 35.00 – 30.00 range could signal a potential buying opportunity. If the price moves upward, the $2.70, $3.48, and $3.78 levels can be monitored as resistance points. However, if the price falls to new lows, it could indicate that selling pressure is intensifying. In this case, the $2.07, $1.71, and $1.06 levels stand out as support zones. Based on the trend line, a pullback to $1.71 appears technically possible. According to Simple Moving Averages (SMA) data, Sui’s average price is currently at $2.11. If the price remains above this level, it signals that the current uptrend could technically continue.
Supports: 1.06 – 1.71 – 2.07
Resistances: 2.70 – 3.48 – 3.78
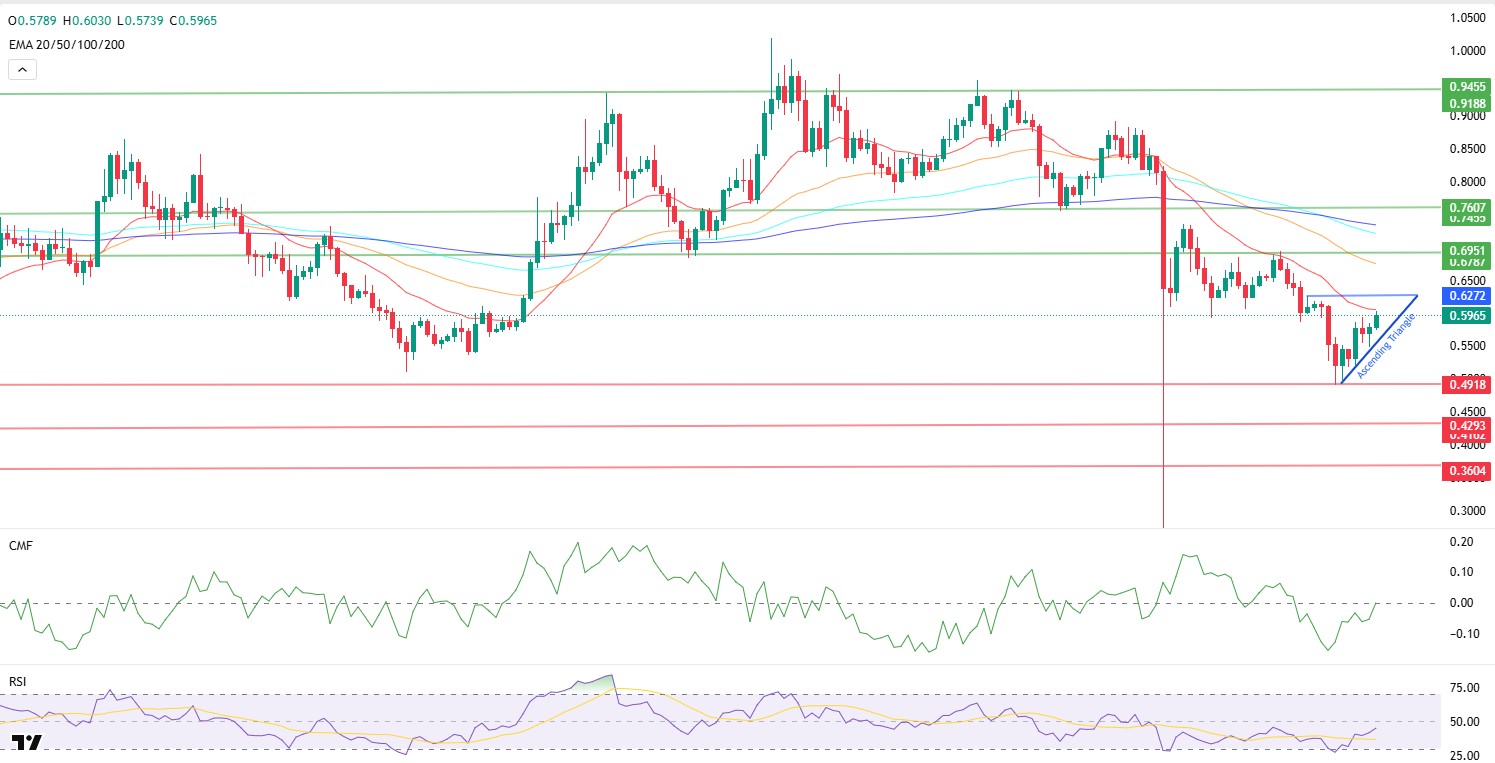
ADA/USDT
Since last week, the ADA price has gained 4% in value, rising to $0.5975. The increase of over 3% in TVL (Total Value Locked) supported Cardano’s decline in cash outflows, with weekly outflows of $0.1 million in fund flows.
On-chain data shows that the number of active addresses on the Cardano network has risen to 21,211. With a stablecoin market value reaching $39 million, it can be said that DeFi liquidity has increased. The possibility of selling pressure on ADA’s price may increase as its FDV (Fully Diluted Valuation) value reached $26,988 thousand.
Technically speaking, the ADA price took its first reaction by approaching the 20-day Exponential Moving Average (EMA 20 – Red Line) with an upward movement. Continuing its course within the ascending triangle formation since last week, ADA presents the support line of the formation at the $0.5511 level, indicating that buyers are willing to purchase at higher prices with each pullback, showing that buying pressure is increasing over time. A retest of this area could play a critical role in completing the ascending triangle formation. With the price consolidation, buyers continuously buying at higher lows may push the price above the resistance level of $0.6272. If the price breaks above the 20-day Exponential Moving Average (EMA 20 – Red Line), it is expected to close above the 50-day Exponential Moving Average (EMA 50 – Blue Line). If the price closes above the second resistance point at $0.6951, the major resistance point at $0.7607 could be targeted. The Relative Strength Index (RSI) continues to trade in the mildly bullish zone around the 45 level, while the Chaikin Money Flow (CMF-20) remains at the 0.00 level, indicating that the correlation between the price and the neutral zone is working in harmony. If the price falls as a result of the macroeconomic data expected to be announced this week and the statements made by FED members, the important levels we will follow are $0.4918 and $0.4293.
Supports: 0.4918 – 0.4293 – 0.3604
Resistances: 0.7607 – 0.6951 – 0.6272
Legal Notice
The investment information, comments, and recommendations contained in this document do not constitute investment advisory services. Investment advisory services are provided by authorized institutions on a personal basis, taking into account the risk and return preferences of individuals. The comments and recommendations contained in this document are of a general nature. These recommendations may not be suitable for your financial situation and risk and return preferences. Therefore, making an investment decision based solely on the information contained in this document may not result in outcomes that align with your expectations.