MARKET SUMMARY
Kripto Varlıklarda Son Durum
| Varlıklar | Son Fiyat | 24 saat Değişim | Hakimiyet | Market Cap. |
|---|---|---|---|---|
| BTC | 67,456.00 | 1.62% | 57.74% | 1.34 T |
| ETH | 2,530.00 | -1.65% | 13.16% | 304.60 B |
| SOLANA | 174.74 | 5.07% | 3.55% | 82.15 B |
| XRP | 0.5287 | 0.71% | 1.30% | 29.98 B |
| DOGE | 0.1396 | 1.59% | 0.89% | 20.48 B |
| TRX | 0.1636 | 2.50% | 0.61% | 14.15 B |
| CARDANO | 0.3432 | -2.81% | 0.52% | 12.01 B |
| AVAX | 26.72 | 0.34% | 0.47% | 10.88 B |
| SHIB | 0.00001774 | 0.70% | 0.45% | 10.45 B |
| LINK | 11.43 | 0.68% | 0.31% | 7.17 B |
| DOT | 4.188 | -0.74% | 0.27% | 6.32 B |
*Prepared on 10.24.2024 at 13:30 (UTC)
WHAT’S LEFT BEHIND
US Applications for Unemployment Benefits were announced.
Announced: 227K
Expectation 243K
Previous 241K
Ripple CEO Evaluates Trump-Harris Race!
Stating that the crypto industry will experience a “reset” no matter which candidate wins, Garlinghouse said he expects better crypto regulations after the US elections and stated that he is optimistic about this. Ripple CEO Brad Garlinghouse also said that although his company has been in dispute with the SEC for years, he is confident that the XRP ETF will be approved.
Million Dollar Investment in Bitcoin from Metaplanet
Metaplanet, a Japanese investment firm, has increased its Bitcoin investments with a share sale that attracted a lot of interest from individual investors, which could be an important turning point for the cryptocurrency market. This development offers important clues about the future of both the company and the industry. With the support of individual investors, Metaplanet raised $66 million in funding and increased its Bitcoin purchases, bringing its holdings to 855 BTC.
HIGHLIGHTS OF THE DAY
Önemli Ekonomik Takvim Verileri
| Zaman | Haberler | Beklenti | Önceki |
|---|---|---|---|
| 13:45 | ABD Flash İmalat PMI (Ekim) | 47.5 | 47.3 |
| 13:45 | ABD Flash Hizmetler PMI (Ekim) | 55.0 | 55.2 |
| 14:00 | ABD Yeni Konut Satışları (Eylül) | 719K | 716K |
BİLGİ
*Takvim UTC (Koordineli Evrensel Zaman) zaman dilimini temel alır.
İlgili sayfada yer alan ekonomik takvim içeriği güvenilir haber ve veri sağlayıcılardan elde edilmektedir. Ekonomik takvim içeriğinde yer alan haberler, haberlerin açıklanma tarihi ve saati, önceki, beklenti ve açıklanan rakamlardaki olası değişiklikler veri sağlayıcı kurumlar tarafından yapılmaktadır. Benzer durumlardan kaynaklanabilecek olası değişikliklerden Darkex sorumlu tutulamaz.
PAZAR PUSULASI
In a period when the macro-outlook was decisive in asset prices, the increased risk appetite after the US Federal Reserve’s (FED) Beige Book released yesterday was due to the thought that the expectations that the FED would continue to cut interest rates were confirmed. The upward turn in major crypto assets, which started yesterday, continued during European trading in a relatively calmer tone. Stock market indices rose today on the back of the weak-positive sentiment brought by FED expectations and corporate balance sheets. Apart from Dow Jones, US futures also point to a higher opening compared to yesterday.
The US Unemployment Claims data released today showed that the number of applications was 227K, below the market expectation of 243K. There was talk that this figure could exceed expectations due to natural disasters in some parts of the country, but the data, which was below forecasts, pointed to a better employment market. Immediately after the release of the data, an upward trend was observed in the dollar. We also saw a similar movement in the 10-year bond yield. In the rest of the day, macro indicators from the US will be monitored and among these, we think that the manufacturing PMI data is slightly more important.
TECHNICAL ANALYSIS
BTC/USDT
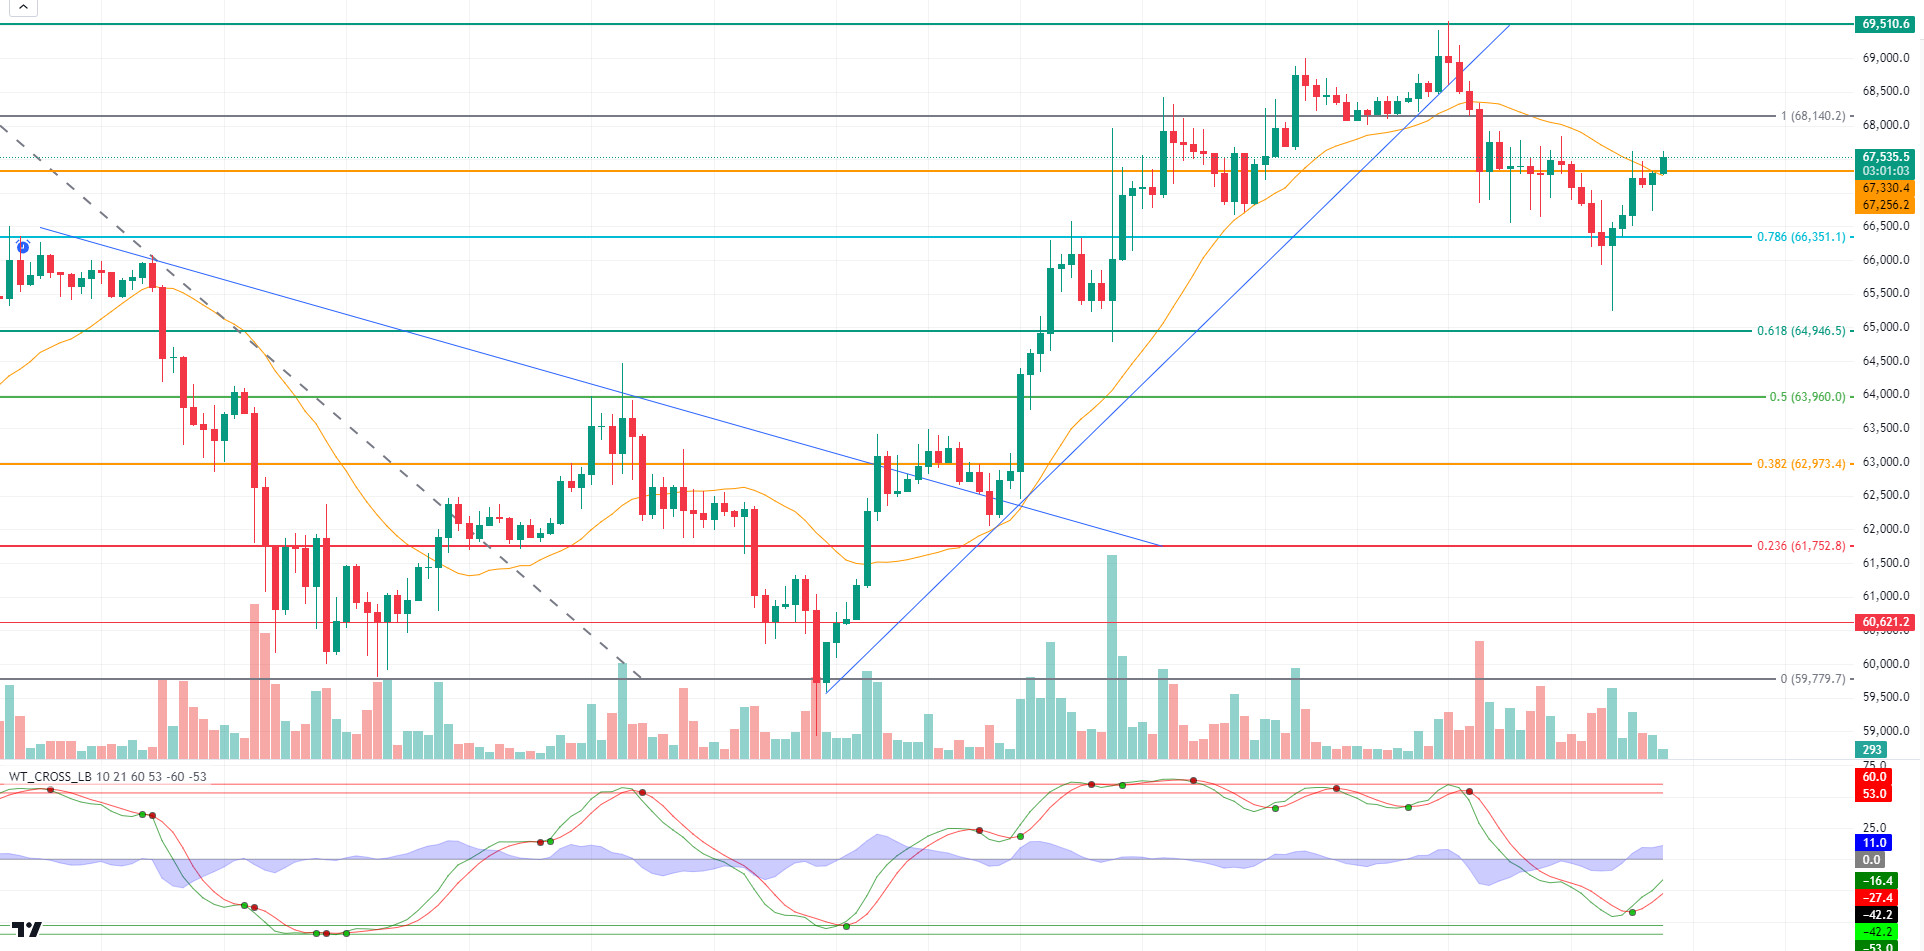
As we mentioned in our analysis in the morning, we witnessed a retreat in the Bitcoin price with the dominance of the bears in the short term in the market dominated by bears and bulls. Declines in Bitcoin to gain momentum before the new ATH level will be effective in collecting demand. As the US elections approach, the increasing likelihood of D. Trump’s win every day creates an optimistic atmosphere in the Bitcoin price in the long term, while the current government may bring to mind the possibility of Bitcoin sales. In such a scenario, it may be very difficult to measure the depth of the declines.
If we look at the BTC technical outlook, the price, which retreated with selling pressure at 69,500, the level at which it peaked, moved to the minor support level of 67,330 for a while and could not hold here, allowing it to test the Fibonacci 0.786 (66,351) level. Hourly closes below this level may bring a move towards 0.618 (64.946). It is noteworthy that our technical indicator, the wave trend oscillator, has not yet received an upward signal in the 4 hours. Otherwise, a reaction from the Fibonacci 0.786 (66.351) support level with the effect of optimistic weather may move the price back to the 67.330 level.
Supports 66,350 – 64,946 – 63,960
Resistances 67,330 – 68,140 – 69,510
ETH/USDT
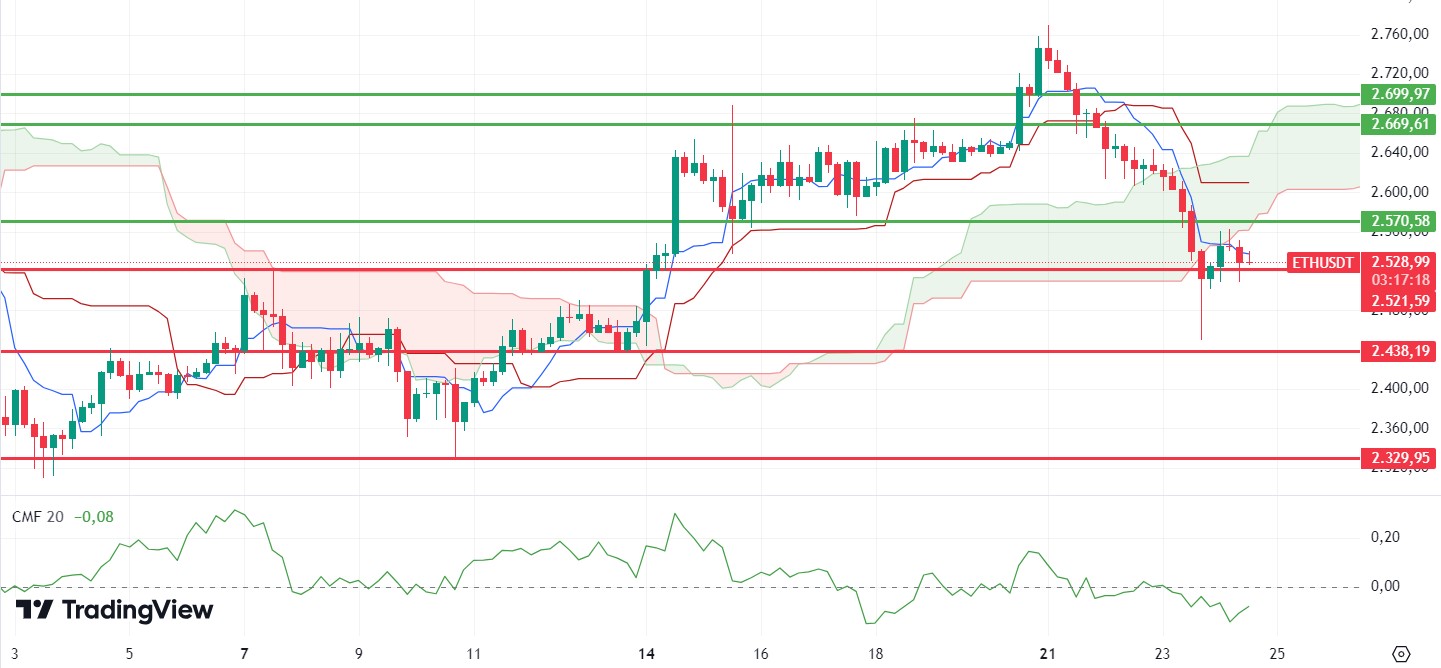
On a day when bitcoin was relatively flat, ETH fell slightly to 2,521 again. Chaikin Money Flow (CMF) moved slightly upwards but is still in negative territory. Looking at the Ichimoku indicator, it is seen that the kumo cloud and tankan level have been lost. With the weakness in ETH, the downtrend can be expected to continue for a few days. If the 2,571 level is regained, it can be said that the most important main support point for ETH, which can take a positive outlook again, is 2,438 and the most important resistance level is 2,669.
Supports 2,521 – 2,438 – 2,329
Resistances 2,571 – 2,669 – 2,699
LINK/USDT
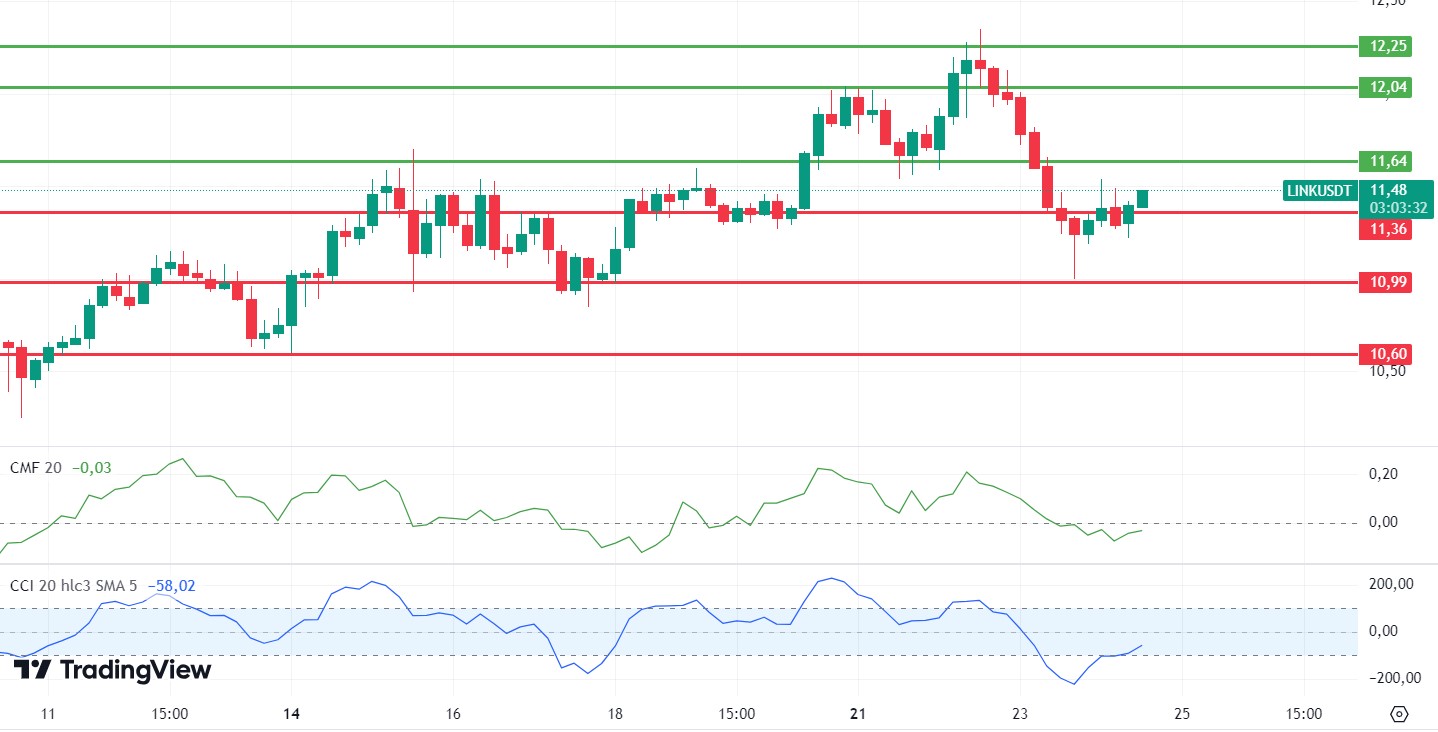
For LINK, which is trying to hold on to 11.36 support momentarily, we see that the Commodity Channel Index (CCI) has produced a buy signal and Chaikin Money Flow (CMF) is about to return to the positive area again. In the light of this data, it can be said that there may be rises up to 11.64 levels, provided that the 11.36 level is not lost. Exceeding the 11.64 level may turn the trend back to positive and bring sharp rises. Closures below the 11.36 level may bring declines down to 10.99 levels.
Supports 11.36 – 10.99 – 10.60
Resistances 11.64 – 12.04 – 12.25
SOL/USDT
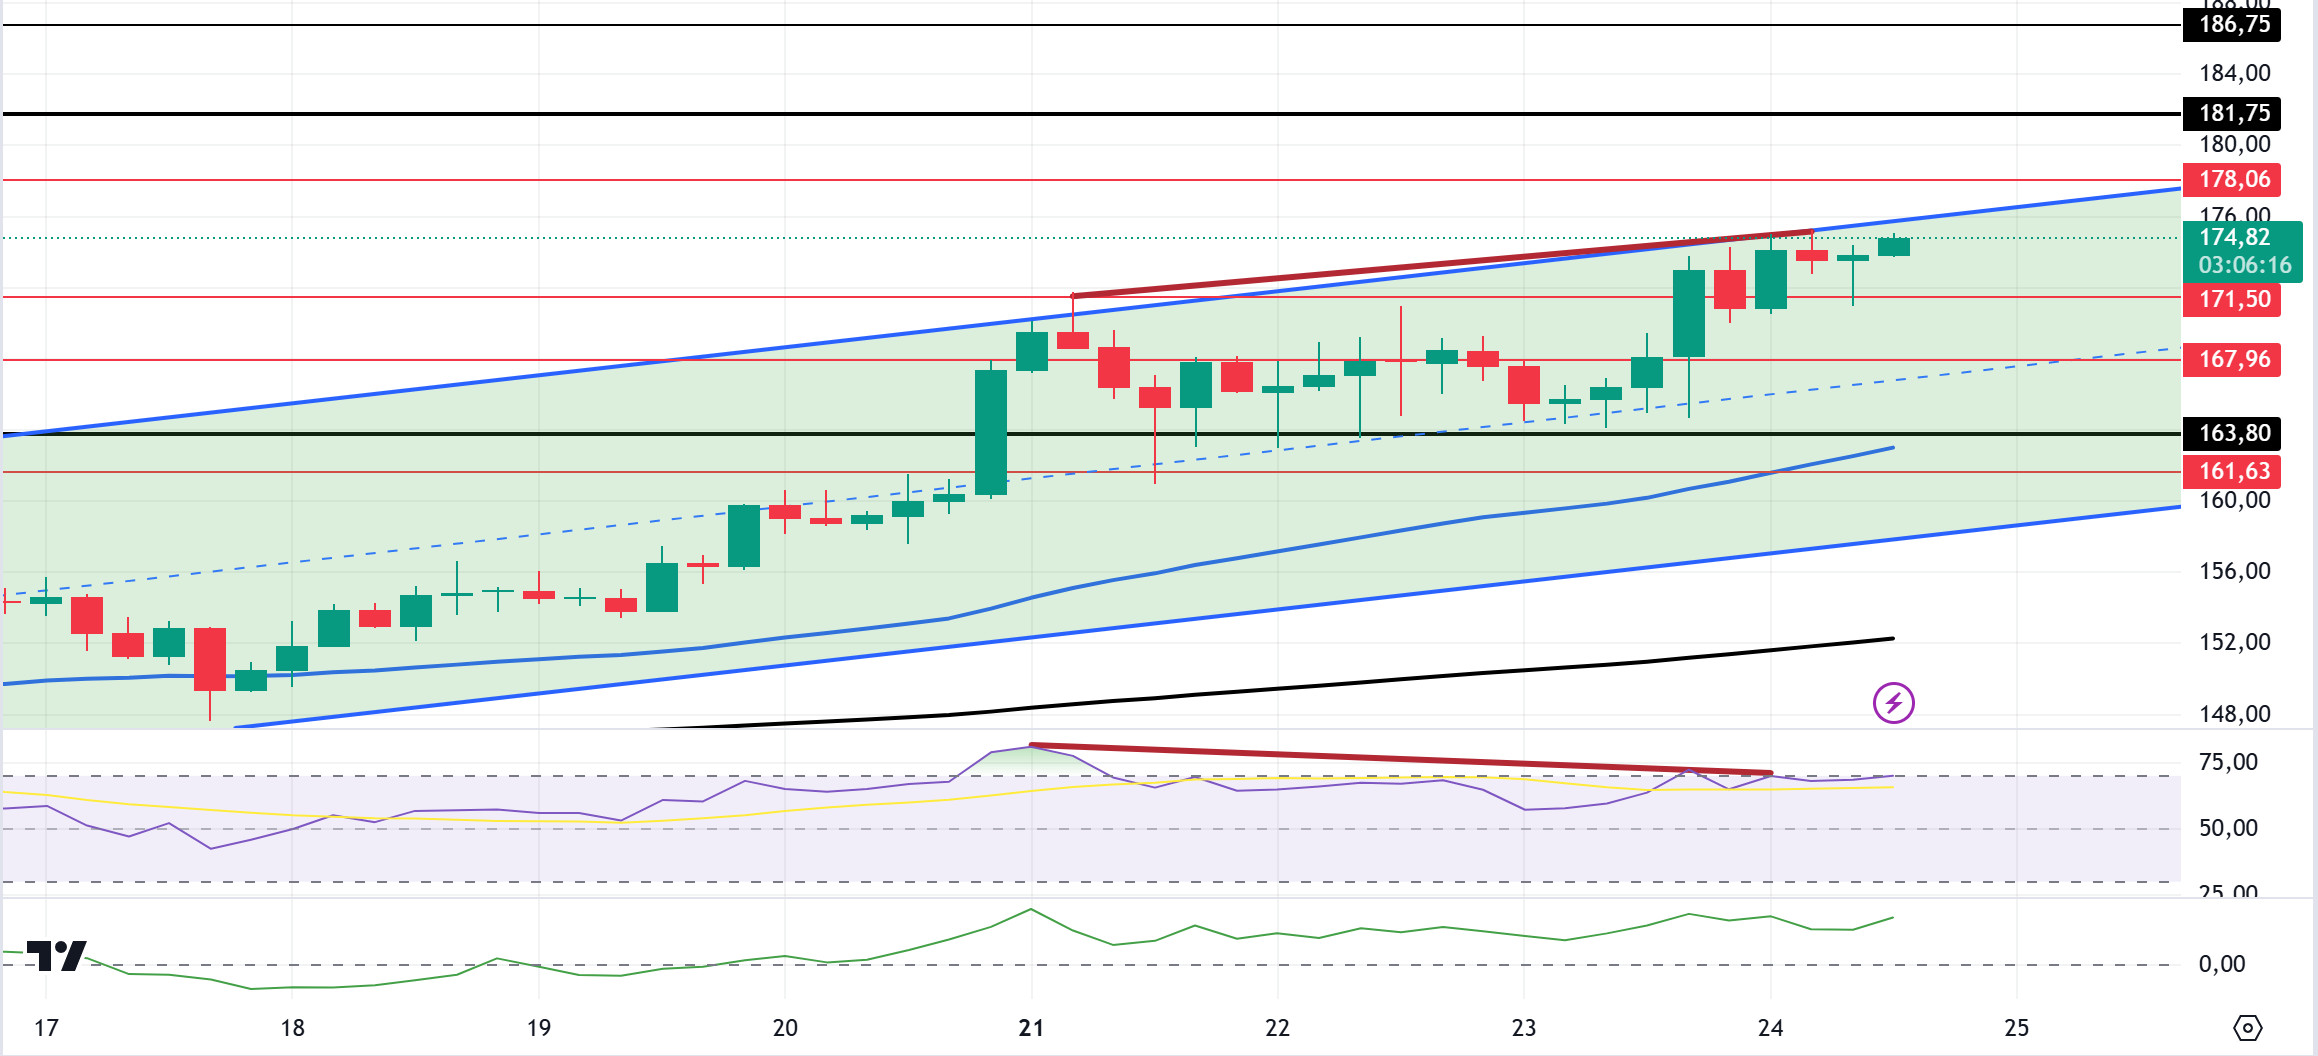
Flash Manufacturing PMI data from the US should be followed today. However, US unemployment claims data was announced. Although the expectation was 243 thousand, it remained at 227 thousand. Data below the expectation is positive for the markets. When we look at the chart, the 50 EMA (Blue Line) continues to be above the 200 EMA (Black Line) in the 4-hour timeframe. This may mean that the uptrend will continue. The price continued its uptrend yesterday, taking strength from 163.80, an important support level. However, the Relative Strength Index (RSI)14 indicator re-entered the overbought levels and a divergence occurred between the price and the indicator. However, Chaikin Money Flow (CMF)20 is at a very strong level. This indicates a large amount of money inflows. This enabled the price to test the top of the uptrend. The 181.75 level is a very strong resistance point in the uptrend driven by both macroeconomic conditions and innovations in the Solana ecosystem. If it rises above this level, the rise may continue strongly. In case of possible profit sales, support levels of 163.80 – 161.63 should be followed. If the price comes to these support levels, a potential bullish opportunity may arise.
Supports 171.50 – 167.96 – 163.80
Resistances 178.06 – 181.75 – 186.75
ADA/USDT
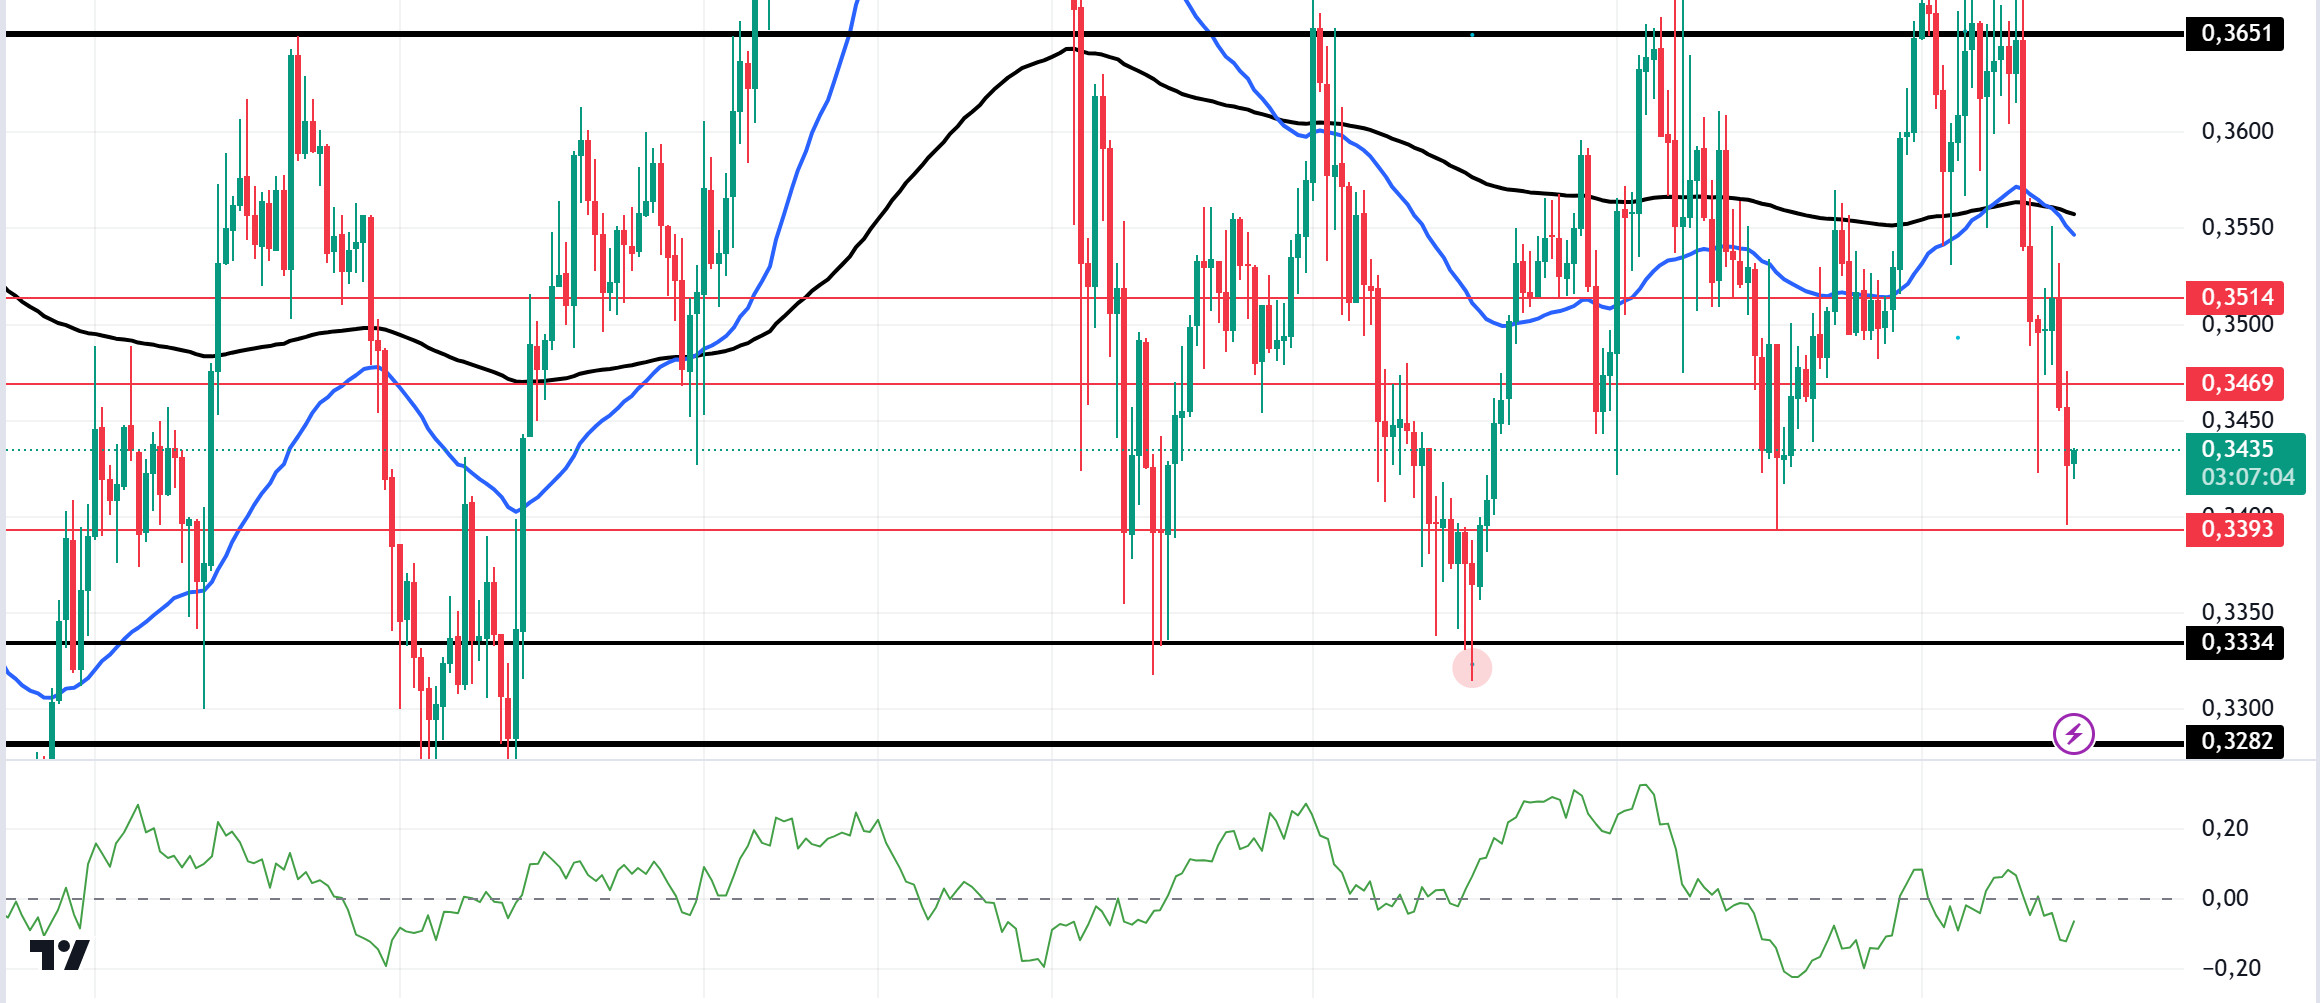
Flash Manufacturing PMI data from the US should be monitored today. Flash Manufacturing PMI data from the US should be followed today. However, US unemployment claims data was announced. Although the expectation was 243 thousand, it remained at 227 thousand. The data below the expectation is positive for the markets. It has lost 2.88% since the morning analysis and has continued to price in the region where it has been accumulating since Ekim 1. On the 4-hour chart, the price started pricing below the 50 EMA (Blue Line) and 200 EMA (Black Line). At the same time, the 50 EMA is below the 200 EMA. This suggests that the trend may be bearish. The Chaikin Money Flow (CMF)20 indicator has a negative value. For this reason, we see that there are money outflows. As a matter of fact, ADA, which tested the 0.3651 level for the fourth time, could not break it for this reason. If the decline continues, it may test the support level of 0.3334 once again. When it reaches this price level, it may be appropriate to buy.
Supports 0.3393 – 0.3334 – 0.3282
Resistances 0.3469 – 0.3514 – 0.3651
AVAX/USDT
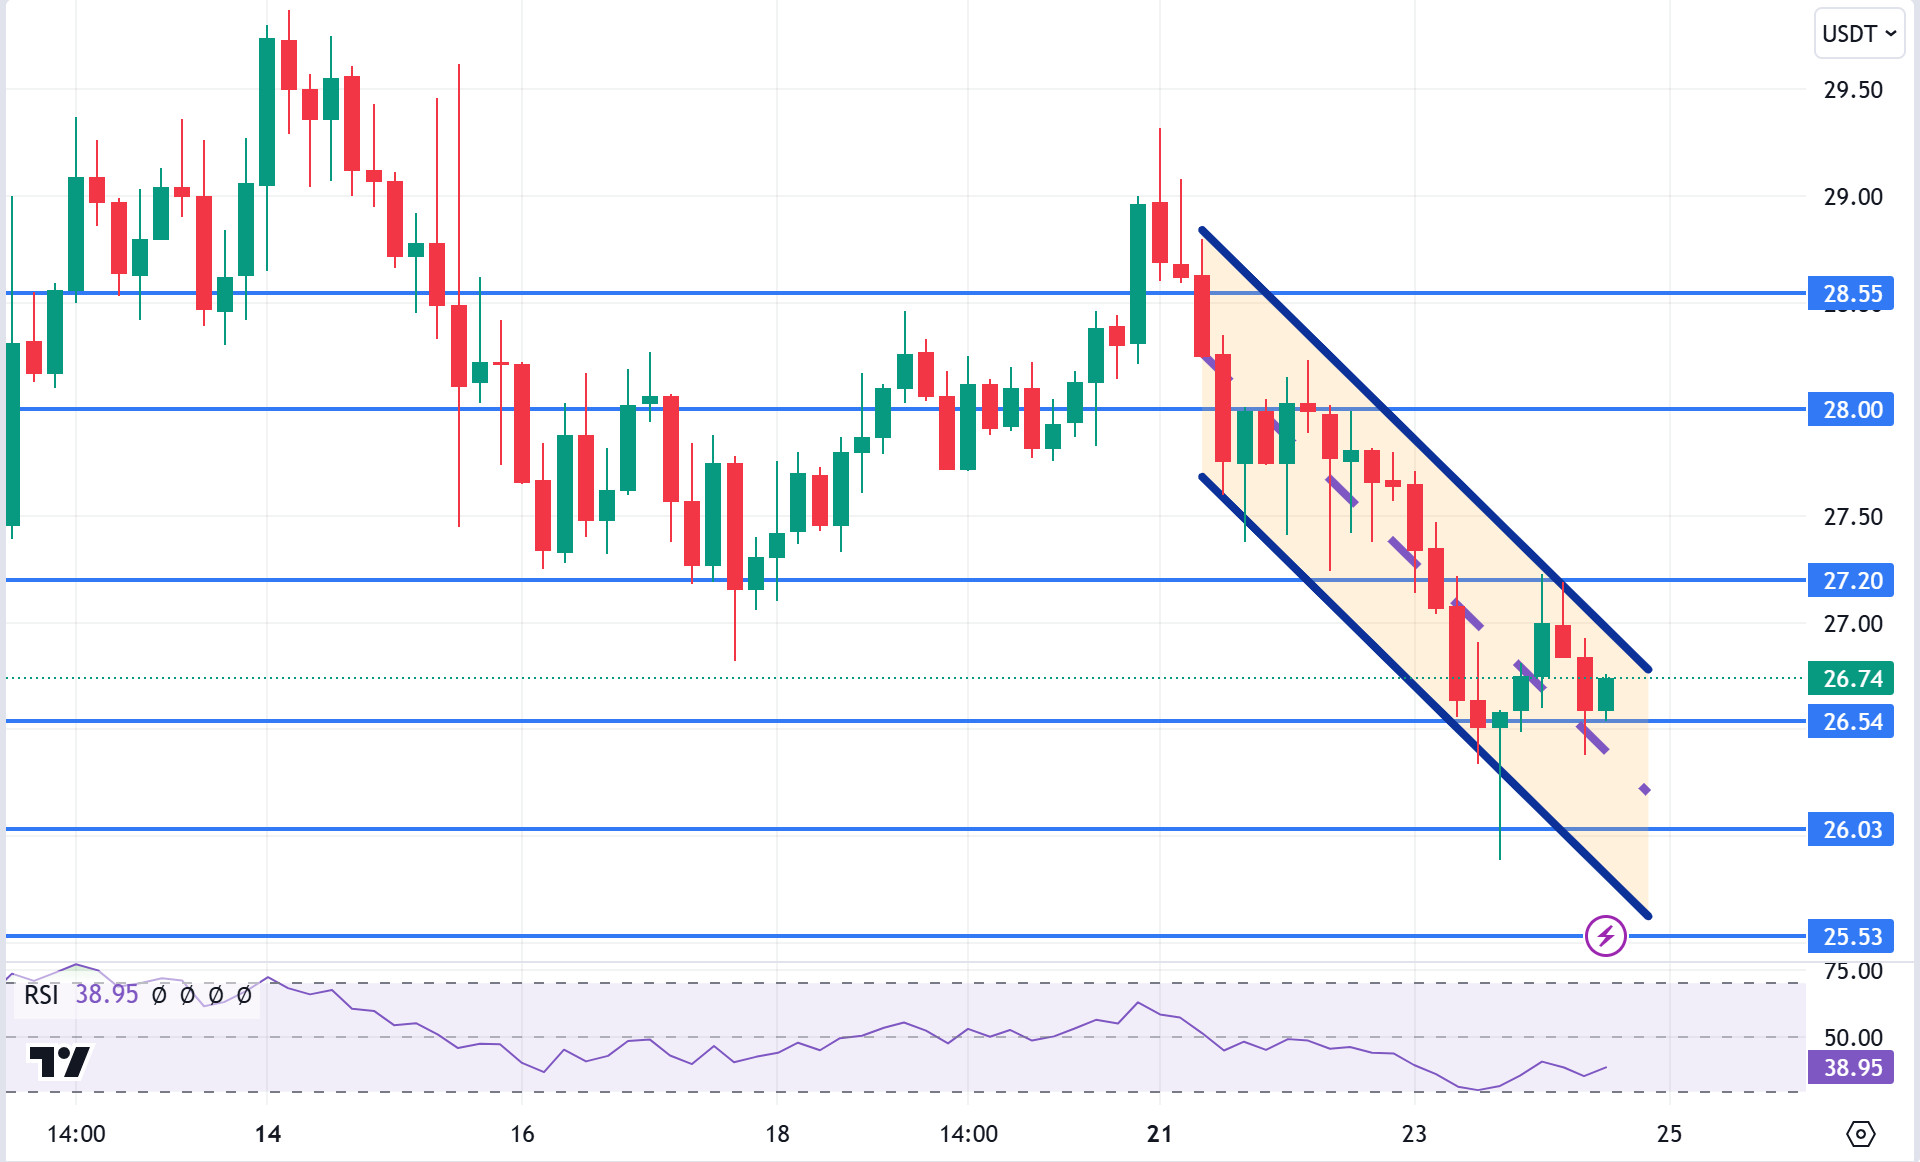
AVAX, which opened today at 26.75, is trading at 26.74, moving horizontally during the day. Applications for unemployment benefits were announced by the US today. Since the data came in slightly below the expectation, it did not contain an indicator for recession and therefore was not perceived negatively in the market. Manufacturing purchasing managers index, services purchasing managers index and new home sales data will also be released today. If the services and manufacturing purchasing managers’ indices and new home sales data are announced well below expectations, it may have a negative impact as it will increase the recession anxiety in the market. In addition, news flows from the Middle East will be important for the market.
On the 4-hour chart, it is in the middle band of the bearish channel. With a Relative Strength Index value of 38, it can be expected to rise slightly from these levels and move to the upper band. In such a case, it may test the 27.20 resistance. On the other hand, sales may increase if the fear of recession is triggered after the data to be announced or news of increased tension in the Middle East. In such a case, it may test 26.03 support. As long as it stays above 25.00 support during the day, the desire to rise may continue. With the break of 25.00 support, sales may increase.
Supports 26.54 – 26.03 – 25.53
Resistances 27.20 – 28.00 – 28.55
TRX/USDT
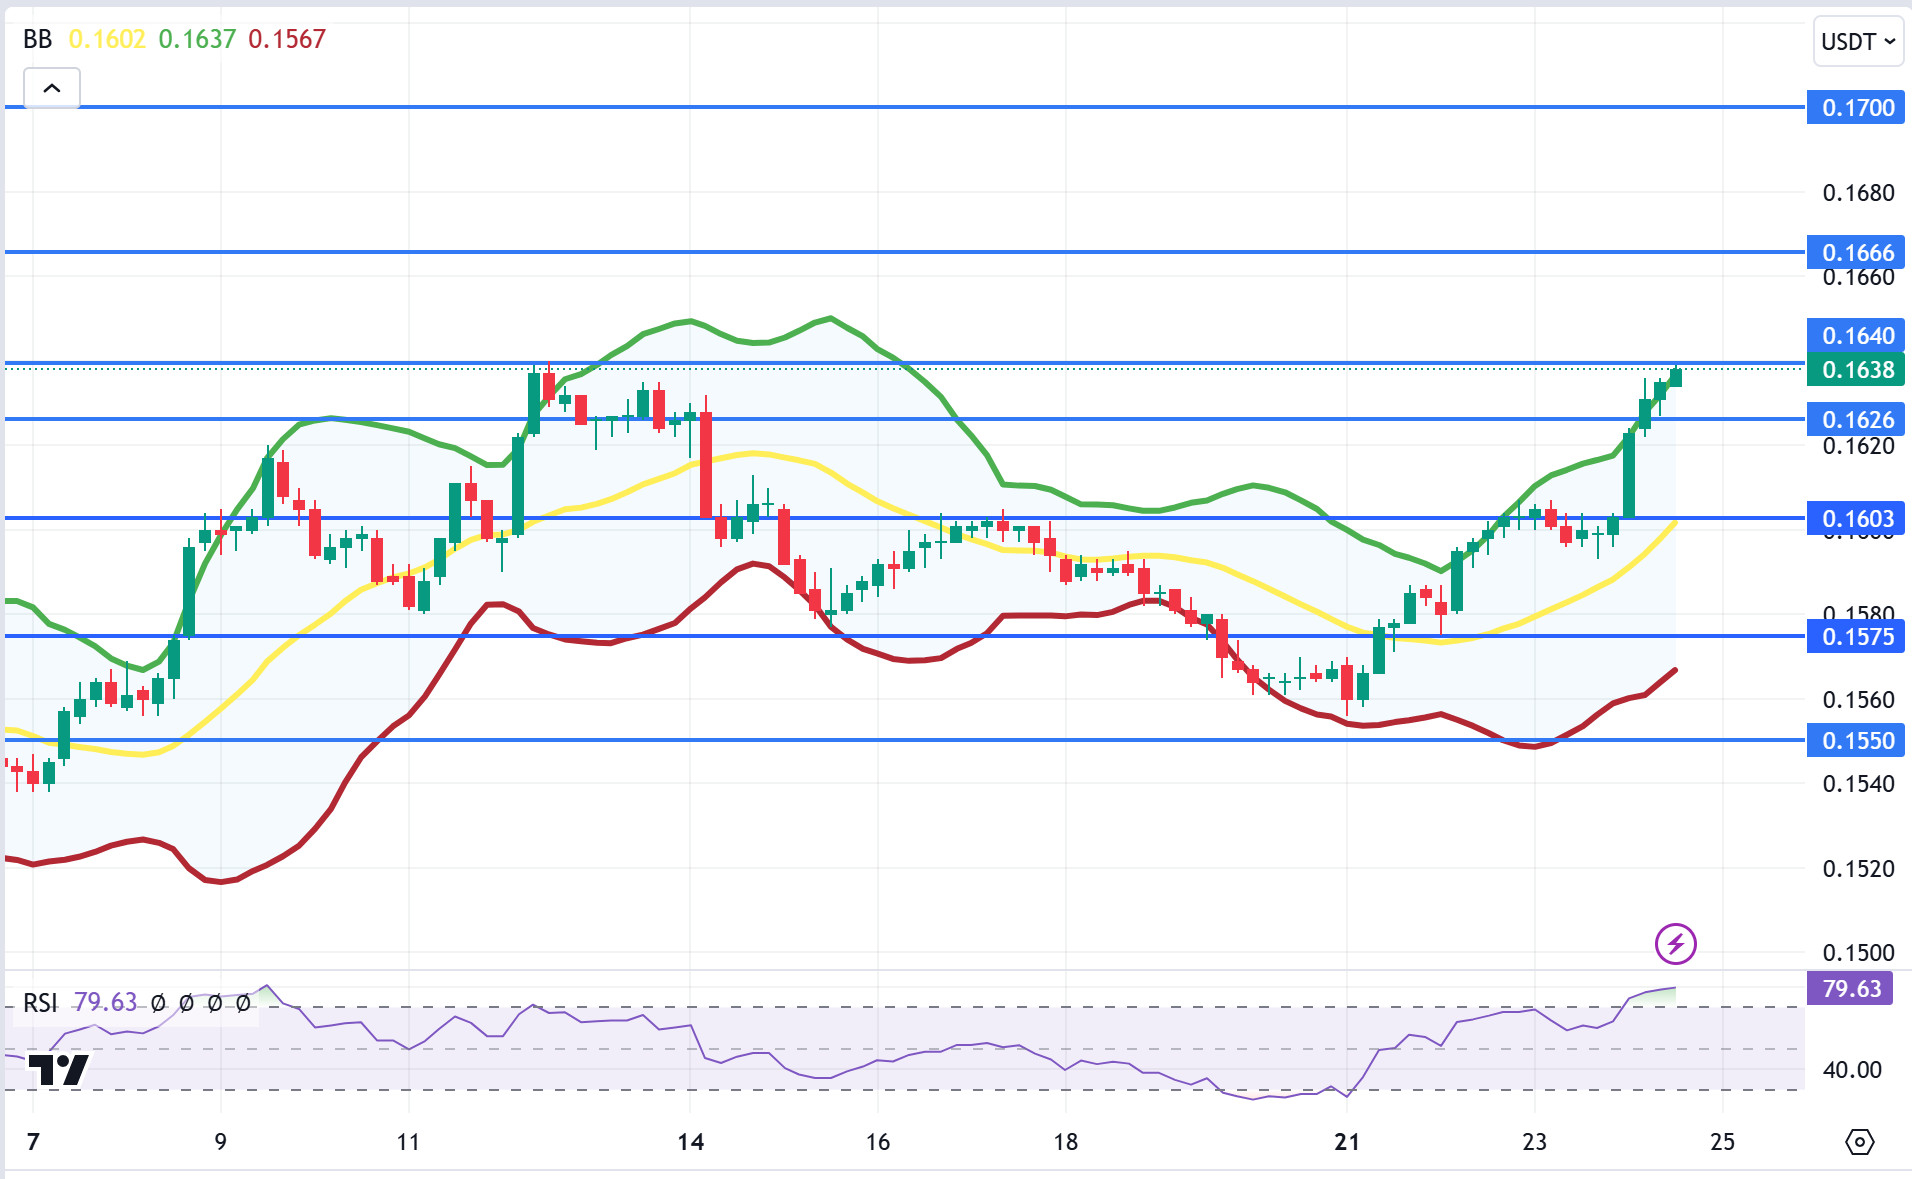
TRX, which started the day at 0.1603, is trading at 0.1638, up about 2% during the day. Today, manufacturing purchasing managers index, services purchasing managers index and new home sales data will be followed. Data released in line with expectations may have a positive impact. The market will also be closely following the news flows regarding the tension in the Middle East.
On the 4-hour chart, it is located at the Bollinger upper band. The Relative Strength Index value is in the overbought zone with 79 and can be expected to decline slightly from its current level. In such a case, it may move to the Bollinger middle band and test the 0.1603 support. However, it cannot close the candle below 0.1603 support and may test 0.1666 resistance with the buying reaction that will occur if news flow comes that the tension in the Middle East is decreasing. As long as TRX stays above 0.1482 support, the desire to rise may continue. If this support is broken downwards, sales can be expected to increase.
Supports 0.1626 – 0.1603 – 0.1575
Resistances 0.1640 – 0.1666 – 0.1700
DOT/USDT
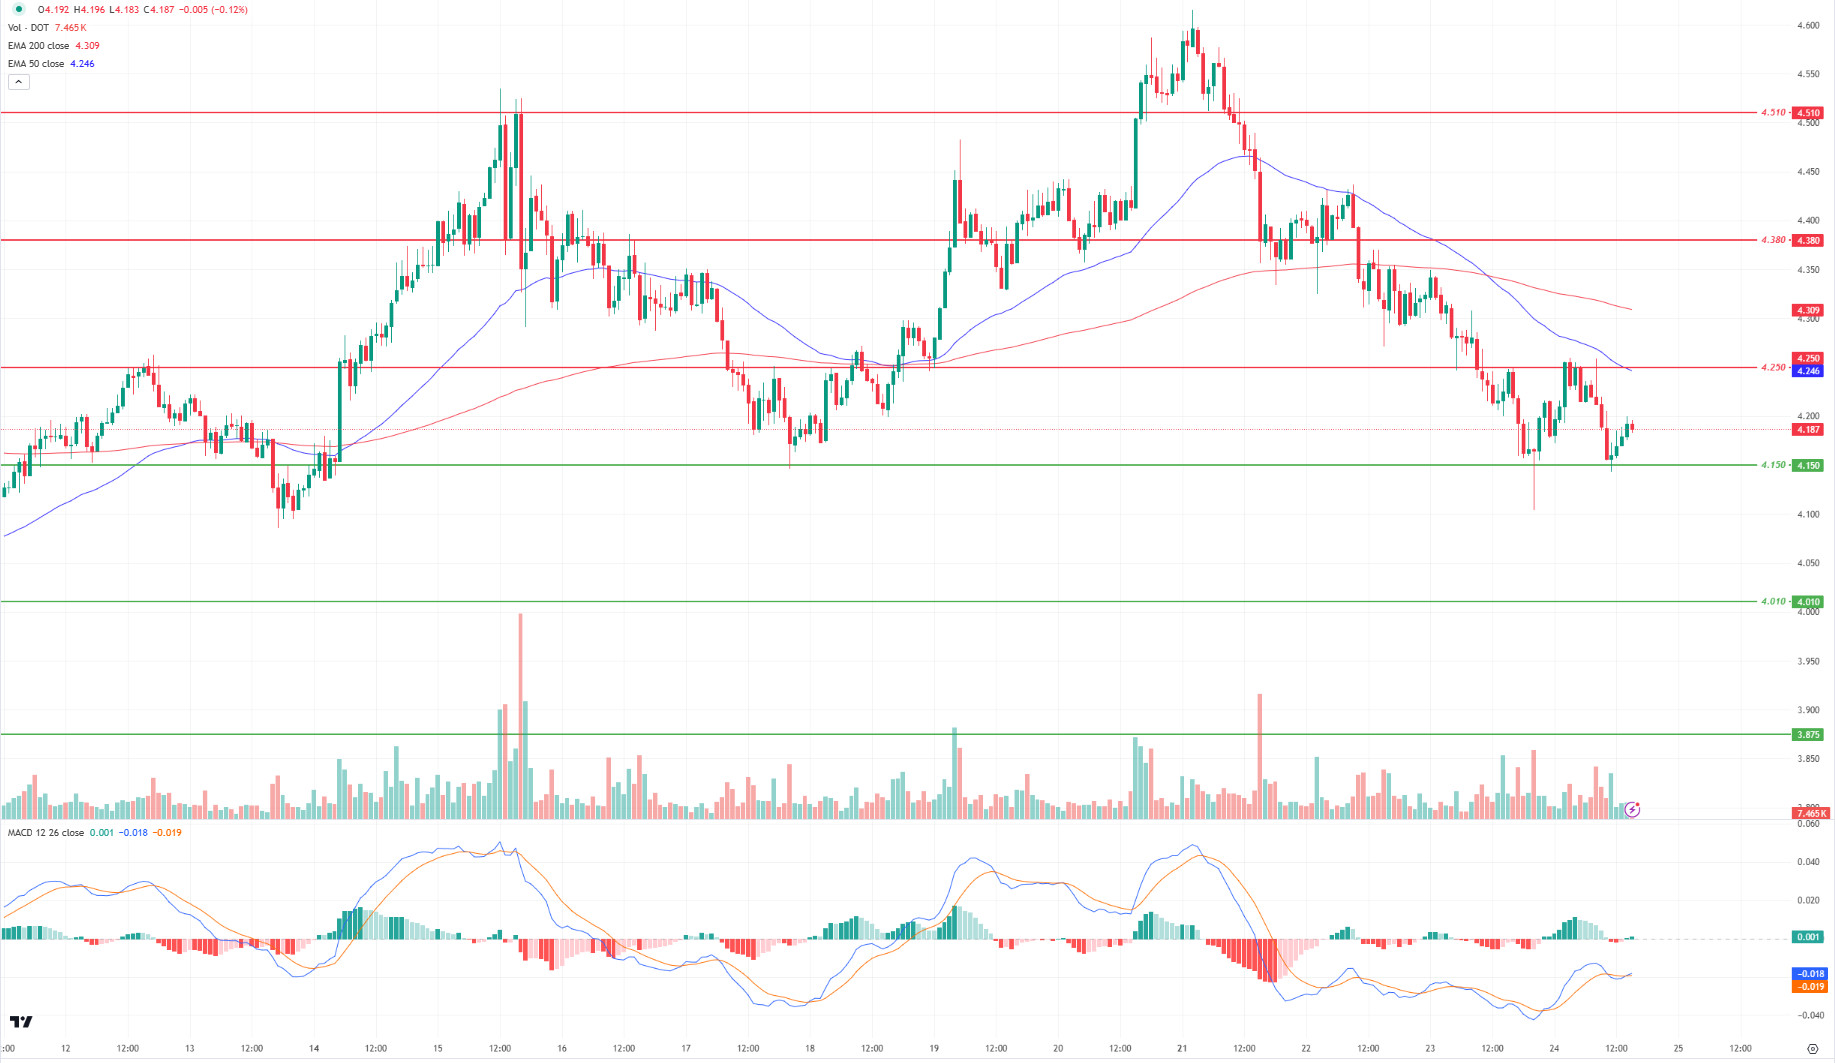
When we examine the Polkadot (DOT) chart, after the negative divergence between On Balance Volume (OBV) and the price, the price retreated from the 4.250 resistance level to the 4.150 support level. Reacting from the 4.150 support level, DOT may retreat to 4.010 bands if it loses the 4.150 support level in a negative scenario. On the other hand, when we examine the MACD oscillator, we see that the buyer pressure has increased compared to the previous hour. In this context, if the price persists above the 4,250 resistance level, its next target may be the 4,380 resistance level.
Supports 4,150 – 4,010 – 3,875
Resistances 4.250 – 4.380 – 4.510
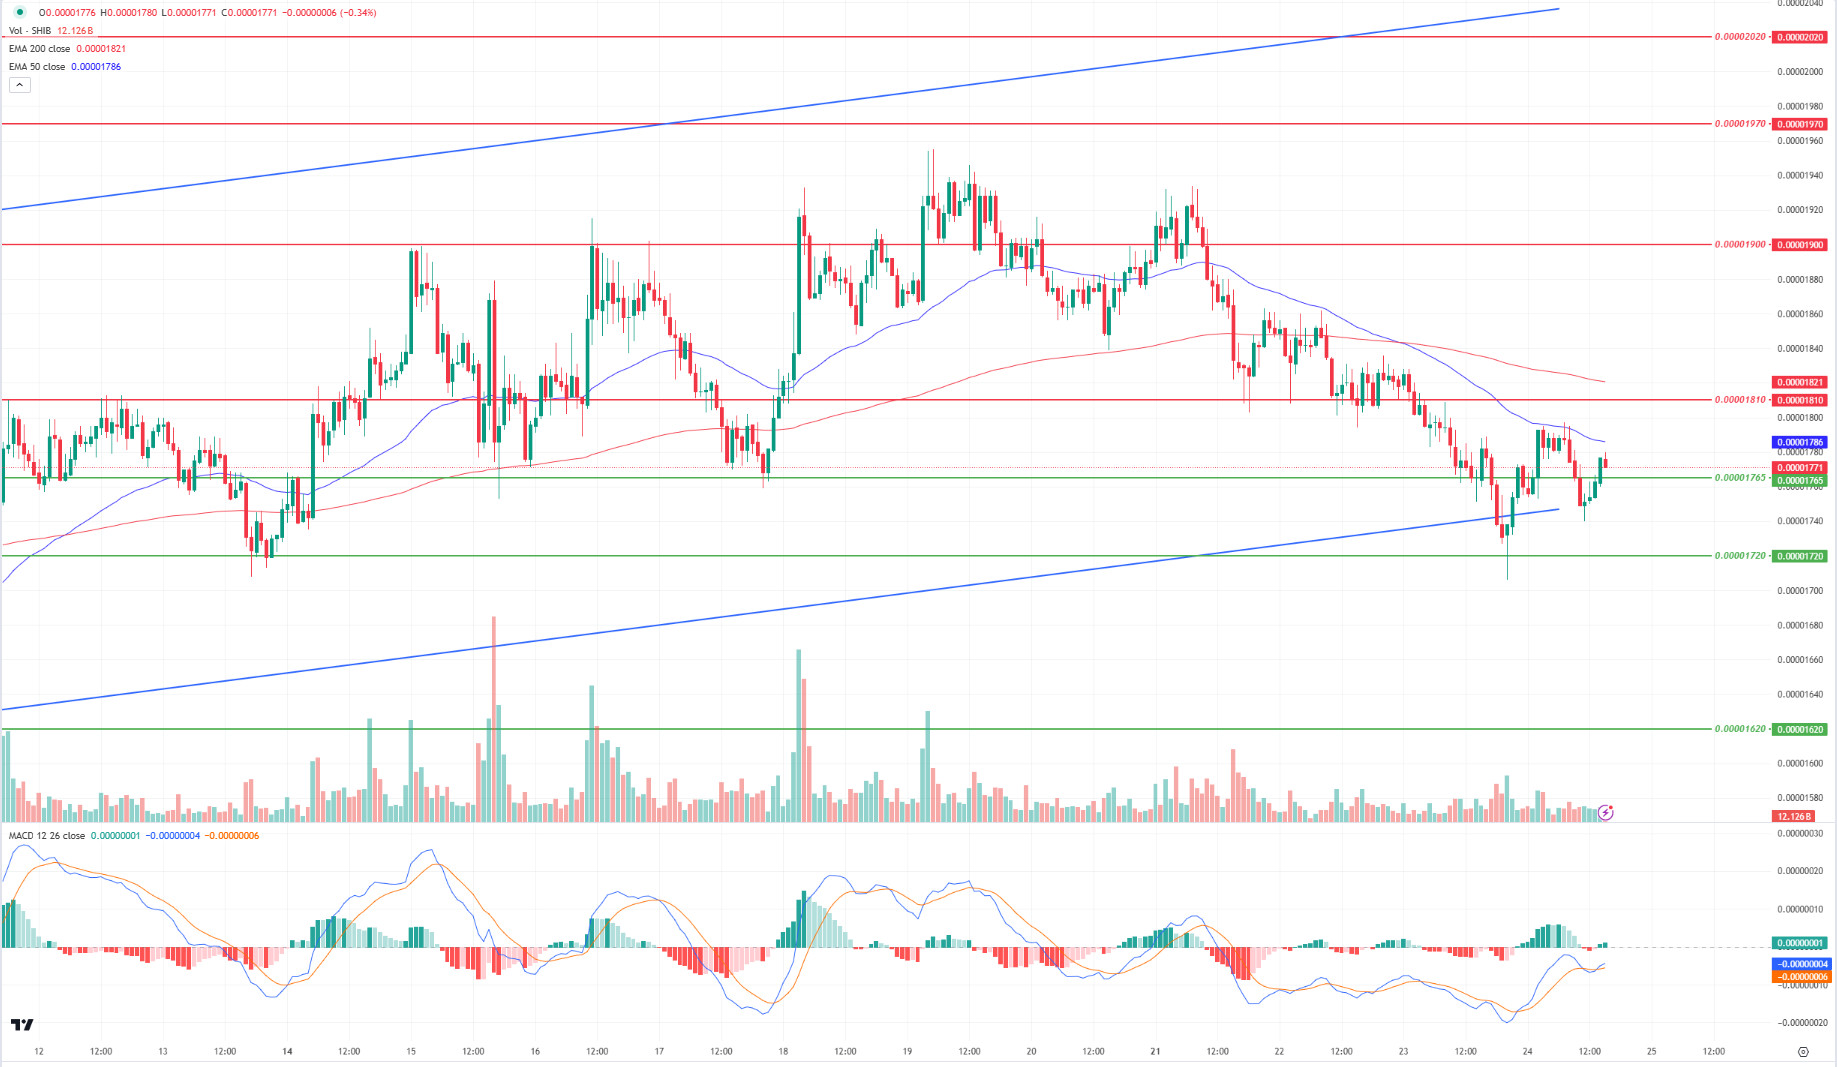
SHIB/USDT
Shiba Inu (SHIB) retested the lower band of the uptrend. The price, which managed to persist above the 0.00001765 support level, continues its upward movement. When we examine the MACD oscillator, we see that the buyer pressure has increased compared to the previous hour. In this context, the price may move to the 0.00001810 resistance level. On the other hand, if the 0.00001765 support level is lost, the price may retreat to the 0.00001720 bands.
Supports 0.00001765 – 0.00001720 – 0.00001620
Resistances 0.00001810 – 0.00001900 – 0.00001970
YASAL BİLDİRİM
Burada yer alan yatırım bilgi, yorum ve tavsiyeleri yatırım danışmanlığı kapsamında değildir. Yatırım danışmanlığı hizmeti, kişilerin risk ve getiri tercihleri dikkate alınarak yetkili kuruluşlar tarafından bireysel olarak verilmektedir. Burada yer alan yorum ve tavsiyeler genel niteliktedir. Bu tavsiyeler mali durumunuz ile risk ve getiri tercihlerinize uygun olmayabilir. Bu nedenle, sadece burada yer alan bilgilere dayanarak yatırım kararı vermeniz beklentileriniz doğrultusunda sonuç vermeyebilir.