
MARKET SUMMARY
Kripto Varlıklarda Son Durum
| Varlıklar | Son Fiyat | 24 saat Değişim | Hakimiyet | Market Cap. |
|---|---|---|---|---|
| BTC | 100,530.92 | 2.90% | 54.72% | 1,99 T |
| ETH | 3,929.93 | 6.97% | 13.02% | 473,71 B |
| XRP | 2.433 | 4.35% | 3.82% | 139,01 B |
| SOLANA | 230.16 | 4.62% | 3.03% | 110,12 B |
| DOGE | 0.4177 | 6.43% | 1.69% | 61,51 B |
| CARDANO | 1.164 | 15.09% | 1.12% | 40,89 B |
| TRX | 0.2943 | 8.23% | 0.70% | 25,38 B |
| AVAX | 50.34 | 13.46% | 0.57% | 20,63 B |
| LINK | 28.84 | 29.51% | 0.50% | 18,07 B |
| SHIB | 0.00002931 | 8.51% | 0.47% | 17,27 B |
| DOT | 9.422 | 12.82% | 0.40% | 14,38 B |
*Prepared on 11.12.2024 at 07:00 (UTC)
WHAT’S LEFT BEHIND
SEC Seeks Public Comment on NYSE Arca’s Bitwise Bitcoin and Ethereum ETF Listing
The US Securities and Exchange Commission (SEC) has requested public comment on the listing of Bitwise Bitcoin and Ethereum ETFs on NYSE Arca. Bitwise’s proposed spot cryptocurrency index fund aims to provide investors with easy access to BTC and ETH.
Trump family crypto project WLFI exchanges 5 million USDC for 1,325 ETH
According to Arkham data, the Trump family’s crypto project WLFI exchanged 5 million USDC for 1,325 ETH in multiple transactions. The average ETH price during the transactions was recorded at $3,773.
972.6 million USDT flowed from Tether Treasury to exchanges in the last 24 hours
According to Lookonchain data, 972.6 million USDT was transferred from Tether Treasury to exchanges, providing a huge amount of liquidity to the crypto market.
Ceffu-linked wallets deposit DOGE 73.8 million on Binance
The Data Nerd reported that a wallet affiliated with Ceffu deposited 11.27 million DOGE on Binance, while a total of 73.8 million DOGE (about $30.32 million) was transferred in the last 24 hours. The wallet holds 428.57 million DOGE with a total value of $170.26 million.
BlackRock and Fidelity bought $500 million worth of ETH in the last two days
According to Arkham data, BlackRock and Fidelity’s Ethereum ETFs bought a total of $500 million worth of ETH in two days. The transactions were executed through Coinbase and Coinbase Prime. On Aralık 10, the ETFs’ total trading volume exceeded $476 million.
Vancouver City Council passes motion to become a Bitcoin-friendly city
The city of Vancouver, Canada, has passed a motion to consider using Bitcoin for city financing. The City Council has taken action to explore the use of Bitcoin and make the city a “Bitcoin-friendly city”.
HIGHLIGHTS OF THE DAY
Önemli Ekonomik Takvim Verileri
| Zaman | Haberler | Beklenti | Önceki |
|---|---|---|---|
| NYM | Token Buyback | ||
| Aelf | First Halving | ||
| BNB | Global AI Show | ||
| Moonriver | Proposal MR64 Vote | ||
| 13:15 | EU ECB Interest Rate Decision (Dec) | 3.15% | 3.40% |
| 13:30 | US Unemployment Claims | 221K | 224K |
| 13:30 | US Core PPI (MoM) (Nov) | 0.2% | 0.3% |
| 13:30 | US PPI (MoM) (Nov) | 0.2% | 0.2% |
BİLGİ:
*The calendar is based on UTC (Coordinated Universal Time) time zone. The economic calendar content on the relevant page is obtained from reliable news and data providers. The news in the economic calendar content, the date and time of the announcement of the news, possible changes in the previous, expectations and announced figures are made by the data provider institutions. Darkex cannot be held responsible for possible changes that may arise from similar situations.
PAZAR PUSULASI
The US Consumer Price Index (CPI) for Kasım, released yesterday, was in line with expectations, presenting a picture that does not pose an obstacle to a rate cut by the Federal Reserve (FED) on Aralık 18. It is almost certain that the FED will cut interest rates next week. Today, Producer Price Index (PPI) data and Weekly jobless claims will be followed. In addition, the meeting of the European Central Bank (ECB), which is expected to cut interest rates, will be under the scrutiny of investors during European transactions.
On Aralık 5, after the sharp decline in digital assets, we saw a similar pricing on Aralık 9, this Pazartesi. On Salı, prices in major crypto assets, which approached the previous day’s lows, began to gain ground to recover. If we explain this situation in the case of Bitcoin, the price, which finally retreated to around 94,000, reached 101,800, the highest level seen on Aralık 6, with the current weather permitting. At this stage, it would not be surprising to see some respite in major cryptocurrencies. If the necessary conditions are met, the rise may continue, but we think that a catalyst will be needed for this.
From the short term to the big picture.
The victory of former President Trump on Kasım 5, which was one of the main pillars of our bullish expectation for the long-term outlook in digital assets, produced a result in line with our predictions. Afterwards, the appointments made by the president-elect and the expectations of increased regulation of the crypto ecosystem in the US continued to take place in our equation as a positive variable. Although Powell gave cautious messages in his last speech, the continuation of the FED’s interest rate cut cycle and the volume in BTC ETFs indicating an increase in institutional investor interest (in addition to MicroStrategy’s BTC purchases, BlackRock’s BTC ETF options started trading…) support our upward forecast for the big picture for now.
In the short term, given the nature of the market and pricing behavior, we think it would not be surprising to see occasional pauses or pullbacks in digital assets. However, at this point, it is worth emphasizing again that the fundamental dynamics continue to be bullish.
TECHNICAL ANALYSIS
BTC/USDT
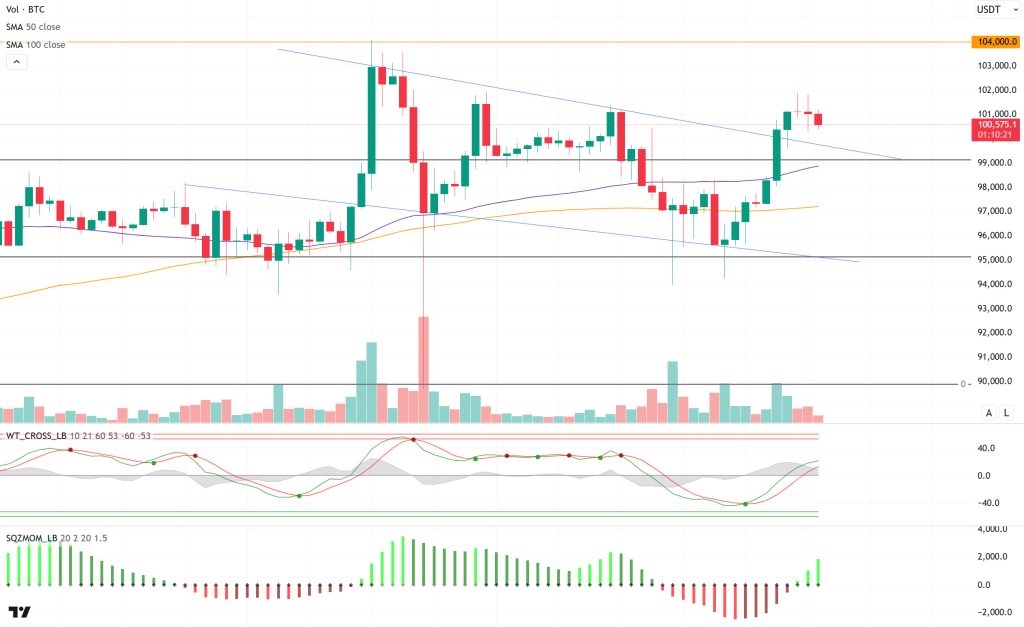
Institutional investors’ interest in Bitcoin spot ETFs continues to grow. ETFs, which witnessed positive inflows for the tenth consecutive day, prevented deep declines in Bitcoin and limited corrections. The US Securities and Exchange Commission’s (SEC) request for public comment on the listing of Bitwise Bitcoin and Ethereum ETFs on NYSE Arca once again demonstrated the expanding and changing market conditions.
When we look at the technical outlook with the developments on the fundamental side, BTC gained momentum in the upward direction after the inflation data that came within expectations. The price, which surpassed the minor resistance level of 99,140, tested six-digit levels again and rose as high as 101,800. Currently trading at 100,600, BTC’s technical oscillators continue to maintain the buy signal on the hourly chart, while the momentum indicator has moved back into positive territory. With this rise, BTC, which broke the falling trend channel upwards, can be expected to try a new ATH if the trend channel is maintained above the trend channel. In the event of a possible pullback, the upper trend line acts as support, while breaking down may cause the falling trend channel to be active again.
Supports 99,140 – 97,200 – 95,000
Resistances 102,450 – 103,500 – 104,000
ETH/USDT
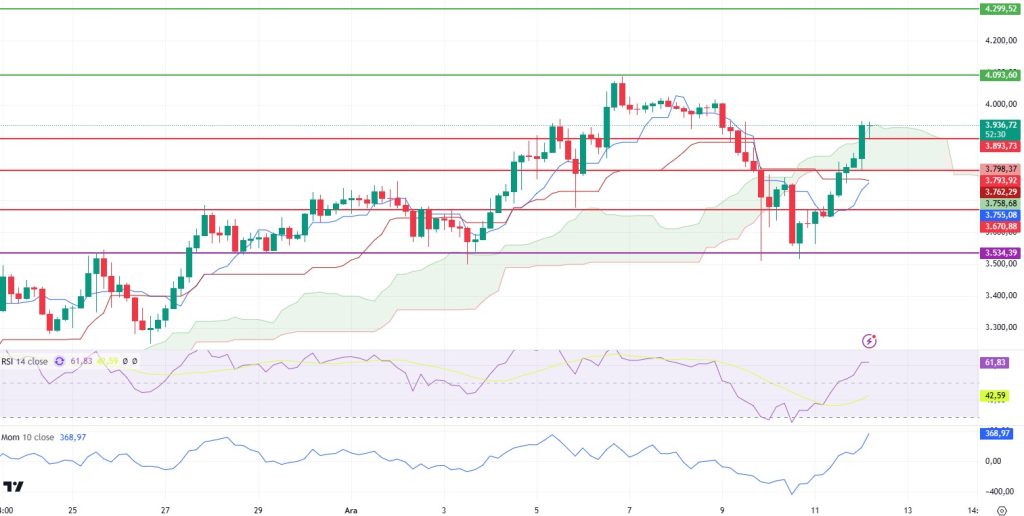
Ethereum (ETH) surpassed the 3,793 level with its rise yesterday and entered the Kumo cloud boundaries and then managed to rise to the upper resistance point of the cloud. This movement can be considered as a remarkable development in terms of market dynamics.
The fact that the funding rate remained stable during the uptrend and spot buying in the Cumulative Volume Delta (CVD) data offered positive support suggests that this move is built on a healthy foundation. Moreover, the Relative Strength Index (RSI) rose as high as 60 after its earlier double bottom pattern and showed no divergence during this move. This positive outlook on the RSI suggests that the uptrend may continue.
Momentum is accompanying this rise, supporting an overall positive technical picture. According to the Ichimoku indicator, ETH’s exit from the Kumo cloud and a buy signal following the Tenkan-Kijun intersection could set the stage for the price to head towards the next target levels of 4,093 and 4,299.
However, in case of a possible pullback, the loss of the 3,893 level may cause the price to fall back to 3,793 levels.
Supports 3,893 – 3,793 – 3,670
Resistances 4,093 – 4,299 – 4,440
XRP/USDT
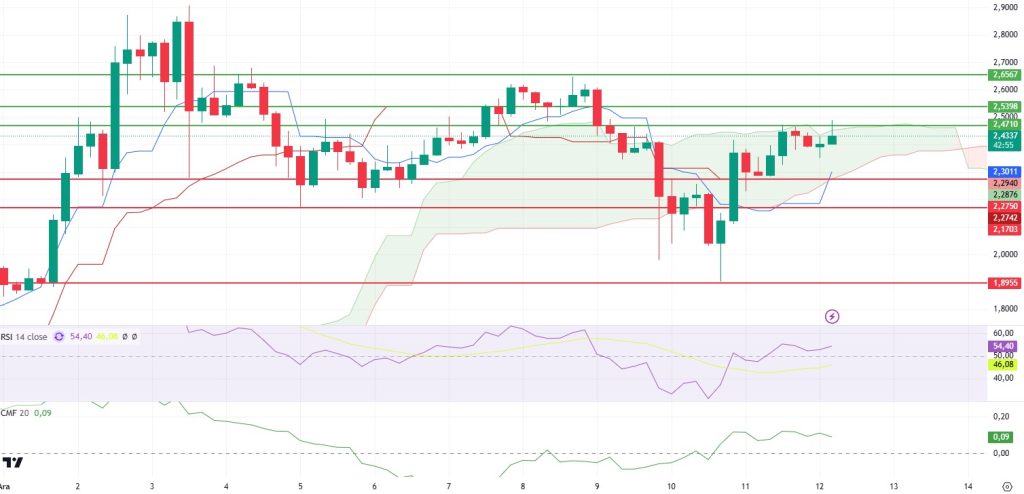
The recent positive developments for XRP allowed the price to reach the 2.47 level again. However, during this rise, a negative divergence was observed on the Relative Strength Index (RSI). Although this divergence seems to have disappeared with yesterday’s price action, it is noteworthy that the market structure is still weak.
Rejected at 2.47, XRP is trending sideways in the positive zone according to Chaikin Money Flow (CMF) data. However, the selling pressure from this level shows that sellers are still effective in the market and the price is trying to stabilize in this region.
In this context, the price is likely to retreat to 2.29 levels in the short term. On the other hand, if the 2.47 level is exceeded, the uptrend can be expected to continue and move towards the 2.53 and 2.65 resistance zones respectively.
Supports 2.2750 – 1.1703- 1.8955
Resistances 2.4710 – 2.5398 – 2.6567
SOL/USDT
After mass liquidations across the market, the bullish sentiment has regained strength. The Solana price could rise rapidly on the back of increased interest in Solana meme coins like WIF and a potential ETF approval. Grayscale’s recent ETF filing with the SEC has boosted investor enthusiasm, in line with growing demand in altcoin markets. In Onchain data, Solana’s Total Value Locked (TVL) rose to $9.338 billion, according to DefiLlama, suggesting that interest and liquidity in the chain appears to be growing. On-chain metrics, trading volumes and growing interest from traders in the altcoin suggest that SOL is poised for near-term upside momentum. Daily trading volume shows that it has reached the highest level since Kasım 2024. Moreover, Coinglass’ SOL Long/Short ratio reached its highest level since early Kasım 2024. Although on the 24-hour timeframe, the long/short ratio stands at 1.0276, this notable increase indicates a strong bullish sentiment among investors.
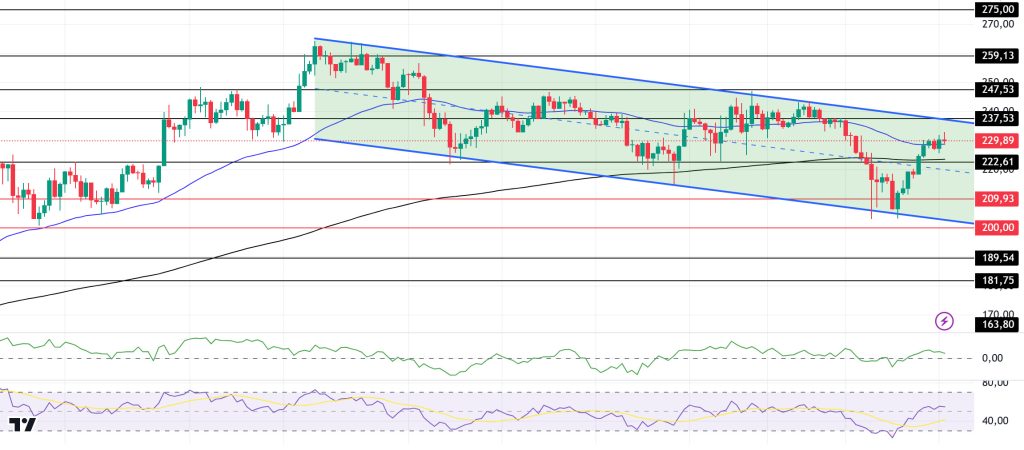
On the 4-hour timeframe, the 50 EMA (Blue Line) is above the 200 EMA (Black Line). Although there is an upward acceleration from the support level, the volume has started to fall again. When we examine the Chaikin Money Flow (CMF)20 indicator, it is seen that there is an increase in money inflows. This can be shown as an upward signal. However, Relative Strength Index (RSI)14 is in the neutral zone. The 237.53 level stands out as a very strong resistance point in the rises driven by both the upcoming macroeconomic data and the news in the Solana ecosystem. If it breaks here, the rise may continue. In case of retracements for the opposite reasons or due to profit sales, support levels 189.54 and 181.75 can be triggered again. If the price hits these support levels, a potential bullish opportunity may arise if momentum increases.
Supports 222.61 – 209.93 – 200.00
Resistances 237.53 – 247.53 – 259.13
DOGE/USDT
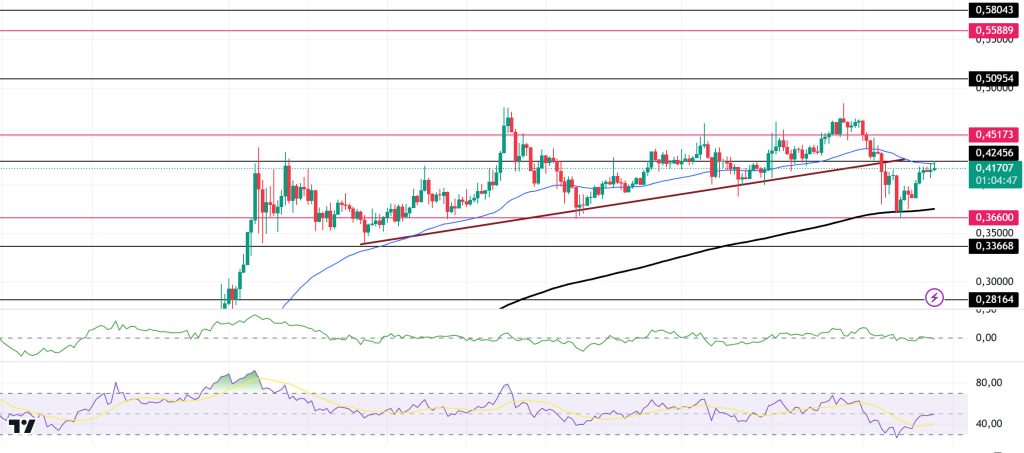
Investors anticipating a Fed rate cut following the latest US CPI data pushed Dogecoin and the rest of the crypto market into an early rally. Bitcoin’s rally is in line with Dogecoin’s upward trajectory towards $1. In the past week, 60,000 new users purchased the wallet DOGE, bringing its total owner addresses to 6.86 million on Aralık 11.
When we look at the chart, the asset, which has been in an uptrend since Kasım 11, has started to move by breaking the trend downwards due to the usual pullback in the market, but the uptrend seems to have started again. Since this movement was strong, it tested the 0.42456 level and saw resistance from both this level and the 50 EMA (Blue Line) and lost some momentum. On the 4-hour timeframe, the 50 EMA (Blue Line) is above the 200 EMA (Black Line). On the other hand, when we look at the RSI 14 indicator, it has accelerated from the overbought zone to the neutral level. However, when we examine the Chaikin Money Flow (CMF)20 indicator, it maintains its neutrality, although there is a little money outflows. The 0.50954 level appears as a very strong resistance level in the rises driven by both the upcoming macroeconomic data and the innovations in the Doge coin. If DOGE maintains its momentum and rises above this level, the rise may continue strongly. In case of possible retracements due to macroeconomic reasons or negativities in the ecosystem, the 0.33668 support level is an important support level. If the price reaches these support levels, a potential bullish opportunity may arise if momentum increases.
Supports 0.36600 – 0.33668 – 0.28164
Resistances 0.42456 – 0.45173 – 0.50954
YASAL BİLDİRİM
Burada yer alan yatırım bilgi, yorum ve tavsiyeleri yatırım danışmanlığı kapsamında değildir. Yatırım danışmanlığı hizmeti, kişilerin risk ve getiri tercihleri dikkate alınarak yetkili kuruluşlar tarafından bireysel olarak verilmektedir. Burada yer alan yorum ve tavsiyeler genel niteliktedir. Bu tavsiyeler mali durumunuz ile risk ve getiri tercihlerinize uygun olmayabilir. Bu nedenle, sadece burada yer alan bilgilere dayanarak yatırım kararı vermeniz beklentileriniz doğrultusunda sonuç vermeyebilir.
