
MARKET SUMMARY
Kripto Varlıklarda Son Durum
| Varlıklar | Son Fiyat | 24 saat Değişim | Hakimiyet | Market Cap. |
|---|---|---|---|---|
| BTC | 99,363.95 | 5.43% | 60.72% | 1,97 T |
| ETH | 2,732.09 | 7.61% | 10.12% | 328,33 B |
| XRP | 2.572 | 9.86% | 4.57% | 148,26 B |
| SOLANA | 206.82 | 5.35% | 3.10% | 100,50 B |
| DOGE | 0.2644 | 6.65% | 1.20% | 39,07 B |
| CARDANO | 0.7520 | 8.86% | 0.82% | 26,45 B |
| TRX | 0.2215 | 0.20% | 0.59% | 19,08 B |
| LINK | 20.03 | 7.75% | 0.40% | 12,83 B |
| AVAX | 26.28 | 5.43% | 0.33% | 10,86 B |
| SHIB | 0.00001548 | 9.81% | 0.28% | 9,16 B |
| DOT | 4.772 | 5.32% | 0.23% | 7,40 B |
*Prepared on 2.4.2025 at 07:00 (UTC)
WHAT’S LEFT BEHIND
Trump Signs Executive Order to Establish Sovereign Wealth Fund within 12 Months
US President Donald Trump has signed an executive order requiring the Departments of Treasury and Commerce to establish a sovereign wealth fund. Treasury Secretary Scott Bessent has shown a cautious interest in cryptocurrencies, while Commerce Secretary nominee Howard Lutnick stands out as an active crypto supporter.
Eric Trump: “It’s Time to Increase ETH Holdings”
Eric Trump, Trump’s second son, posted on social media platform X that now is the best time to increase Ethereum (ETH) holdings.
Utah Takes an Important Step Towards Creating a Bitcoin Reserve
A Utah state legislature committee passed a bill allowing the state to invest in Bitcoin and other cryptocurrencies by an 8-1 vote. If it becomes law, Utah will be the first US state to create a Bitcoin reserve.
OpenAI Launches Deep Research Feature
OpenAI has launched a new “Deep Research” feature for ChatGPT. This feature can generate analyst-level reports in 5 to 30 minutes. The feature is currently active for Pro users.
India to Tax Undeclared Crypto Gains
With new regulations, India will tax undeclared cryptocurrency gains just like money, jewelry and gold bullion. Crypto assets will be defined as “Virtual Digital Assets (VDA)” and reporting institutions will have to provide detailed information on these assets.
HIGHLIGHTS OF THE DAY
Önemli Ekonomik Takvim Verileri
| Zaman | Haberler | Beklenti | Önceki |
|---|---|---|---|
| - | Stellar (XLM) Q4 2024 Quarterly Review | - | - |
| - | Seedify.fund (SFUND) Lucia AI Agent IDO Event | - | - |
| - | Basic Attention Token (BAT) Community Discussion Event | - | - |
| 15:00 | US JOLTS Job Openings (Dec) | 8.01M | 8.10M |
| 16:00 | FOMC Üyesi Bostic Konuştu | - | - |
| 19:00 | FOMC Member Daly Speaks | - | - |
BİLGİ
*Takvim UTC (Koordineli Evrensel Zaman) zaman dilimini temel alır.
İlgili sayfada yer alan ekonomik takvim içeriği güvenilir haber ve veri sağlayıcılardan elde edilmektedir. Ekonomik takvim içeriğinde yer alan haberler, haberlerin açıklanma tarihi ve saati, önceki, beklenti ve açıklanan rakamlardaki olası değişiklikler veri sağlayıcı kurumlar tarafından yapılmaktadır. Benzer durumlardan kaynaklanabilecek olası değişikliklerden Darkex sorumlu tutulamaz.
PAZAR PUSULASI
Global markets continue to follow the turbulent course of President Trump and his decisions on tariffs. The markets started the week with tariffs on Canada, Mexico and China, and finally, after the meetings of the state leaders, it was announced that the decision to postpone the 25% tariff on Mexico and Canada for 30 days.
This morning, Asia-Pacific indices, excluding the Chinese stock market, which is closed due to the holiday, are up. However, we see that the rises seen in European and US futures contracts could not be stable. Digital assets also retreated a bit after recovering most of their recent losses with the support of the perception created by the postponement of tariffs.
We can say that the potential statements of the US President will be important again today. On tariffs, China and Europe remain in the gray zone. Although there is some relief in the markets with the postponed Canadian and Mexican tariffs, Trump’s potential surprise announcements may pave the way for continued high volatility. On the other hand, JOLTS data from the US will be under close scrutiny ahead of the critical labor market data to be released later in the week. On the corporate front, Google’s parent company Alphabet’s fourth quarter results will be monitored after the Wall Street close.
From the short term to the big picture.
Trump’s victory on Kasım 5, one of the main pillars of our bullish expectation for the long-term outlook in digital assets, produced a result in line with our predictions. In the process that followed, the appointments made by the president-elect and the increasing regulatory expectations for the crypto ecosystem in the US and the emergence of BTC as a reserve continued to take place in our equation as positive variables. Then, 4 days after the new President took over the White House, he signed the “Cryptocurrency Working Unit” decree, which was among his election promises, and we think that the outputs it will produce in the coming days will continue to reflect positively on digital assets.
On the other hand, the expectations that the FED will continue its interest rate cut cycle, albeit on hiatus for now, and the fact that the volume in crypto-asset ETFs indicates an increase in institutional investor interest, support our upside forecast for the big picture. In the short term, given the nature of the market and pricing behavior, we think it would not be surprising to see occasional pause or pullbacks in digital assets. However, at this point, it is worth emphasizing again that we think that the fundamental dynamics continue to be bullish.
TECHNICAL ANALYSIS
BTC/USD
According to a CoinShares report, there has been a sharp decline in inflows into crypto assets traded in the market. Only $527 million in inflows were recorded last week, down 72% from $1.9 billion in the previous week. This weakening in investor sentiment has been attributed to concerns over China’s artificial intelligence platform DeepSeek and growing global trade war concerns amid pressure from US President Donald Trump to impose tighter import tariffs.
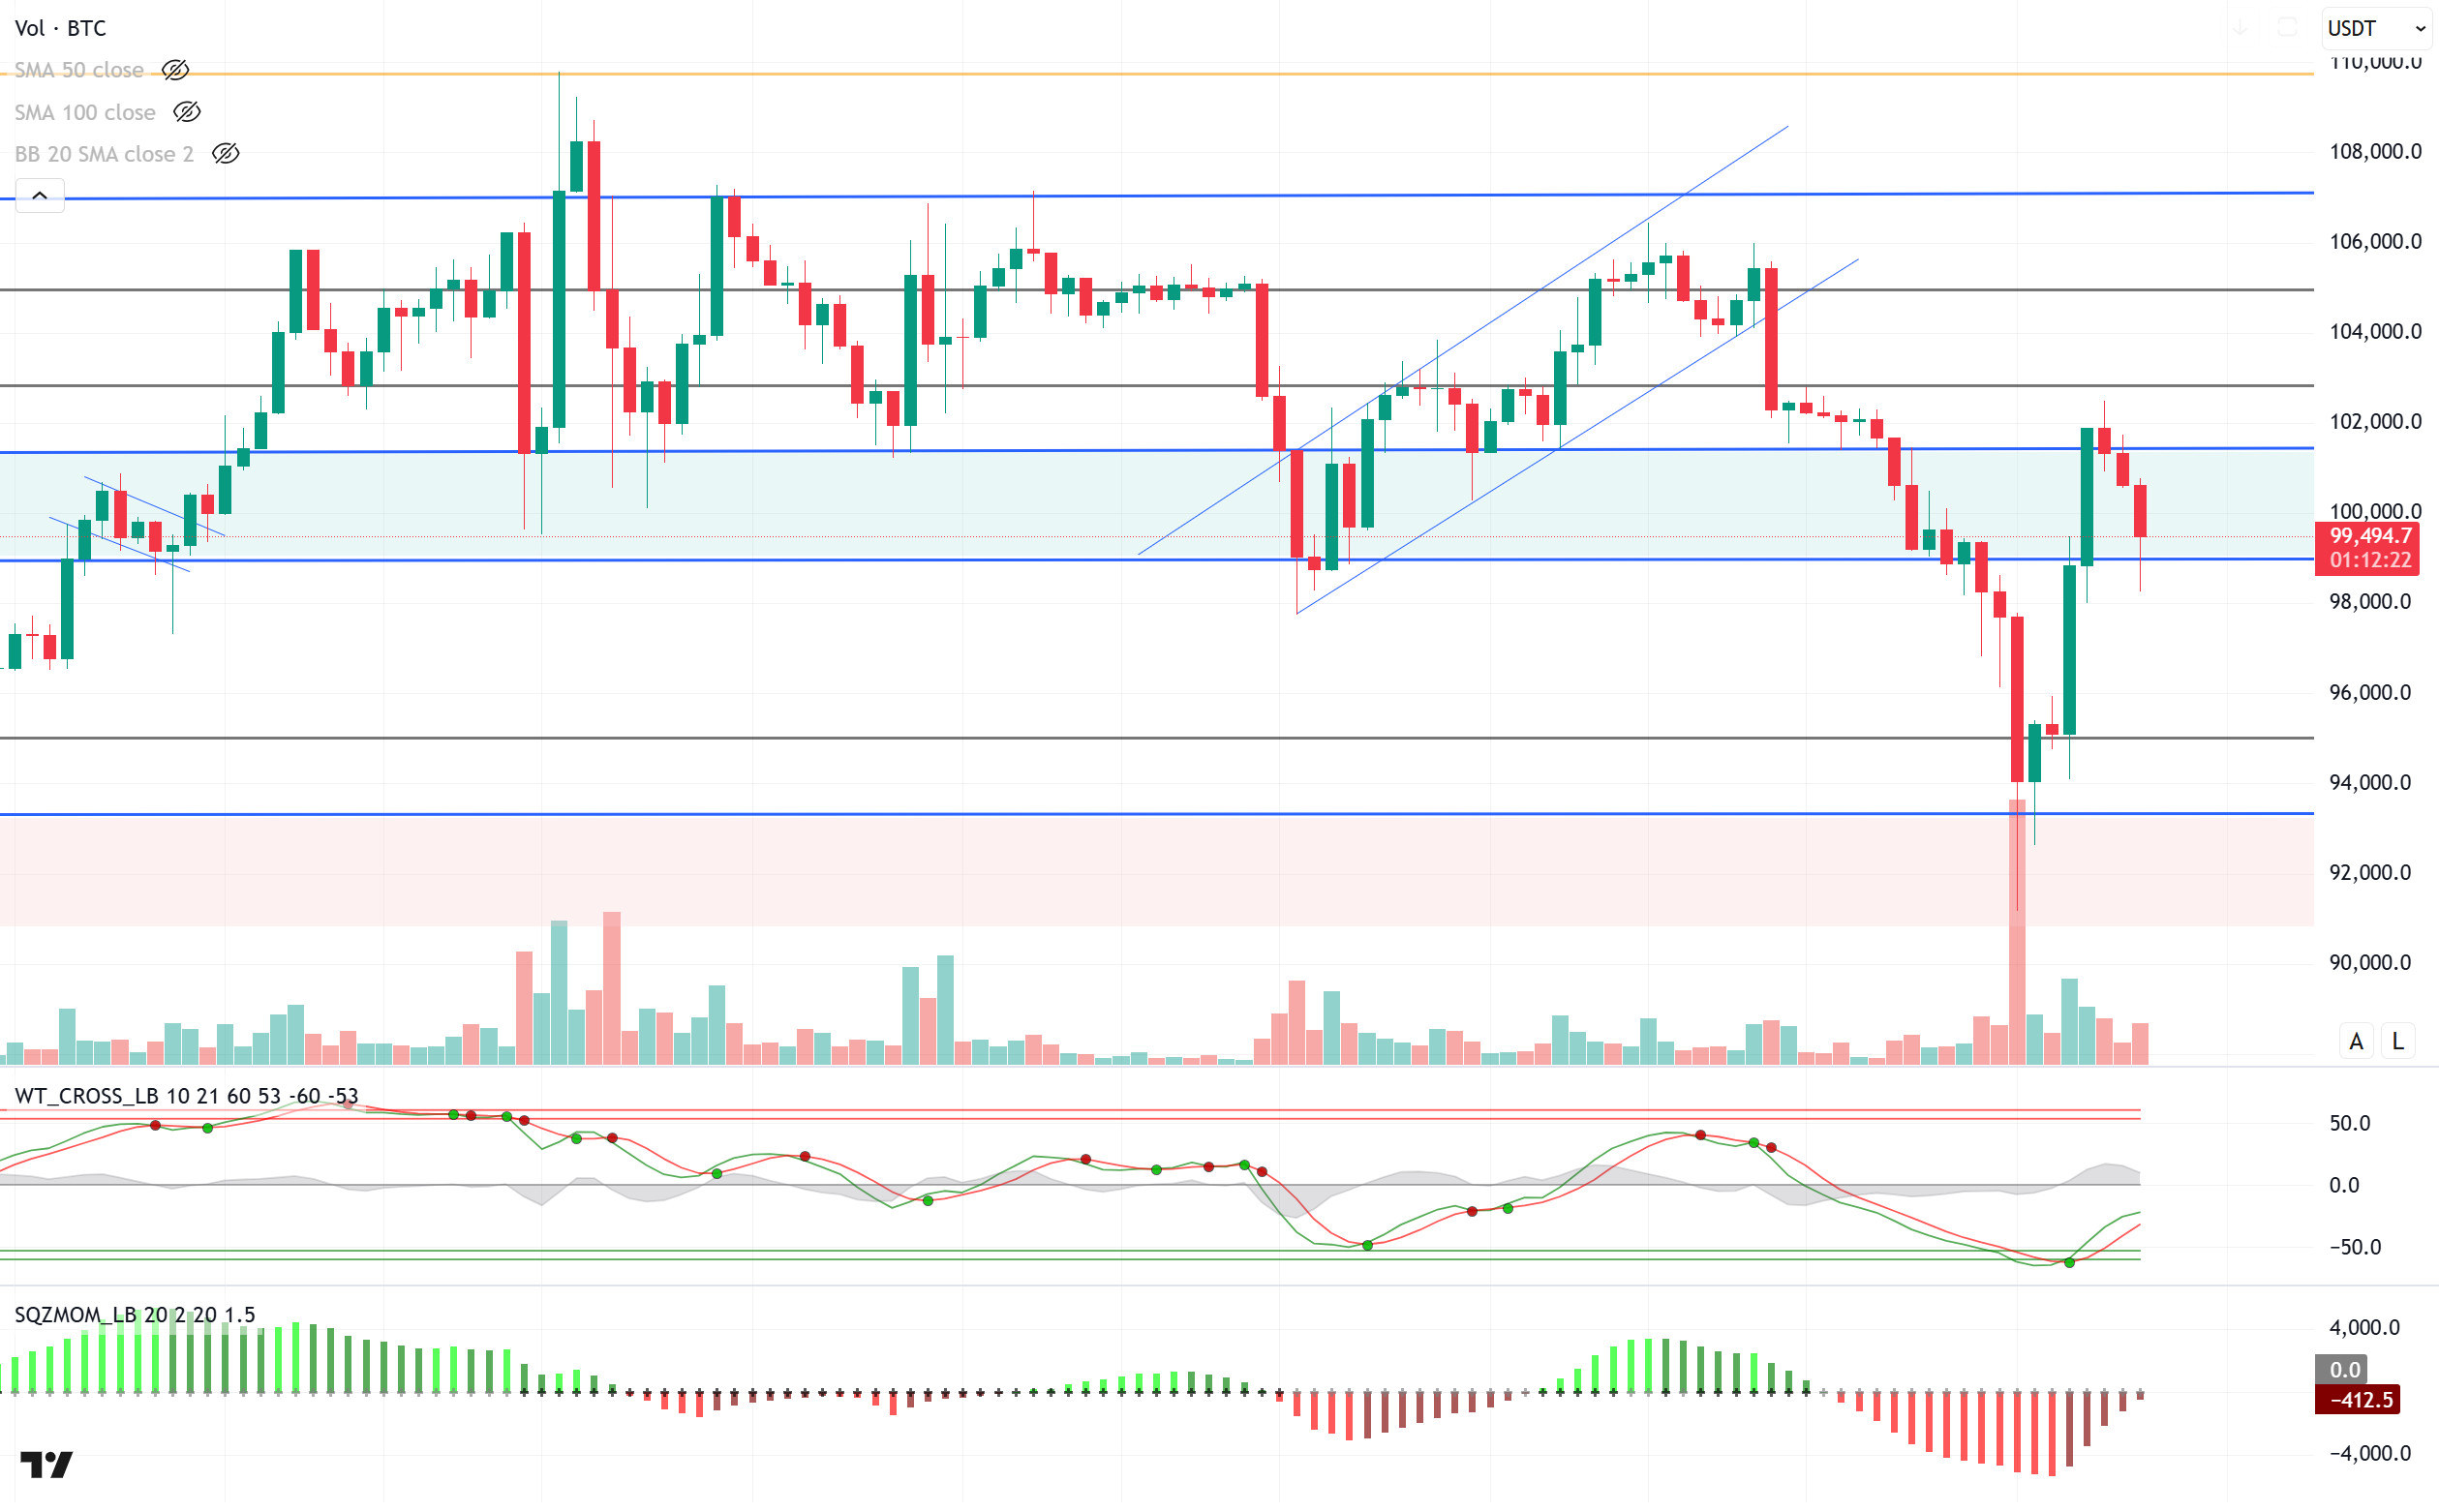
When we look at the technical outlook, BTC, which retreated sharply to 91,150 with sales pressure and negative news flow, recovered the losses and rose again to 102,800. Currently trading at the 99,100-support level, BTC seems to be selling again. Despite the sales signal given by technical oscillators on hourly charts, it continues to maintain its buying signal on the 4-hour chart. It is seen that the momentum indicator is trying to transition back to the positive zone. In the continuation of the decline, long transactions in the range of 96,000 and 97,000 attract attention, while the price may be likely to test these levels during the day. In the continuation of the rise, closures above the 99,100 support level are the region we will monitor for the continuation of upward movements.
Supports 99,100 – 98,000 – 97,200
Resistances 101,400 – 102,800 – 105,000
ETH/USDT
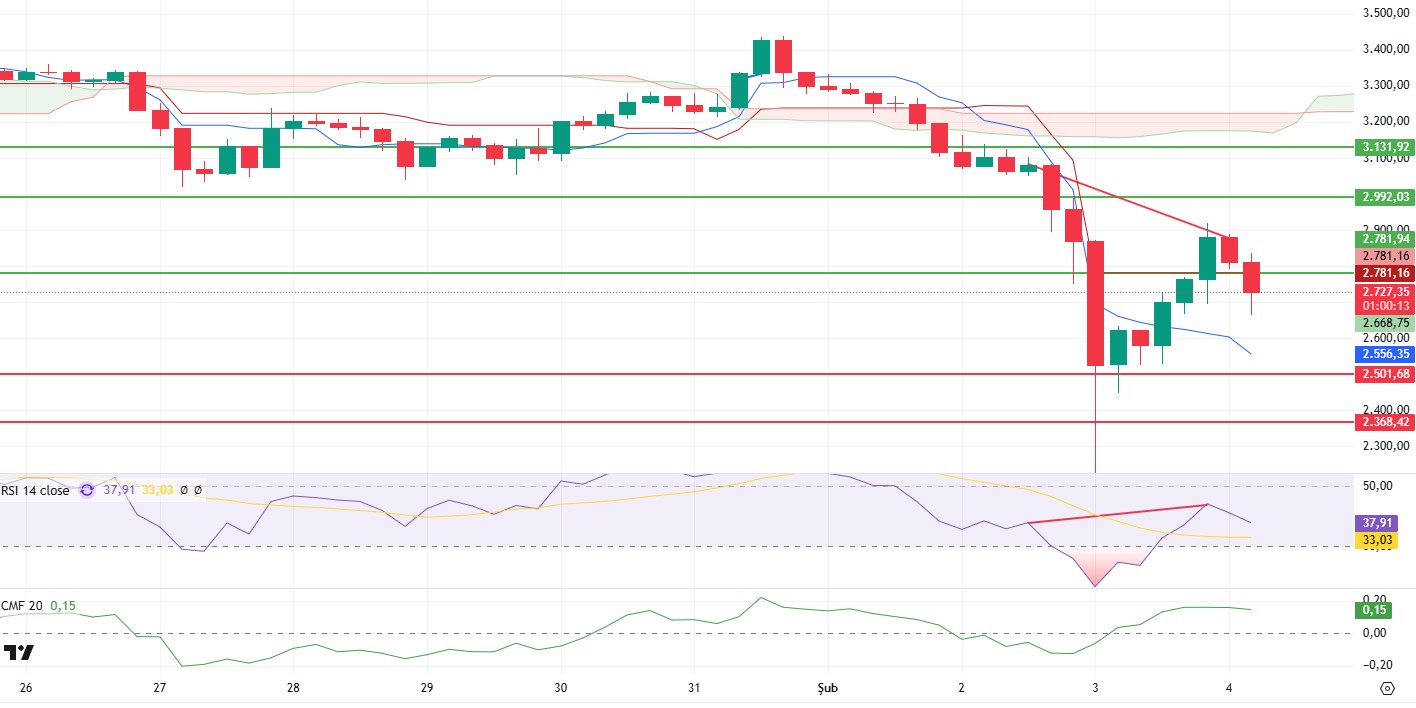
The market, which recovered slightly after the decline on Pazar, started with a decline again today. Donald Trump’s son Eric Trump said, “I think it’s a great time to add ETH. You can thank me later.” ETH, which managed to rise above 2,900 by experiencing a rapid recovery yesterday on his note, retreated back to the 2,700 level in the morning hours on the news that “China will impose a 10-15% tariff on oil, agricultural equipment, coal and LNG from the US.”
This price action also led to some changes in indicators. First of all, Relative Strength Index (RSI) gained a strong momentum, breaking out of the oversold zone and rising as high as 44. However, the presence of hidden negative divergence at this level may have caused a small correction in the price. Although it is slightly downward sloping at the moment, the fact that it is exiting the oversold zone with such a large momentum can be considered as a positive indicator for the market. Similarly, Chaikin Money Flow (CMF) quickly moved into positive territory, but experienced a slight pullback. Looking at the Ichimoku indicator, the price gaining the tenkan level is seen as a positive situation for short-term risks. The fact that the Kijun level is at 2,781, the most important resistance level, has caused this region to have a more critical importance.
In summary, although there are improvements in the indicators, the weakening in momentum and CMF and the closes below 2,781 indicate that a full bullish potential has not yet begun and slight pullbacks seem possible for a short time. Exceeding the 2,781 level may put the price back into an uptrend.
Supports 2,501 – 2,368 – 2,114
Resistances 2,781 – 2,992 – 3,131
XRP/USDT
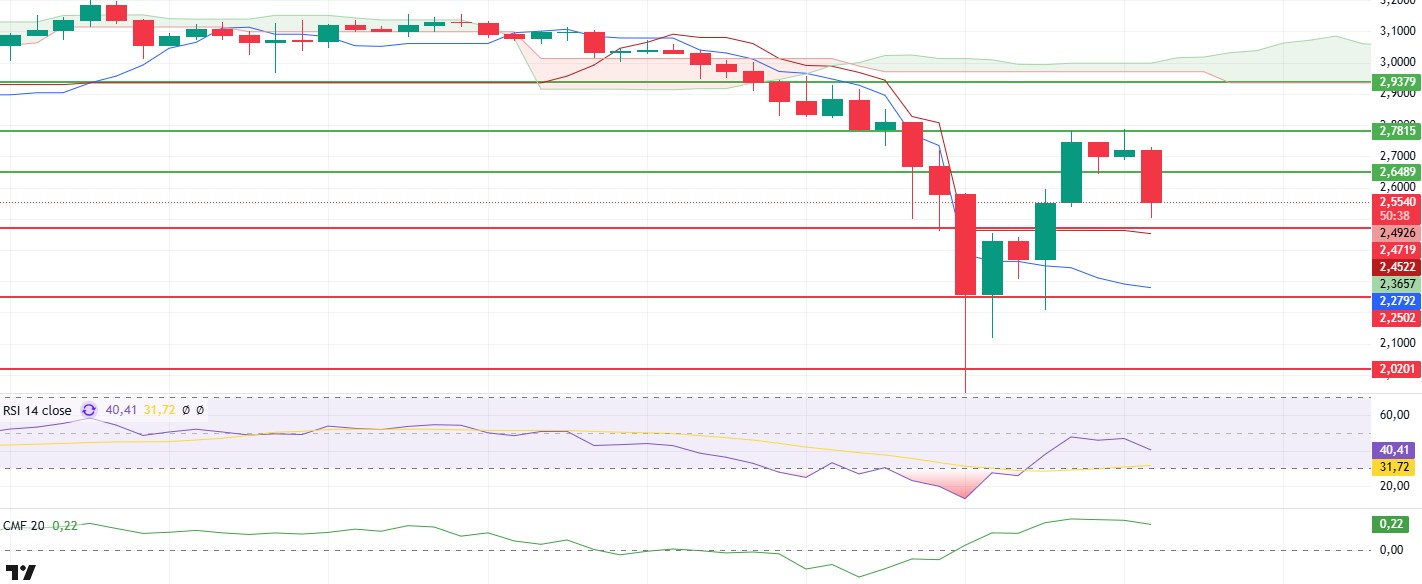
XRP also experienced a rapid recovery after the markets relaxed for a while and managed to rise up to 2.78 resistance. However, it fell again in the night hours and fell to 2.56 levels.
When we look at the Relative Strength Index (RSI) indicator, although it came up to 48 levels by experiencing a momentum rise from the oversold zone, it retreated with the decline and continues its downward movement. Chaikin Money Flow (CMF) also moved to the positive area with the rise, indicating an increase in liquidity, but momentarily weakened. On the Ichimoku indicator, it seems positive that the price is again above the kijun and tenkan level.
In the light of this data, although slight retracements continue for a while during the day, it can be expected to realize the upward movement again with support from the 2.47 level. Loss of the 2.47 level may bring deeper declines
Supports 2.4719 – 2.2502 – 2.0201
Resistances 2.6489 – 2.7815 – 2.9379
SOL/USDT
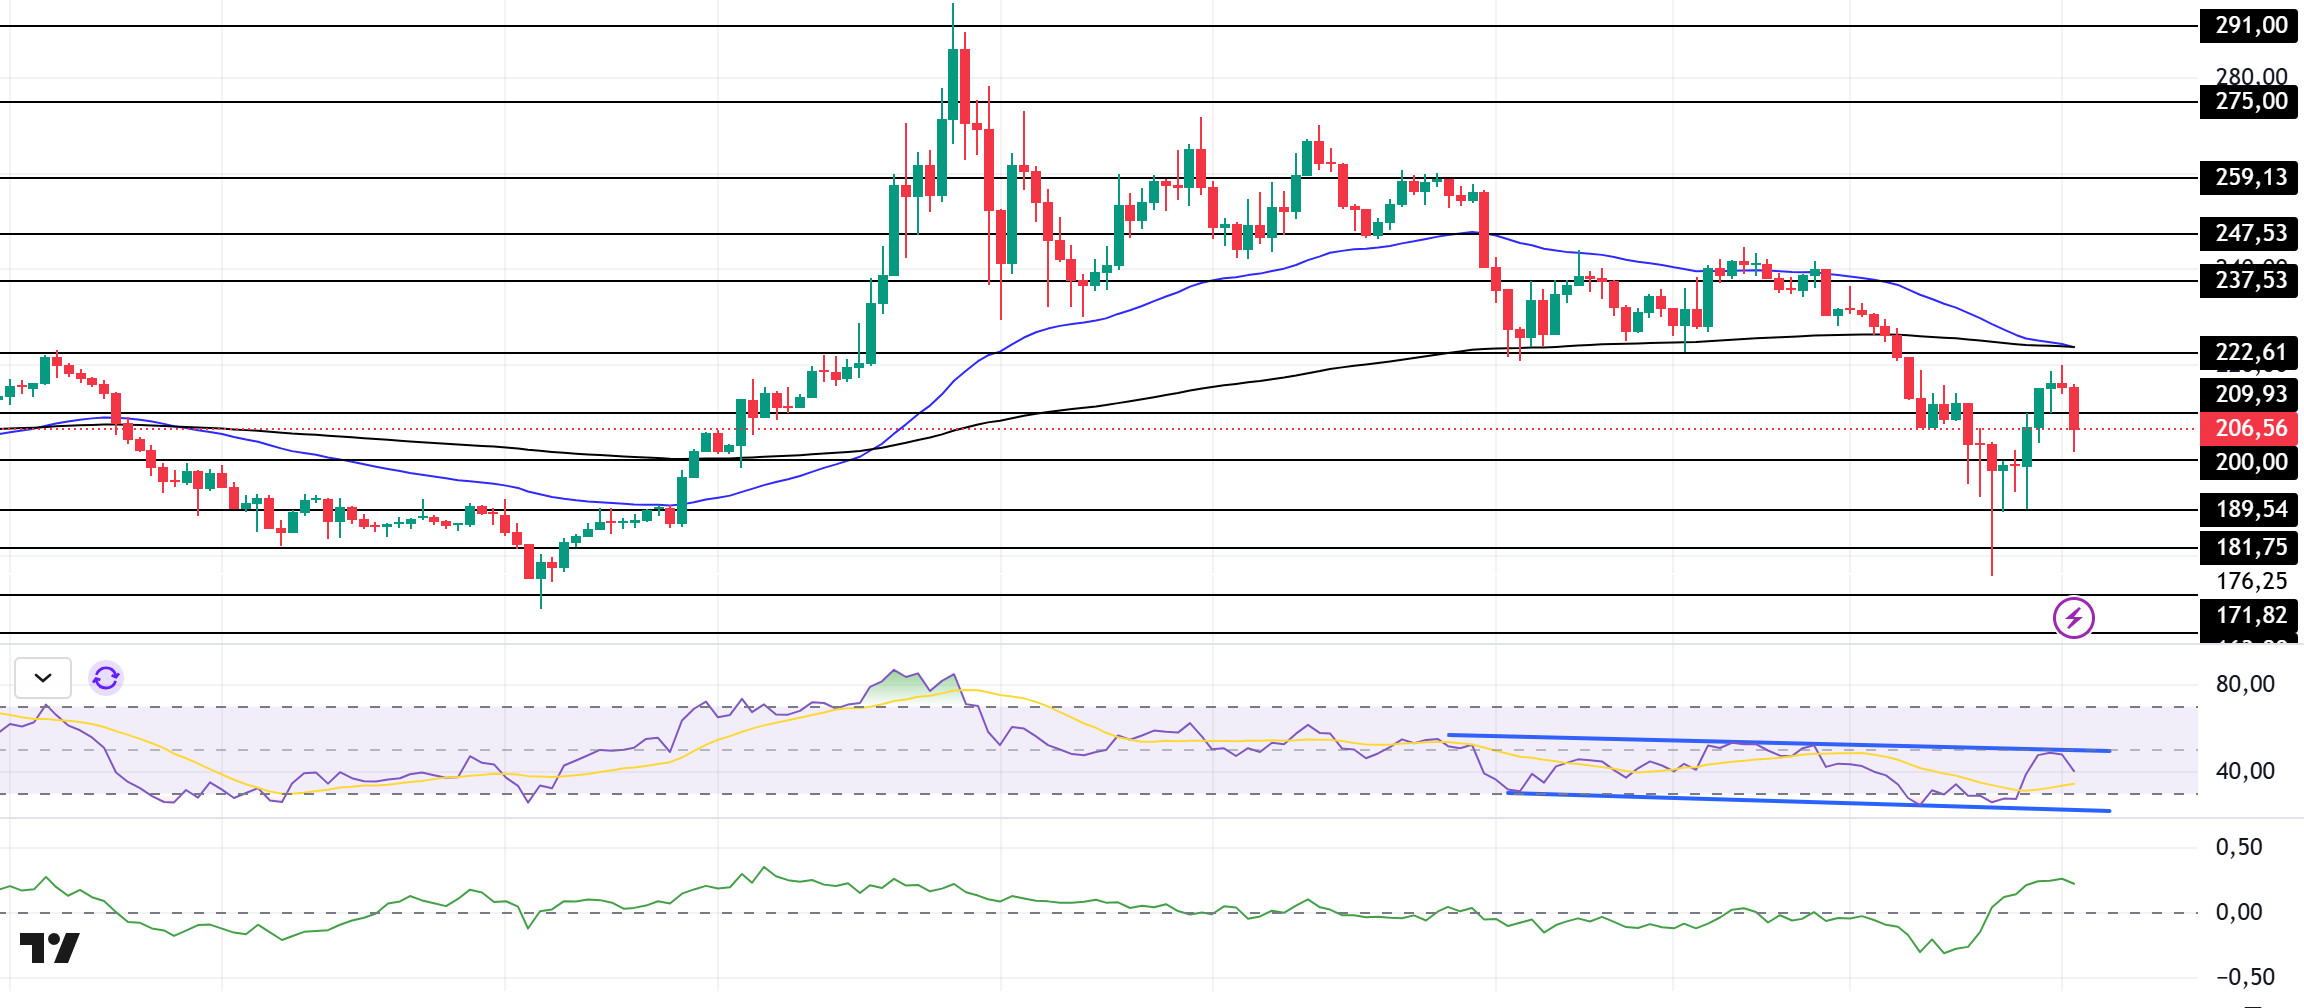
SOL has fluctuated in a narrow range since our analysis yesterday. On the 4-hour timeframe, the 50 EMA (Blue Line) has touched the 200 EMA (Black Line). This shows us that the price is looking for direction. At the same time, the asset continues to be priced below the 50 EMA and 200 EMA. When we examine the Chaikin Money Flow (CMF)20 indicator, it is in positive territory, but at the same time, money inflows have started to decrease. However, the Relative Strength Index (RSI)14 indicator is at the mid-level of the negative zone and the price tested the ceiling level of the downtrend that started on Ocak 19 on the RSI and started to decline from there. The 237.53 level stands out as a very strong resistance point in the rises driven by both the upcoming macroeconomic data and the news in the Solana ecosystem. If it breaks here, the rise may continue. In case of retracements for the opposite reasons or due to profit sales, the 209.93 support level can be triggered. If the price comes to these support levels, a potential bullish opportunity may arise if momentum increases.
Supports 200.00 – 189.54 – 181.75
Resistances 209.93 – 222.61 – 237.53
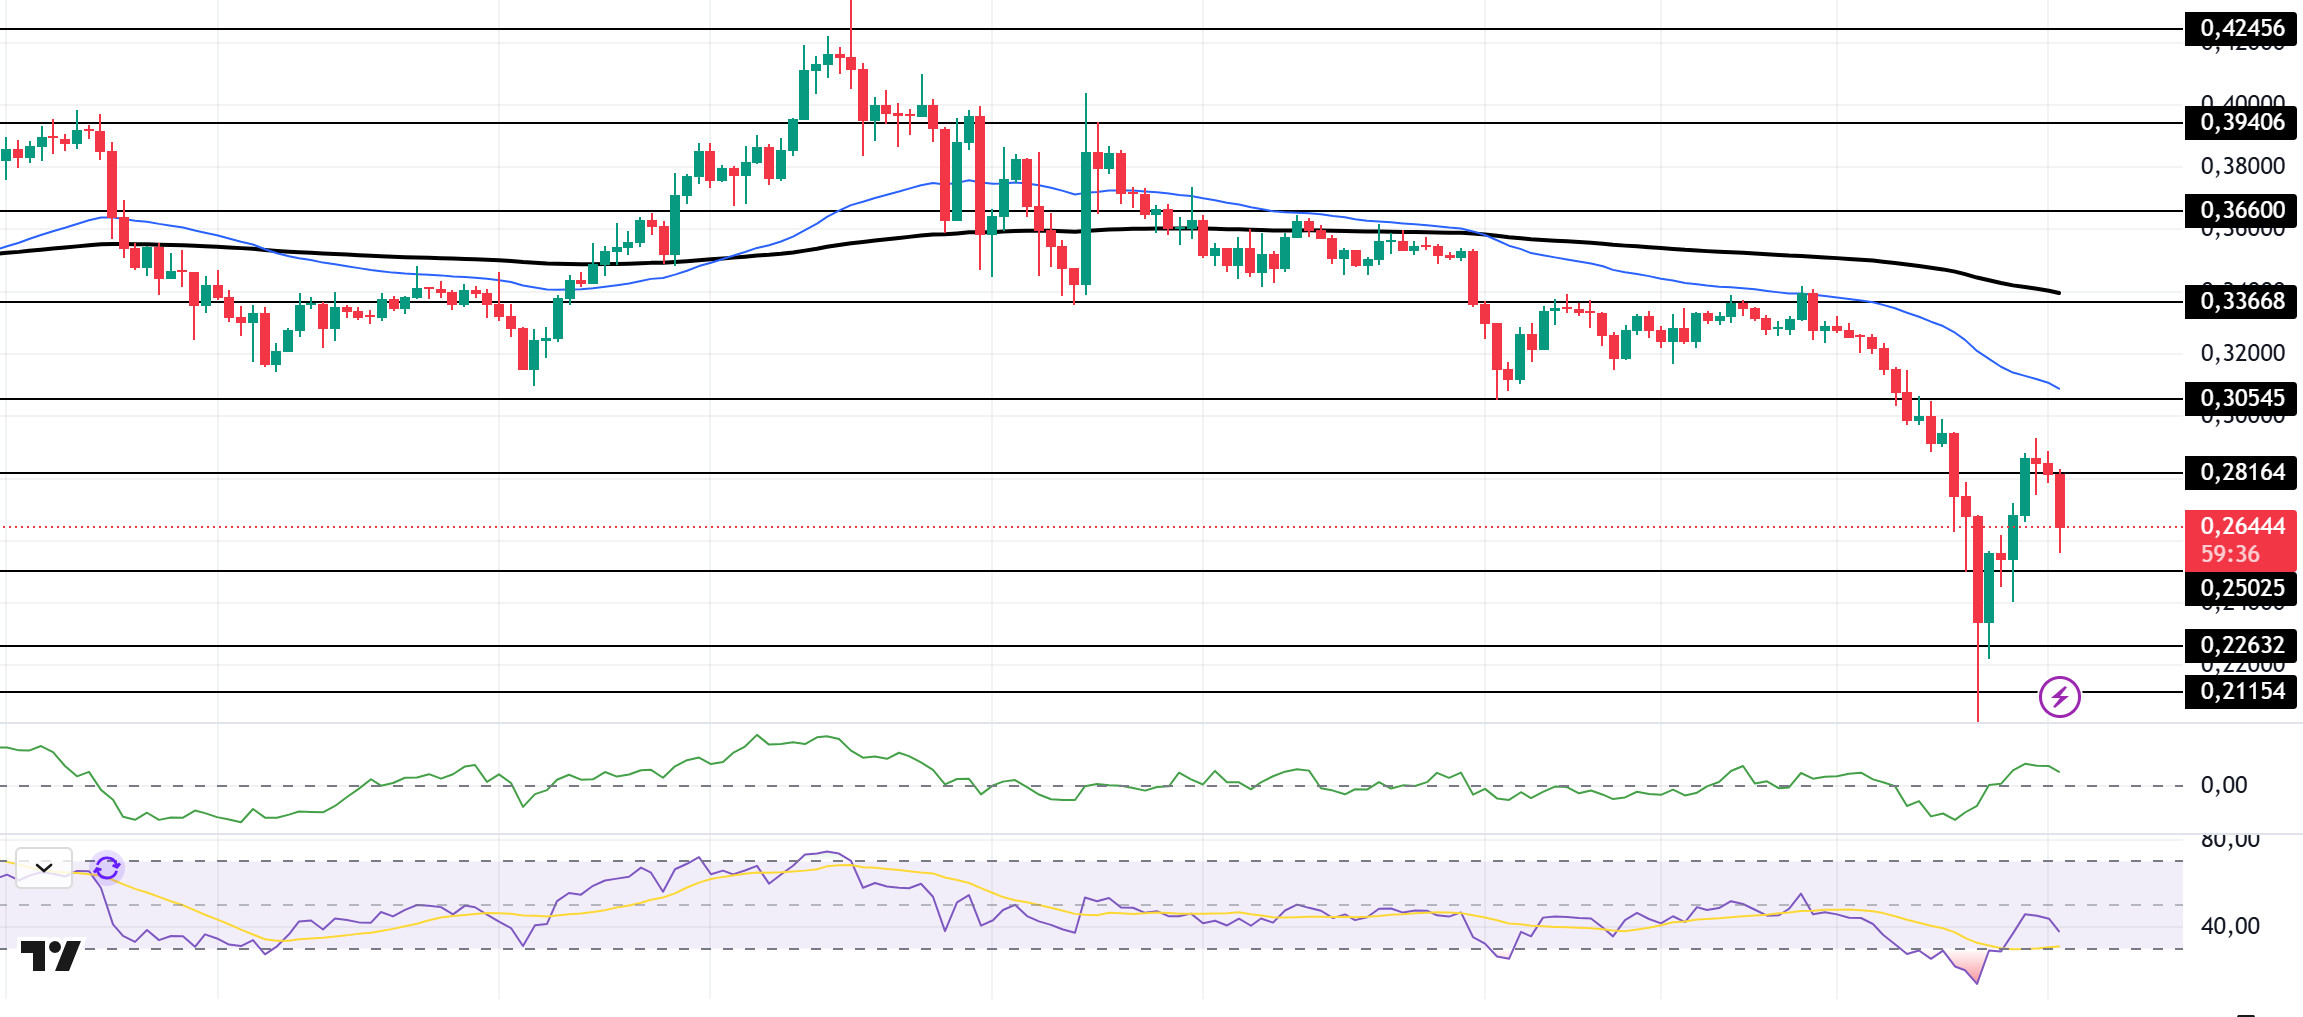
DOGE/USDT
After yesterday’s deep drop, the price rebounded and rose by about 30% from the low. On the 4-hour timeframe, the 50 EMA (Blue Line) continues to be below the 200 EMA (Black Line). This could mean that the decline could deepen further in the medium term. At the same time, the price is below the 50 EMA (Blue Line) and the 200 EMA (Black Line). However, the large gap between the moving averages and the asset may increase the probability of DOGE rising. When we examine the Chaikin Money Flow (CMF)20 indicator, although it is in positive territory, money inflows have started to decrease. At the same time, Relative Strength Index (RSI)14 is moving from the middle of the negative zone to the oversold zone. This shows us that the strength of the price is decreasing here. The 0.33668 level appears to be a very strong resistance point in the rises due to political reasons, macroeconomic data and innovations in the DOGE coin. In case of possible pullbacks due to political, macroeconomic reasons or negativities in the ecosystem, the 0.18954 level, which is the base level of the trend, is an important support. If the price reaches these support levels, a potential bullish opportunity may arise if momentum increases.
Supports 0.25025 – 0.22632 – 0.21154
Resistances 0.28164 – 0.30545 – 0.33668
YASAL BİLDİRİM
Burada yer alan yatırım bilgi, yorum ve tavsiyeleri yatırım danışmanlığı kapsamında değildir. Yatırım danışmanlığı hizmeti, kişilerin risk ve getiri tercihleri dikkate alınarak yetkili kuruluşlar tarafından bireysel olarak verilmektedir. Burada yer alan yorum ve tavsiyeler genel niteliktedir. Bu tavsiyeler mali durumunuz ile risk ve getiri tercihlerinize uygun olmayabilir. Bu nedenle, sadece burada yer alan bilgilere dayanarak yatırım kararı vermeniz beklentileriniz doğrultusunda sonuç vermeyebilir.
