MARKET SUMMARY
Kripto Varlıklarda Son Durum
| Varlıklar | Son Fiyat | 24 saat Değişim | Hakimiyet | Market Cap. |
|---|---|---|---|---|
| BTC | 69,230.00 | -4.02% | 58.90% | 1.37 T |
| ETH | 2,502.00 | -4.96% | 12.96% | 301.13 B |
| SOLANA | 165.75 | -4.38% | 3.35% | 77.87 B |
| XRP | 0.5133 | -0.71% | 1.26% | 29.19 B |
| DOGE | 0.1557 | -9.10% | 0.98% | 22.81 B |
| TRX | 0.1678 | -0.97% | 0.62% | 14.51 B |
| CARDANO | 0.3405 | -3.95% | 0.51% | 11.92 B |
| AVAX | 24.56 | -4.74% | 0.43% | 9.99 B |
| SHIB | 0.00001732 | -6.18% | 0.45% | 10.22 B |
| LINK | 11.33 | -6.55% | 0.31% | 7.10 B |
| DOT | 3.910 | -5.55% | 0.25% | 5.91 B |
*Prepared on 11.1.2024 at 06:00 (UTC)
WHAT’S LEFT BEHIND
MT. Gox Resumes Payments?
Mt. Gox exchange, which caused significant price drops in the cryptocurrency world with the payments it started in Temmuz. Gox exchange sent a total of 500 BTC to two unknown addresses overnight. The purpose of this first transfer made by the exchange after about 1 month is not yet known.
Donald Trump Celebrates Bitcoin’s 16th Anniversary
US Presidential candidate Donald Trump celebrated the 16th anniversary of Bitcoin and sent a message to cryptocurrency supporters. He criticized his opponent Kamala Harris’ anti-cryptocurrency stance and reiterated that he would support US-based Bitcoin production. This statement has the potential to change US cryptocurrency policies.
Tether Publishes Third Quarter Financial Report
Tether announced its financial performance for the third quarter of 2024, posting a Group net profit of $2.5 billion and a cumulative nine-month profit of $7.7 billion.
Immutable (IMX) Faces SEC Threat
Immutable (IMX) announced that it received a Wells notice from the US Securities and Exchange Commission (SEC) for IMX sales, which is called a pre-suit warning. With this latest development, IMX price fell sharply. IMX, which lost more than 5% in minutes after the selling pressure, fell by 10% today
HIGHLIGHTS OF THE DAY
Önemli Ekonomik Takvim Verileri
| Zaman | Haberler | Beklenti | Önceki |
|---|---|---|---|
| Important Economic Calendar Data | |||
| Immutable (IMX) – 32.47MM Token Unlock | |||
| Sui (SUI) – 64.204MM Token Unlock | |||
| Delysium (AGI) – 34.38MM Token Unlock | |||
| dYdX (Native) – 8.34MM Token Unlock | |||
| ZetaChain (ZETA) – 53.89MM Token Unlock | |||
| 12:30 | US Average Hourly Earnings (MoM) (Oct) | 0.3% | 0.4% |
| 12:30 | US Nonfarm Payrolls (Oct) | 106K | 254K |
| 12:30 | US Unemployment Rate (Oct) | 4.1% | 4.1% |
| 14:00 | US ISM Manufacturing PMI (Oct) | 47.6 | 47.2 |
INFORMATION
*The calendar is based on UTC (Coordinated Universal Time) time zone.
İlgili sayfada yer alan ekonomik takvim içeriği güvenilir haber ve veri sağlayıcılardan elde edilmektedir. Ekonomik takvim içeriğinde yer alan haberler, haberlerin açıklanma tarihi ve saati, önceki, beklenti ve açıklanan rakamlardaki olası değişiklikler veri sağlayıcı kurumlar tarafından yapılmaktadır. Benzer durumlardan kaynaklanabilecek olası değişikliklerden Darkex sorumlu tutulamaz.
PAZAR PUSULASI
Following the disappointing balance sheets of Microsoft and Meta, there was a retreat in the US, especially led by technology companies. The impact of this was also seen in Asian stock markets this morning, while China diverged positively with the PMI data that exceeded the forecasts. Digital assets declined yesterday due to the deterioration in risk perception indicated by US indices and profit realization. Today, eyes will be on the critical US employment data.
Recently, there has been a rally in crypto assets, driven by the demand for ETFs and Trump’s lead in the presidential election. Yesterday, in the Darkex Evening Analysis, we stated that short-term traders’ positions in unrealized profits are a downside risk to the recent rally and increase vulnerability. While the Short Term Output Profit Ratio (SOPR) has been stuck around 1.04 before, it fell back to 1 with BTC sales starting around this level.
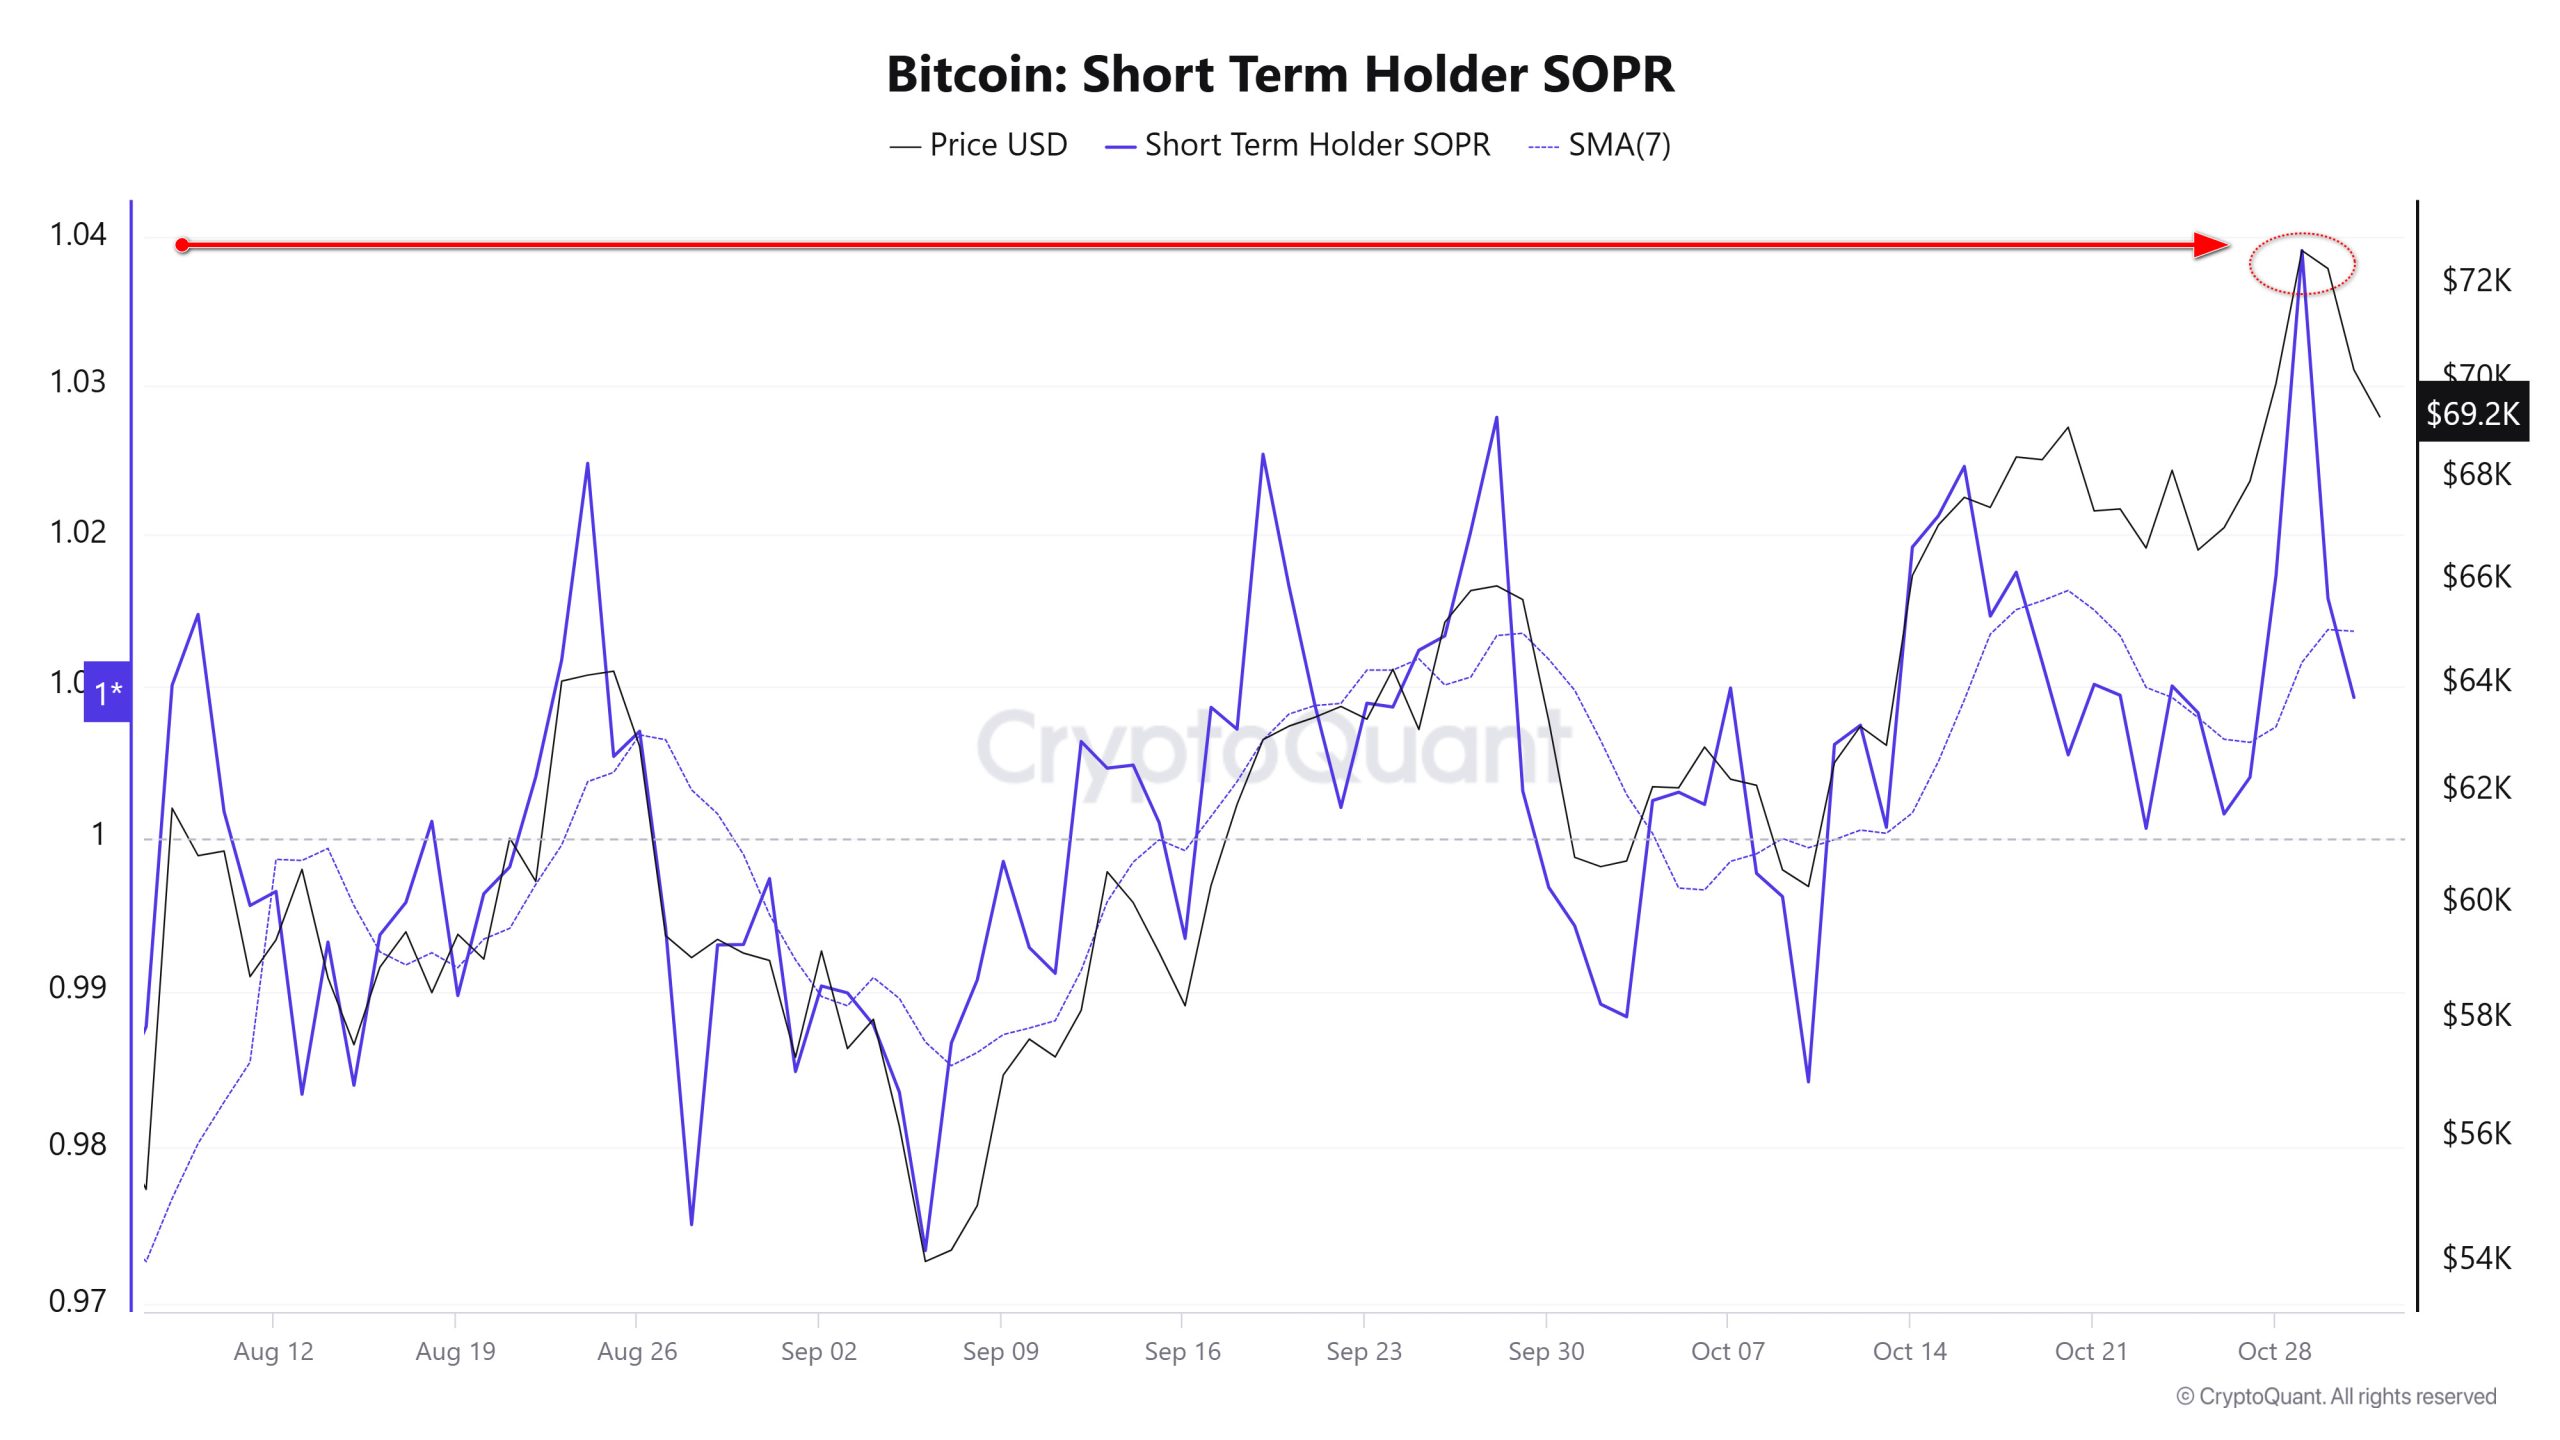 Source: CryptoQuant
According to Polymarket data, Trump’s chances against Harris dropped from around 67% to 61%, while the former president’s election fundraising target with the WLFI token was reduced by almost 90%, indicating that Trump’s funding target with this token sale will be much less than expected. We believe that these dynamics do not explain the recent decline, and we attribute it to the fact that investors’ perception has become more fragile in the face of important upcoming developments and it has become more attractive to take money off the table. Ahead of next week’s busy agenda, the markets will focus on the US employment data today and try to get information on the interest rate path of the country’s central bank. Please click here to review our report on this subject.
You can also review the Kasım Strategy Report prepared by Darkex Research Department by clicking here.
The big picture from the short term
The recent surge in interest in ETFs, companies such as Microsoft and MicroStrategy setting aside funds to accumulate Bitcoin, and crypto-friendly Trump leading the presidential election race are all developments that point to a wider acceptance of blockchain and digital assets by traditional markets. Given these dynamics, we maintain our expectation that the direction for major cryptocurrencies is positive in the long term. On the other hand, we have stated our expectation that we may see intermediate corrections or respite periods after the rally in our previous analyzes and we think that the recent decline is consistent with this. We expect the pullback to continue for a while with a calmer tone and intermediate-short-term rallies.
TECHNICAL ANALYSIS
BTC/USDT
The expected correction in Bitcoin ahead of the US elections was exacerbated by rising geopolitical tensions in the Middle East. Iran’s preparations for a retaliatory attack on Israel in the coming days and the activity on MT Gox created selling pressure on Bitcoin. Bitcoin, which also showed sharp fluctuations in the first days of Ekim, then started an upward trend. While entering Kasım with a similar outlook, Non-Farm Payrolls and Unemployment data, which are important macroeconomic data of the US on the first day of the month, will be in the focus of the markets.
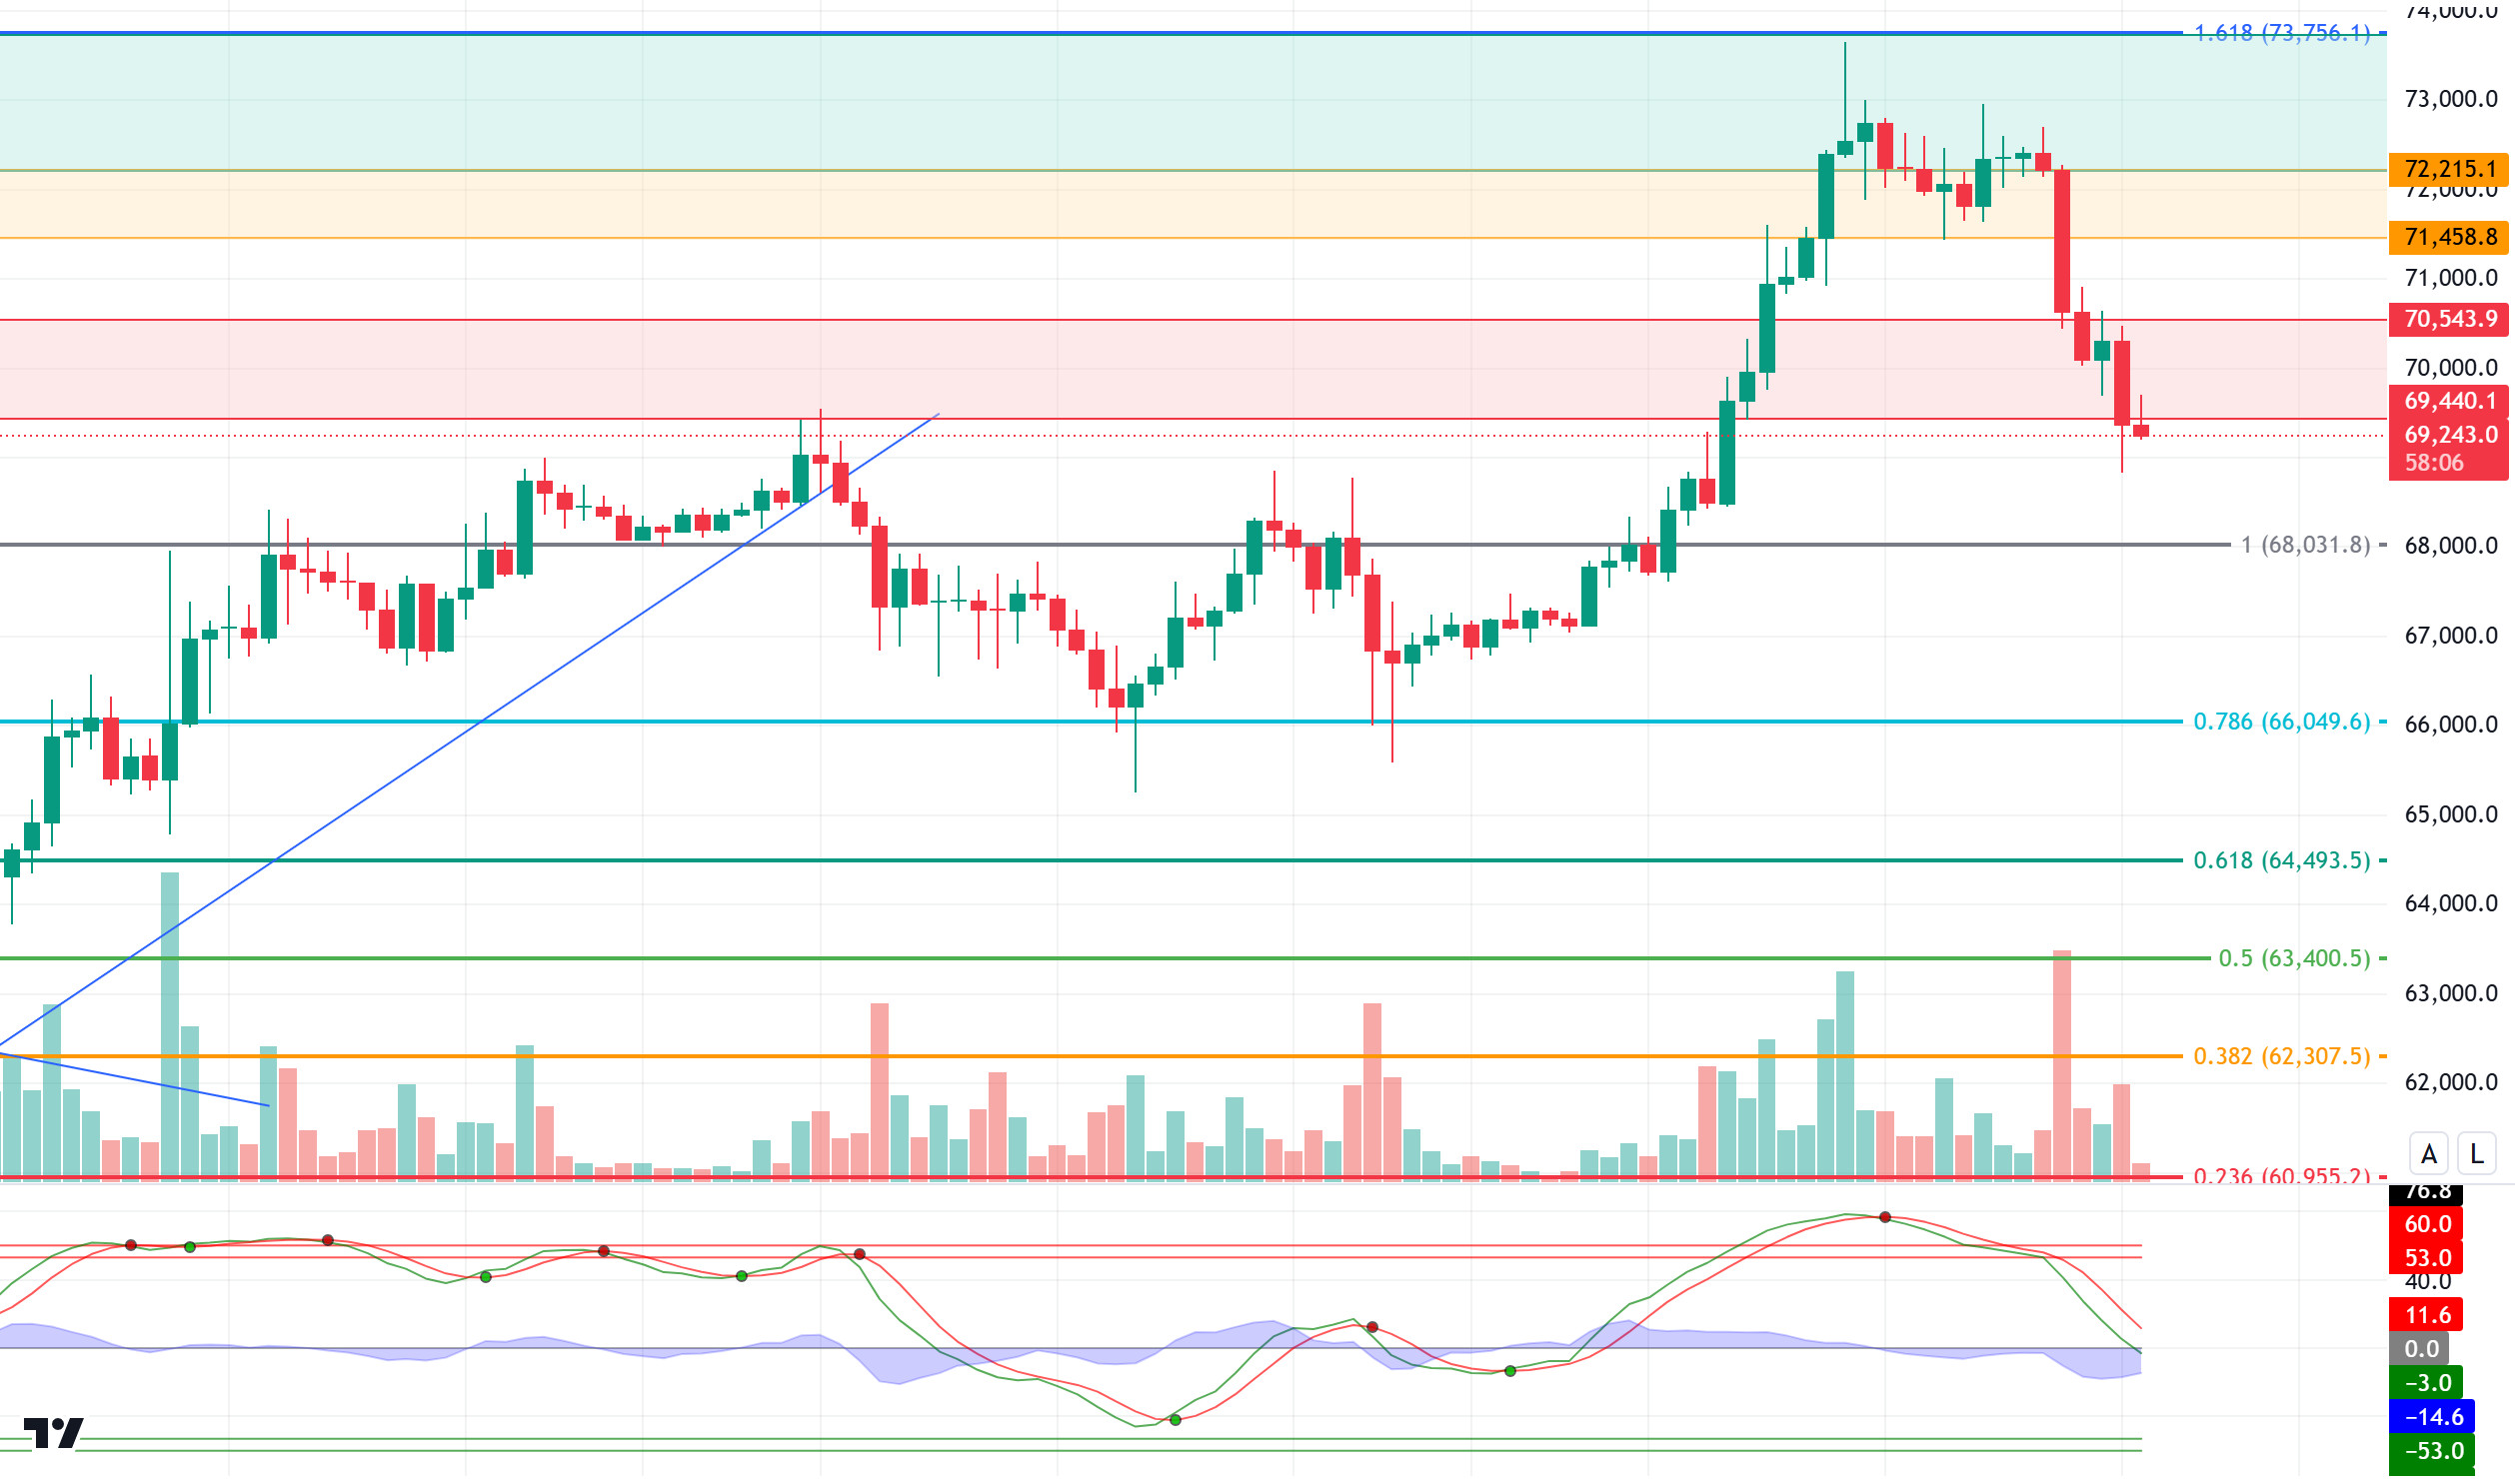
When we look at the technical outlook in line with all these developments, we see that with BTC losing the 71,458 support level, the price first experienced a short-term pause at the minor support level of 70,543, but with the break of this level, the decline deepened further. Currently pricing just below the 69,440 support level, BTC has reached the oversold zone on the hourly chart. This could signal that the 70,543 level could be retested with an upward reaction during the day. If the retaliation preparations in the Middle East reach a concrete dimension, the selling pressure may increase and the price may decline towards the Fibonacci 1 (68,031) point. With the US elections just days away, we can expect the volatility on the market to continue to increase.
Supports 69,440 – 68,031 -66,049
Resistances 70,543 – 71,458 – 72,215
ETH/USDT
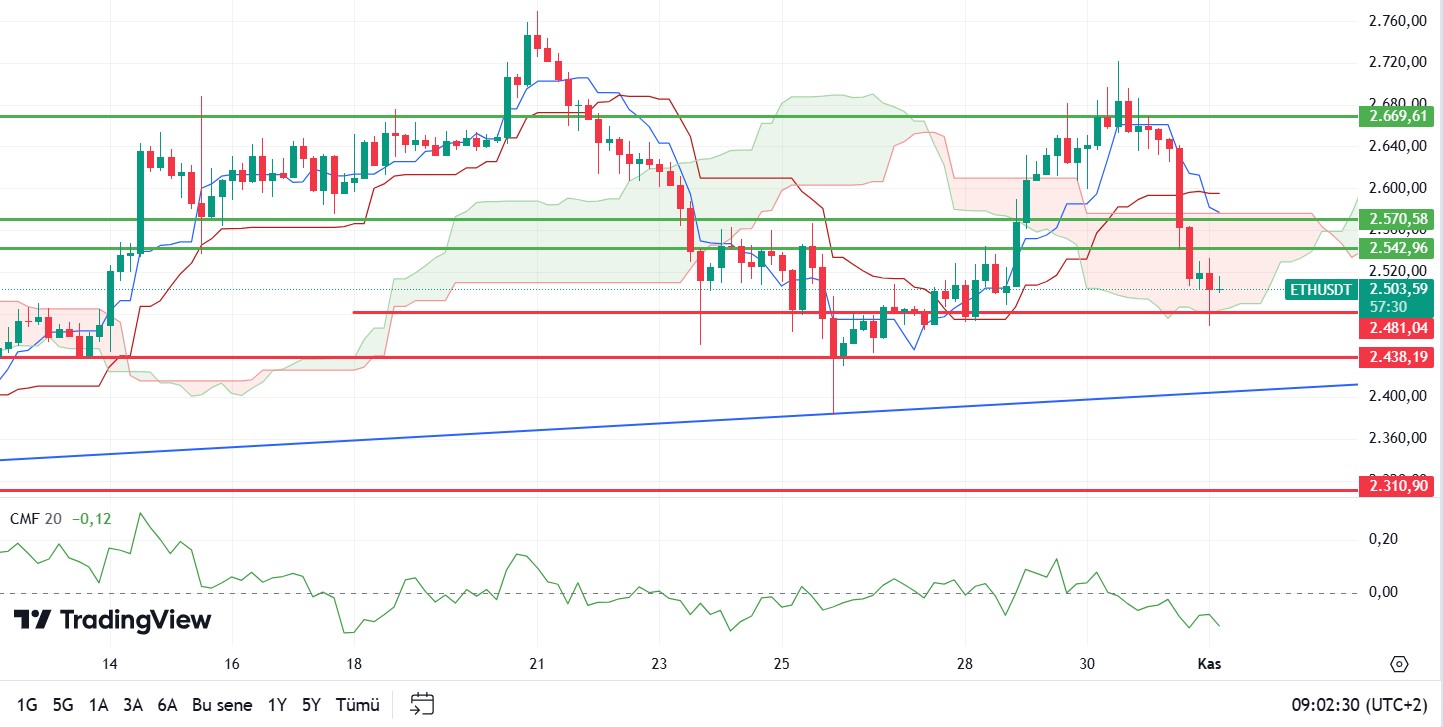
Ethereum, affected by the general decline in the markets, fell sharply to below the 2,500 level and is currently trying to hold above this level. As mentioned yesterday, the Chaikin Money Flow (CMF) turning negative and the negative structure in the Relative Strength Index (RSI) also support this decline. The negative outlook in Money Flow Index (MFI) also continues. Looking at the Ichimoku indicator, it is seen that a sell signal is formed as the tenkan level cuts the kijun level. With the break of 2,481 kumo cloud support, it can be said that the decline may continue. The blue trend line indicated on the chart can be said to be the most important support point. A break of this level may mean that the decline may continue quite sharply. For a positive outlook, it can be said that the break of the 2,571 level is important first. A break of this level could bring an end to the downtrend.
Supports 2,481 – 2,438 – 2,310
Resistances 2,542 – 2,570 – 2,669
LINK/USDT
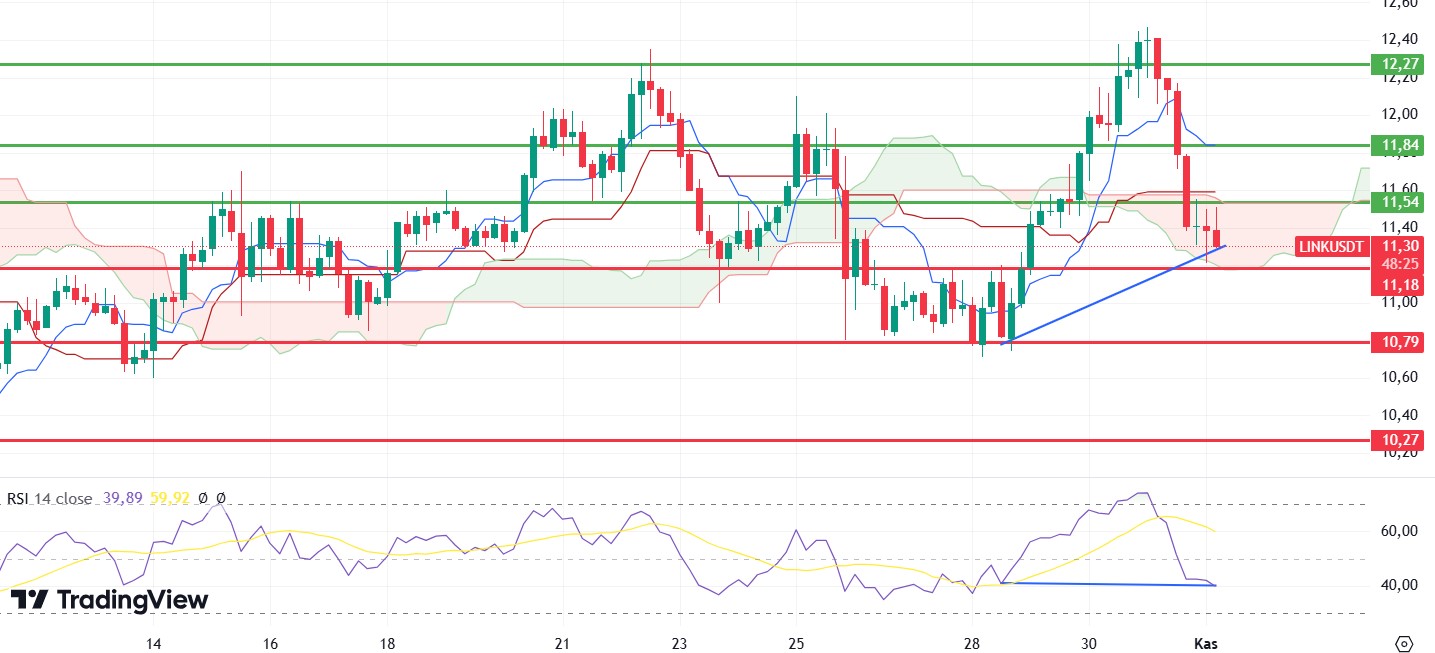
LINK fell sharply with the loss of the 11.90 level and fell below the kumo cloud support 11.54 level. Although the Chaikin Money Flow (CMF) value managed to stay in the positive area, it continues to look negative due to its structure. Although there is a positive divergence in the Relative Strength Index (RSI), it is seen that this divergence will disappear at the 10.79 level. In this context, it can be said that the decline may continue rapidly for LINK, which cannot hold up to 10.79. However, if it can provide persistence above this region, it can rise at least up to 11.54 kumo cloud resistance with a reaction rise.
Supports 11.18 – 10.79 – 10.27
Resistances 11.54 – 11.84 – 12.27
SOL/USDT
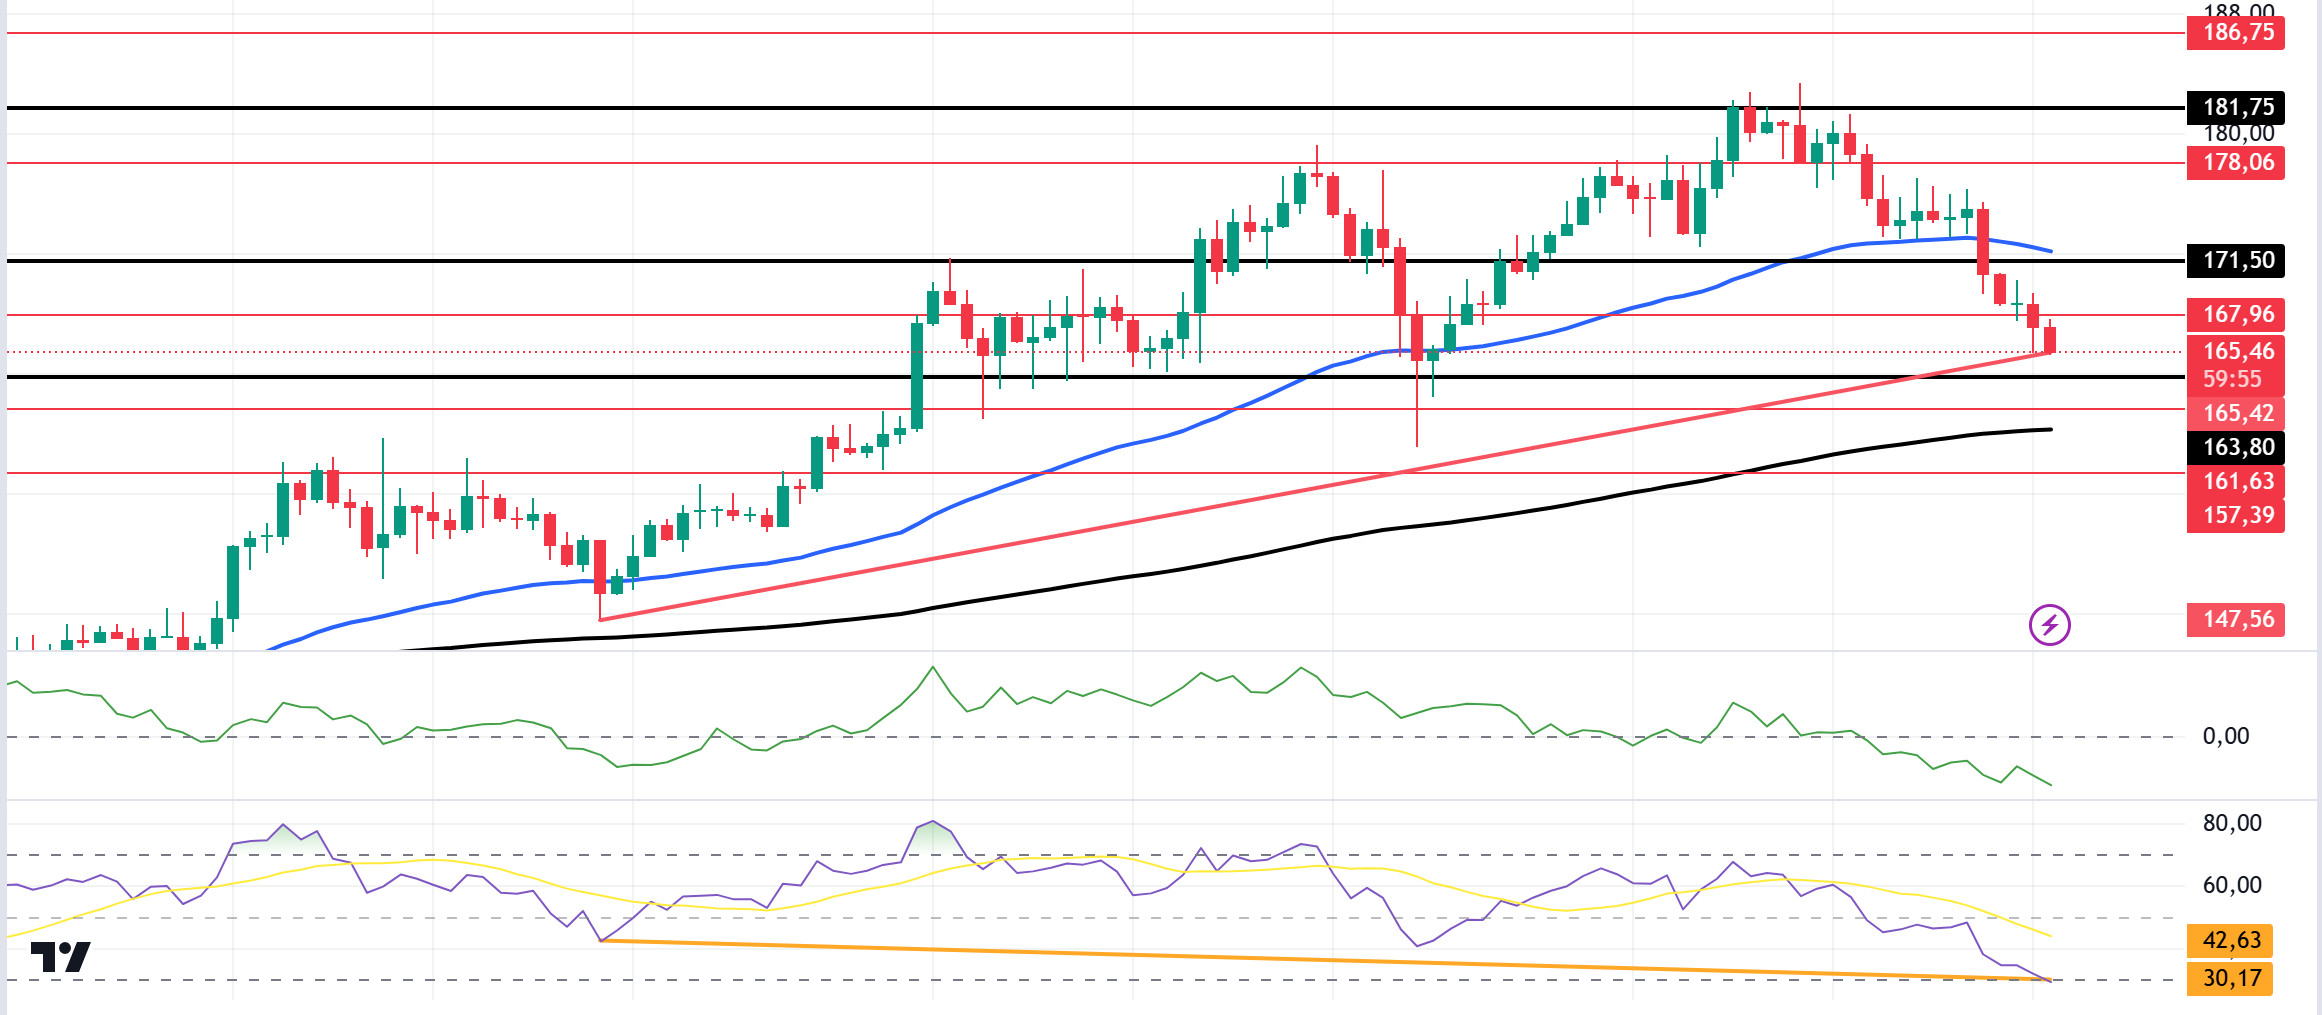
Today, average hourly earnings, non-farm payroll change and unemployment rate data from the US should be monitored. In the last 24 hours, about $ 100 billion was withdrawn from the total crypto market and fell 5.71% to $ 2.27 trillion. Technically, SOL tested the 181.75 level but could not turn it into support. On the 4-hour timeframe, the 50 EMA (Blue Line) continues to be above the 200 EMA (Black Line). This means that the uptrend will continue, but the excess distance between them may also bring possible declines. However, the price broke the 50 EMA as it continues to form higher highs and higher lows. This could mean that the declines will deepen. On the other hand, the Relative Strength Index (RSI) 14 shows a mismatch with the price. This could be a bullish harbinger. However, when we examine the Chaikin Money Flow (CMF)20 indicator, money outflows continue to increase by moving into the negative zone. The 181.75 level stands out as a very strong resistance point in the uptrend driven by both macroeconomic conditions and innovations in the Solana ecosystem. If it rises above this level, the rise may continue strongly. In case of possible political reasons or profit sales, the 163.80 support level may be triggered again. If the price reaches this support level, a potential bullish opportunity may arise.
Supports 163.80 – 161.63 – 157.39
Resistances 178.06 – 181.75 – 186.75
ADA/USDT
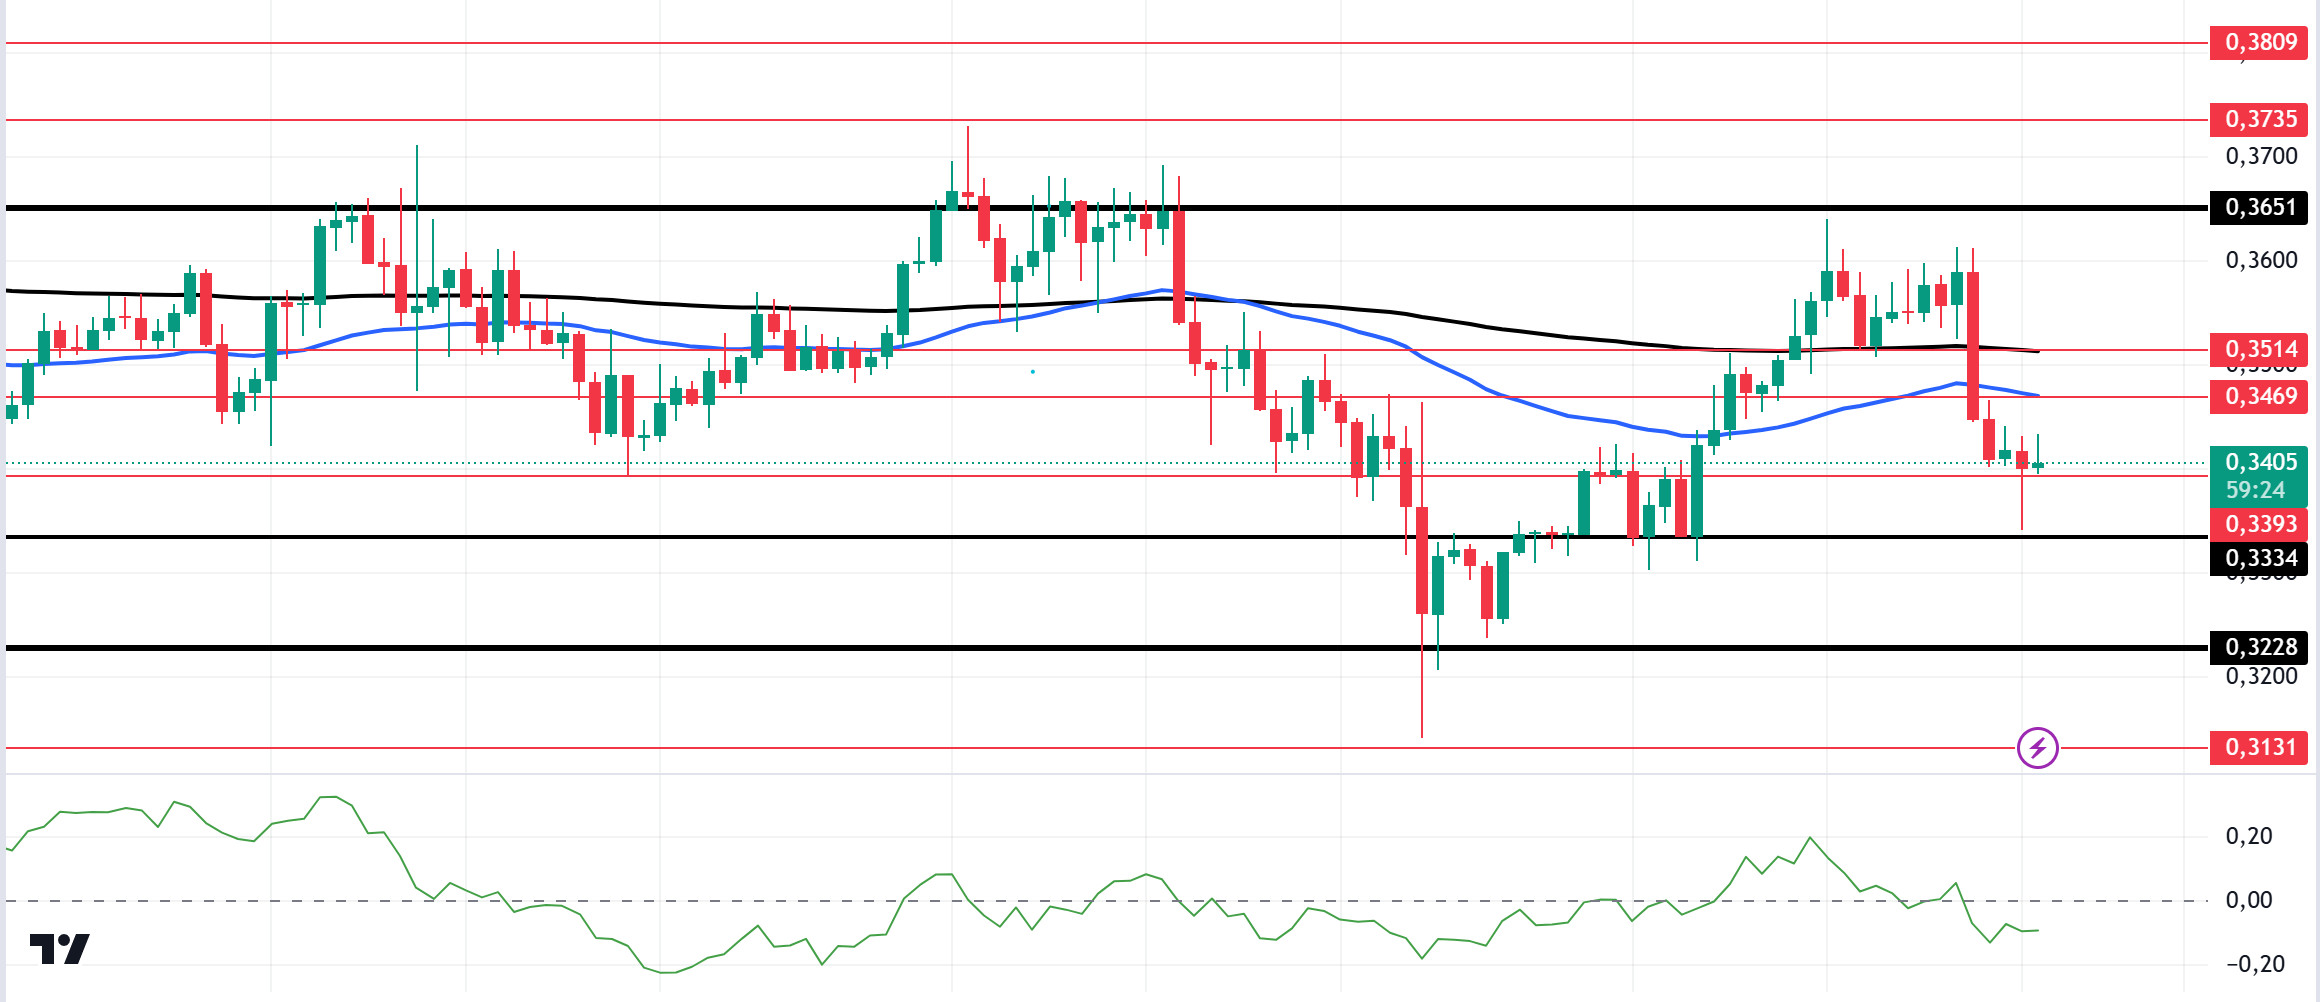
Today, average hourly earnings, non-farm payroll change and unemployment rate data from the US should be monitored. Nearly $100 billion was withdrawn from the total crypto market in the last 24 hours, dropping 5.71% to $2.27 trillion. On the 4-hour chart, the price broke the 50 EMA (Blue Line) and 200 EMA (Black Line) to the downside. However, the 50 EMA hovers below the 200 EMA. This shows that the trend is bearish. At the same time, when we examine the Chaikin Money Flow (CMF)20 indicator, it moves into the negative zone, showing us that money outflows continue to increase. However, the ADA may test the 0.3651 level once again. In the decline that will be experienced due to the macroeconomic data and negativities in the ecosystem, the support level of 0.3334 should be followed. It may be appropriate to buy when it comes to this price level. In the rises due to developments in the ecosystem, if the 0.3651 level is broken in volume, the upward acceleration will increase even more and the 0.3905 level should be followed as a retracement place.
Supports 0.3393 – 0.3334 – 0.3228
Resistances 0.3469 – 0.3514 – 0.3651
AVAX/USDT
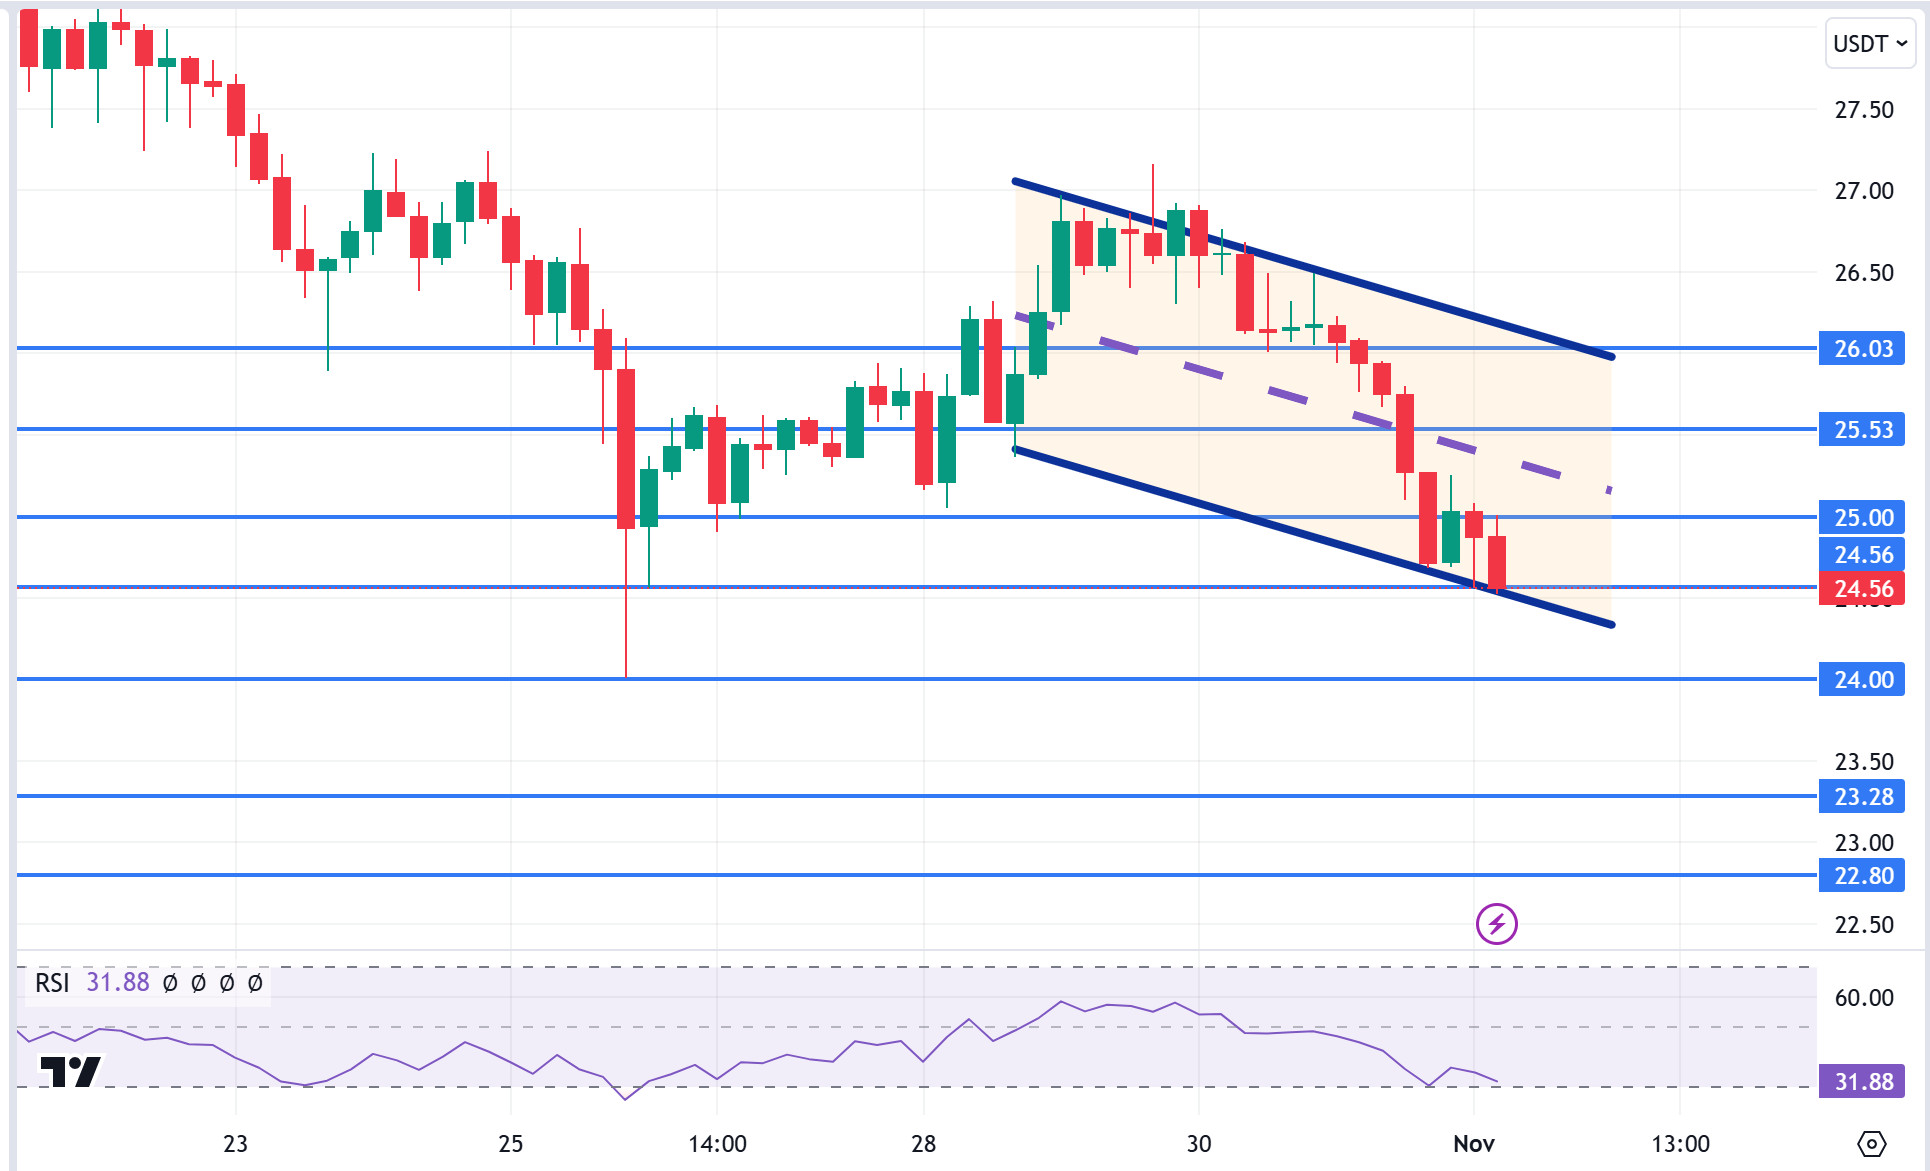
AVAX, which opened yesterday at 26.17, fell by about 4.5% during the day and closed the day at 25.03. Today, non-farm payrolls, unemployment rate, manufacturing purchasing managers’ index and manufacturing purchasing managers’ index data will be released by the US. In addition, news flows from the Middle East will be important for the market.
AVAX, currently trading at 24.56, is moving within the bearish channel on the 4-hour chart. It is in the lower band of the bearish channel and with a Relative Strength Index value of 31, it can be expected to rise slightly from these levels. In such a case, it may test the 25.00 and 25.53 resistances. On the other hand, selling pressure may increase if today’s data negatively affects the market or news of increased tension in the Middle East. In such a case, it may test the 24.00 support. As long as it stays above 22.80 support during the day, the desire to rise may continue. With the break of 22.80 support, sales may increase.
Supports 24.56 – 24.00 – 23.28
Resistances 25.00 – 25.53 – 26.03
TRX/USDT
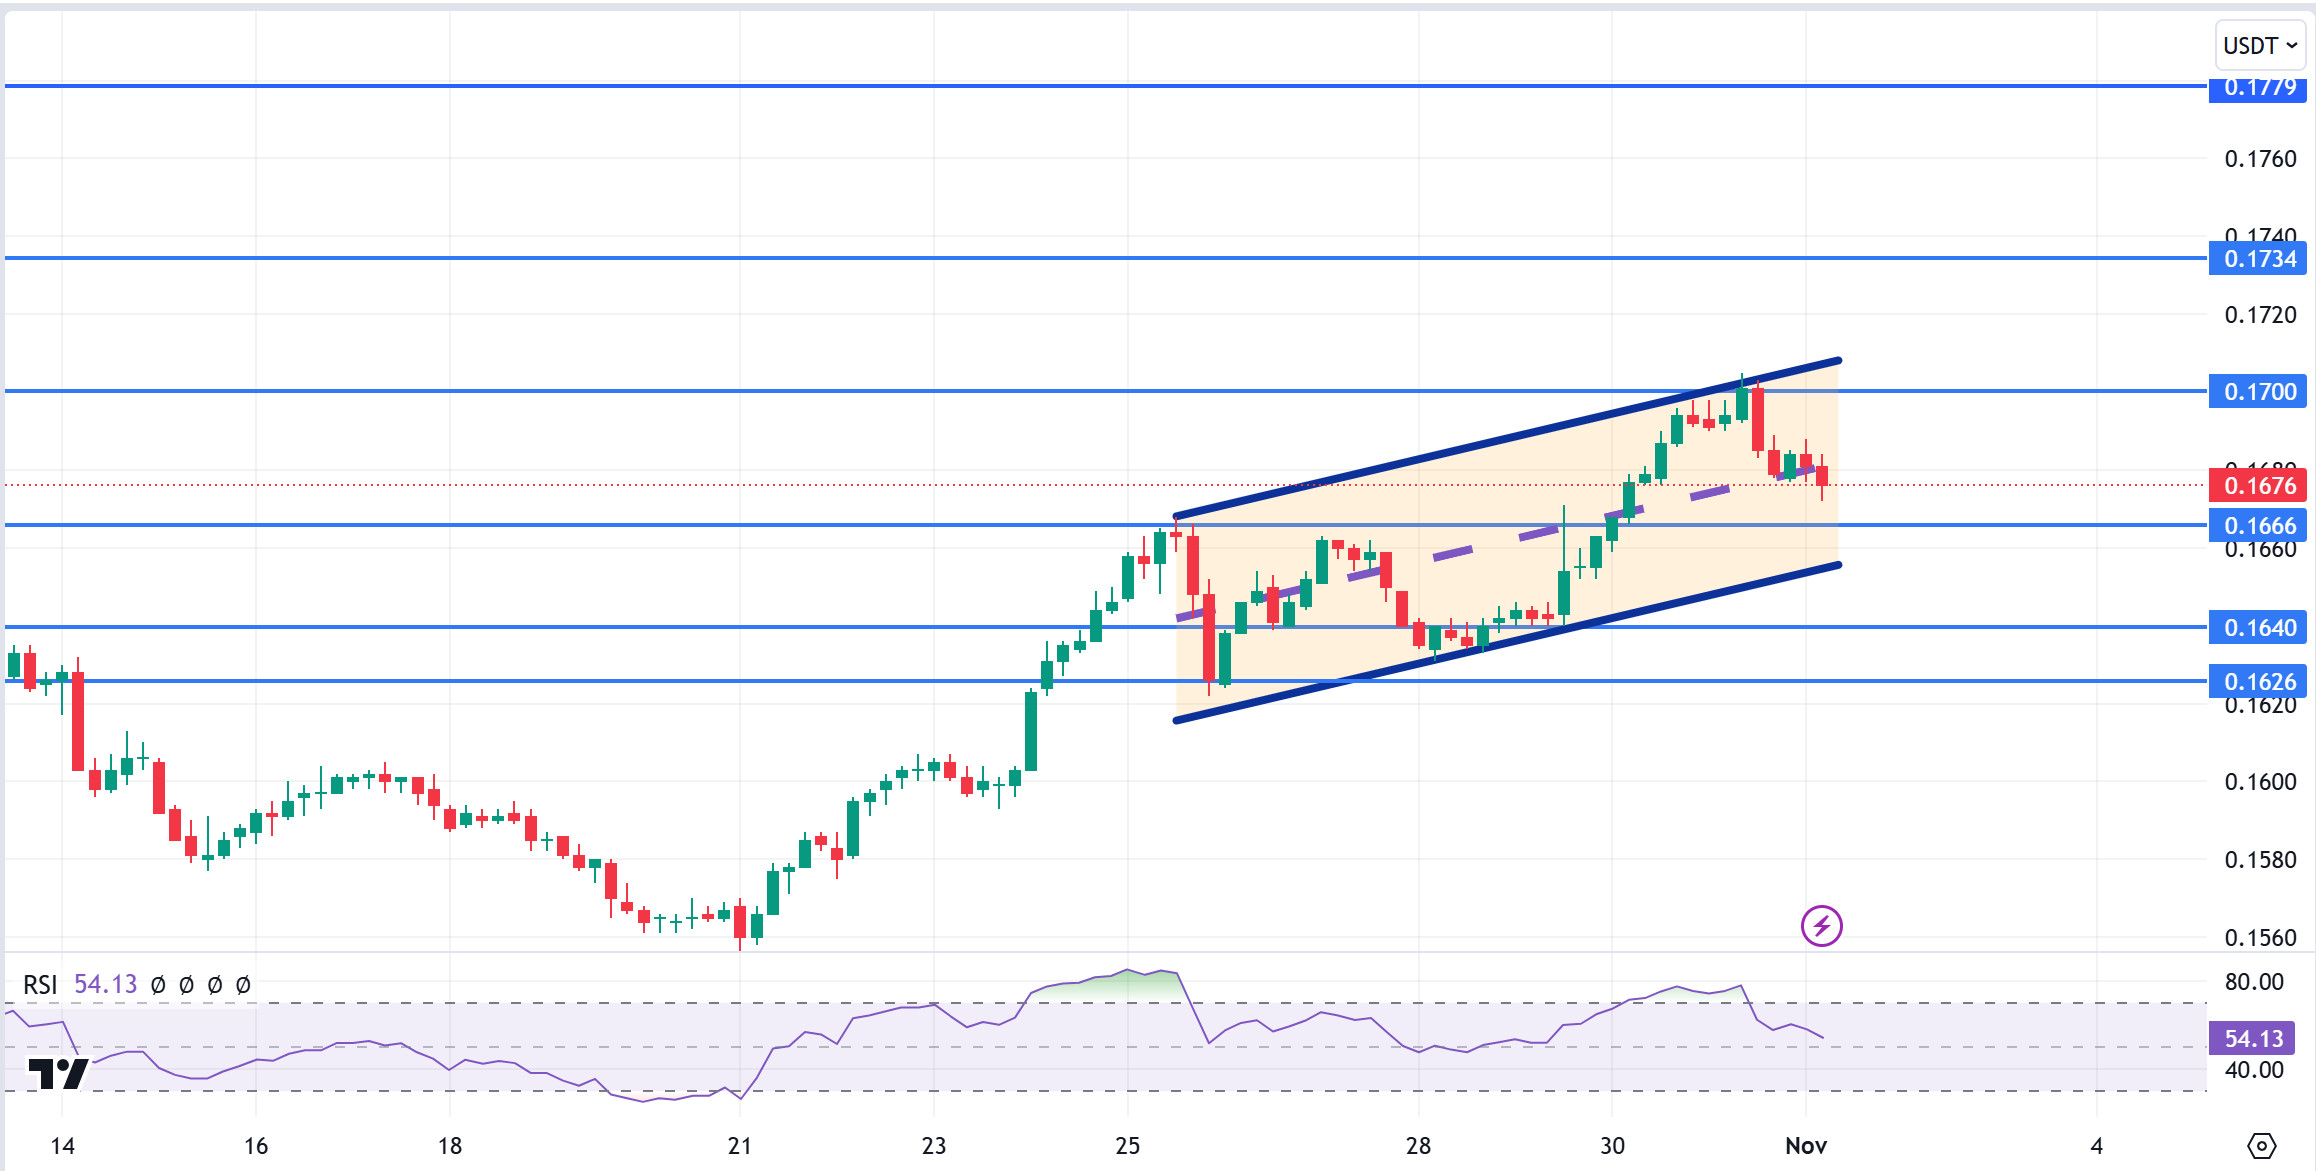
TRX, which started yesterday at 0.1693, fell 0.5% during the day and closed the day at 0.1684. Today, US non-farm payrolls, unemployment rate, manufacturing purchasing managers index and manufacturing purchasing managers index are important data that the market will follow. Volatility in the market may increase during the release of these data. The market will also be closely following the news flows regarding the tension in the Middle East.
TRX, currently trading at 0.1676, is in the bullish channel mid-band on the 4-hour chart. The Relative Strength Index value is 54, which is in the overbought zone and can be expected to decline slightly from its current level. In such a case, it may move to the lower band of the channel and test the 0.1666 and 0.1640 supports. However, if it cannot close the candle under 0.1666 support, it may test 0.1700 resistance with the buying reaction that will occur. As long as TRX stays above 0.1482 support, the desire to rise may continue. If this support is broken downwards, sales can be expected to increase.
Supports 0.1666 – 0.1640 – 0.1626
Resistances 0.1700 – 0.1734 – 0.1779
DOT/USDT
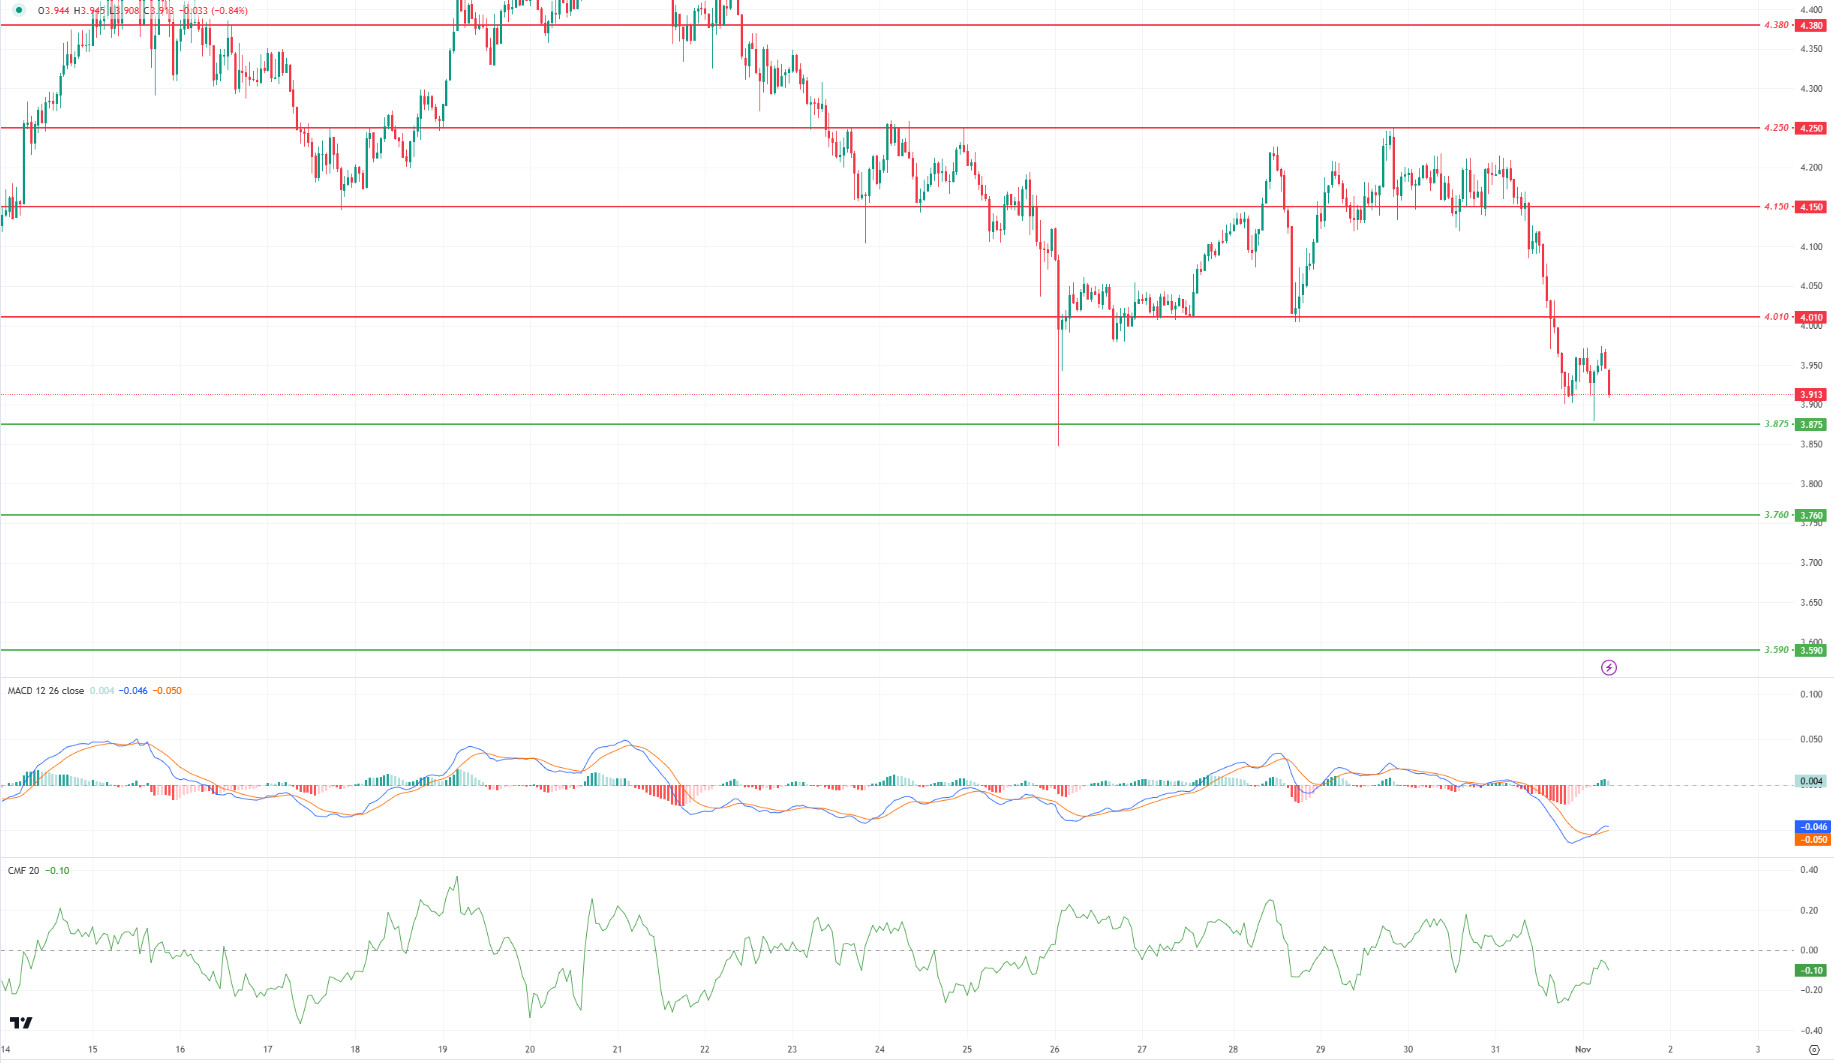
On the Polkadot (DOT) chart, the price broke the 4.010 support level down as selling pressure increased. The price fell down to 3.875 support levels. When we analyze the Chaikin Money Flow (CMF) oscillator, we see that the selling pressure remains strong. According to the MACD oscillator, we can say that the buying pressure has decreased compared to the previous hour. In this context, if the price does not get a reaction from the 3.875 support level, it may move towards the next support level of 3.760. On the other hand, if the price increases the buying pressure, it may want to break the selling pressure at the 4.010 level.
Supports 3.875 – 3.760 – 3.590
Resistances 4.010 – 4.150 – 4.250
SHIB/USDT
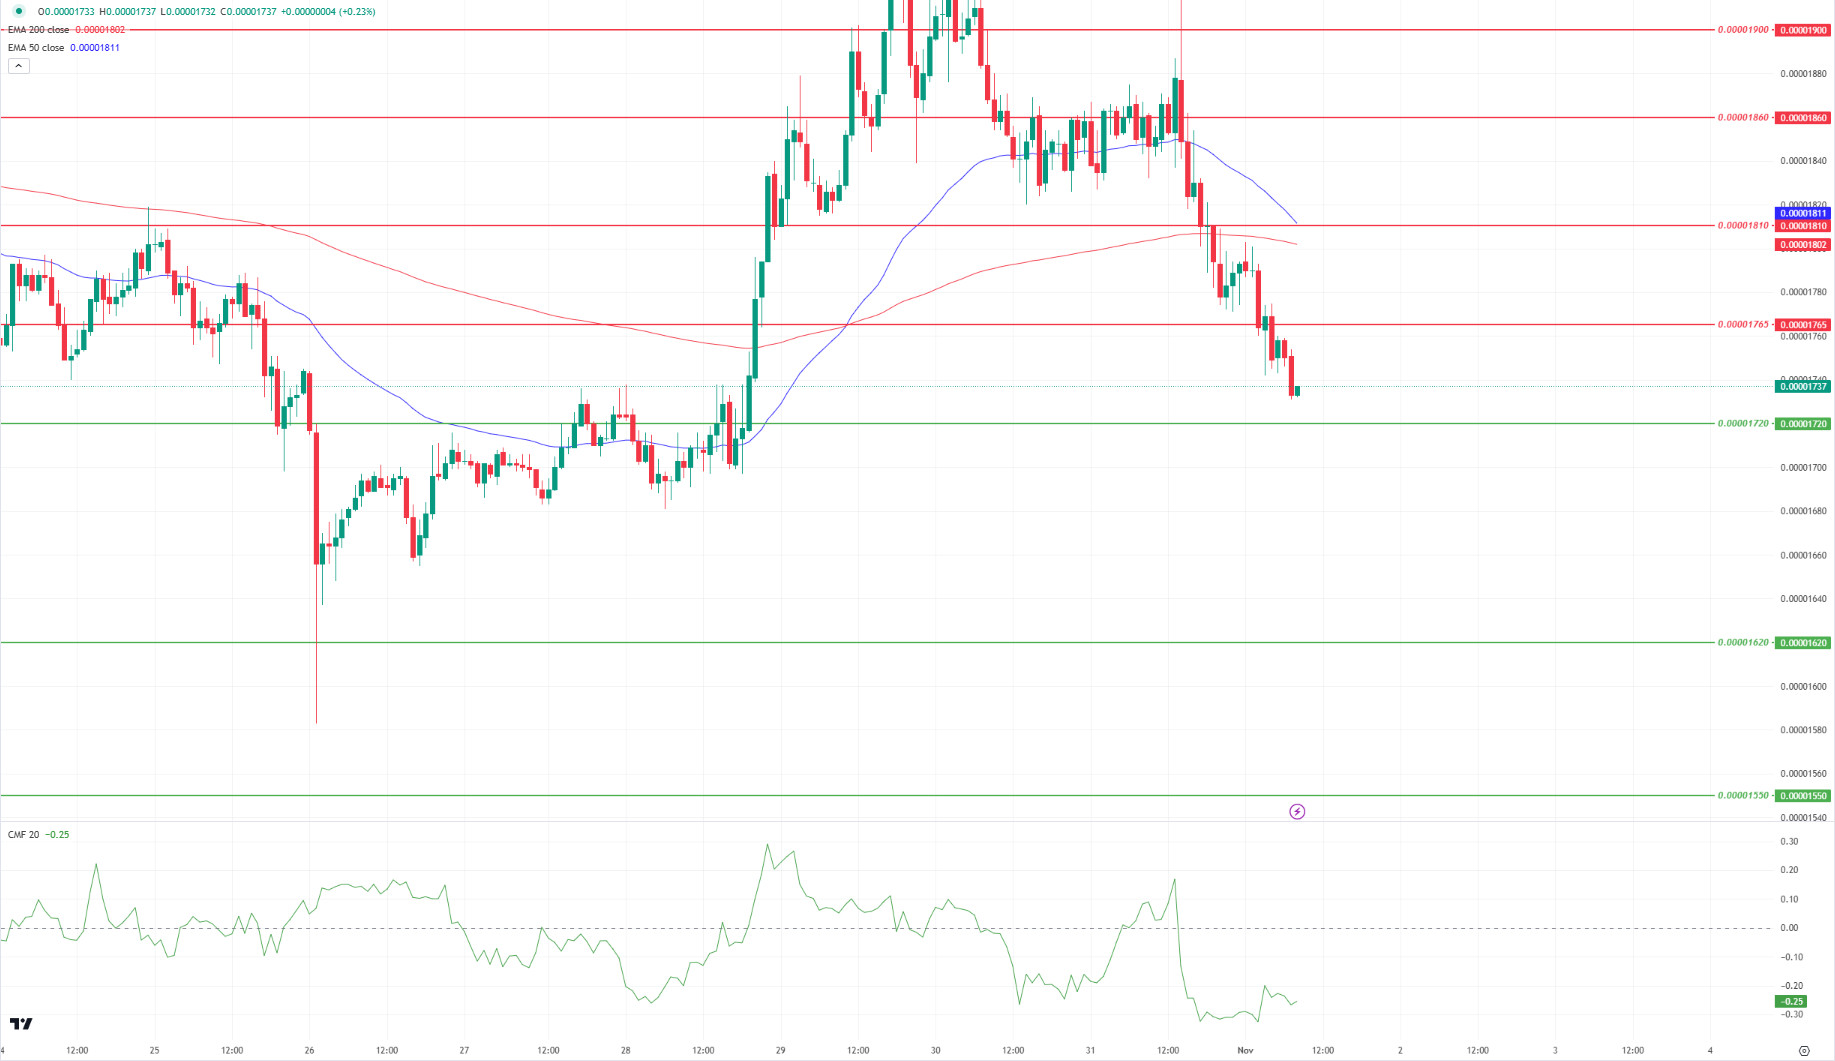
When we examine the chart of Shib Inu (SHIB), the price seems to have broken down the support levels of 0.00001810 and 0.00001765. According to the Chaikin Money Flow (CMF) oscillator, the selling pressure remains strong. The EMA50 line (Blue Line) is preparing to break down the EMA200 (Red Line). In this context, if the price does not get a reaction from the 0.00001720 support level, a retracement towards 0.00001620 levels may be seen. On the other hand, if the price reacts from 0.00001720 levels, we may see a move towards 0.00001765 levels.
Supports 0.00001720 – 0.00001620 – 0.00001550
Resistances 0.00001810 – 0.00001765 – 0.00001860
YASAL BİLDİRİM
Burada yer alan yatırım bilgi, yorum ve tavsiyeleri yatırım danışmanlığı kapsamında değildir. Yatırım danışmanlığı hizmeti, kişilerin risk ve getiri tercihleri dikkate alınarak yetkili kuruluşlar tarafından bireysel olarak verilmektedir. Burada yer alan yorum ve tavsiyeler genel niteliktedir. Bu tavsiyeler mali durumunuz ile risk ve getiri tercihlerinize uygun olmayabilir. Bu nedenle, sadece burada yer alan bilgilere dayanarak yatırım kararı vermeniz beklentileriniz doğrultusunda sonuç vermeyebilir.