
Aktif Adresler
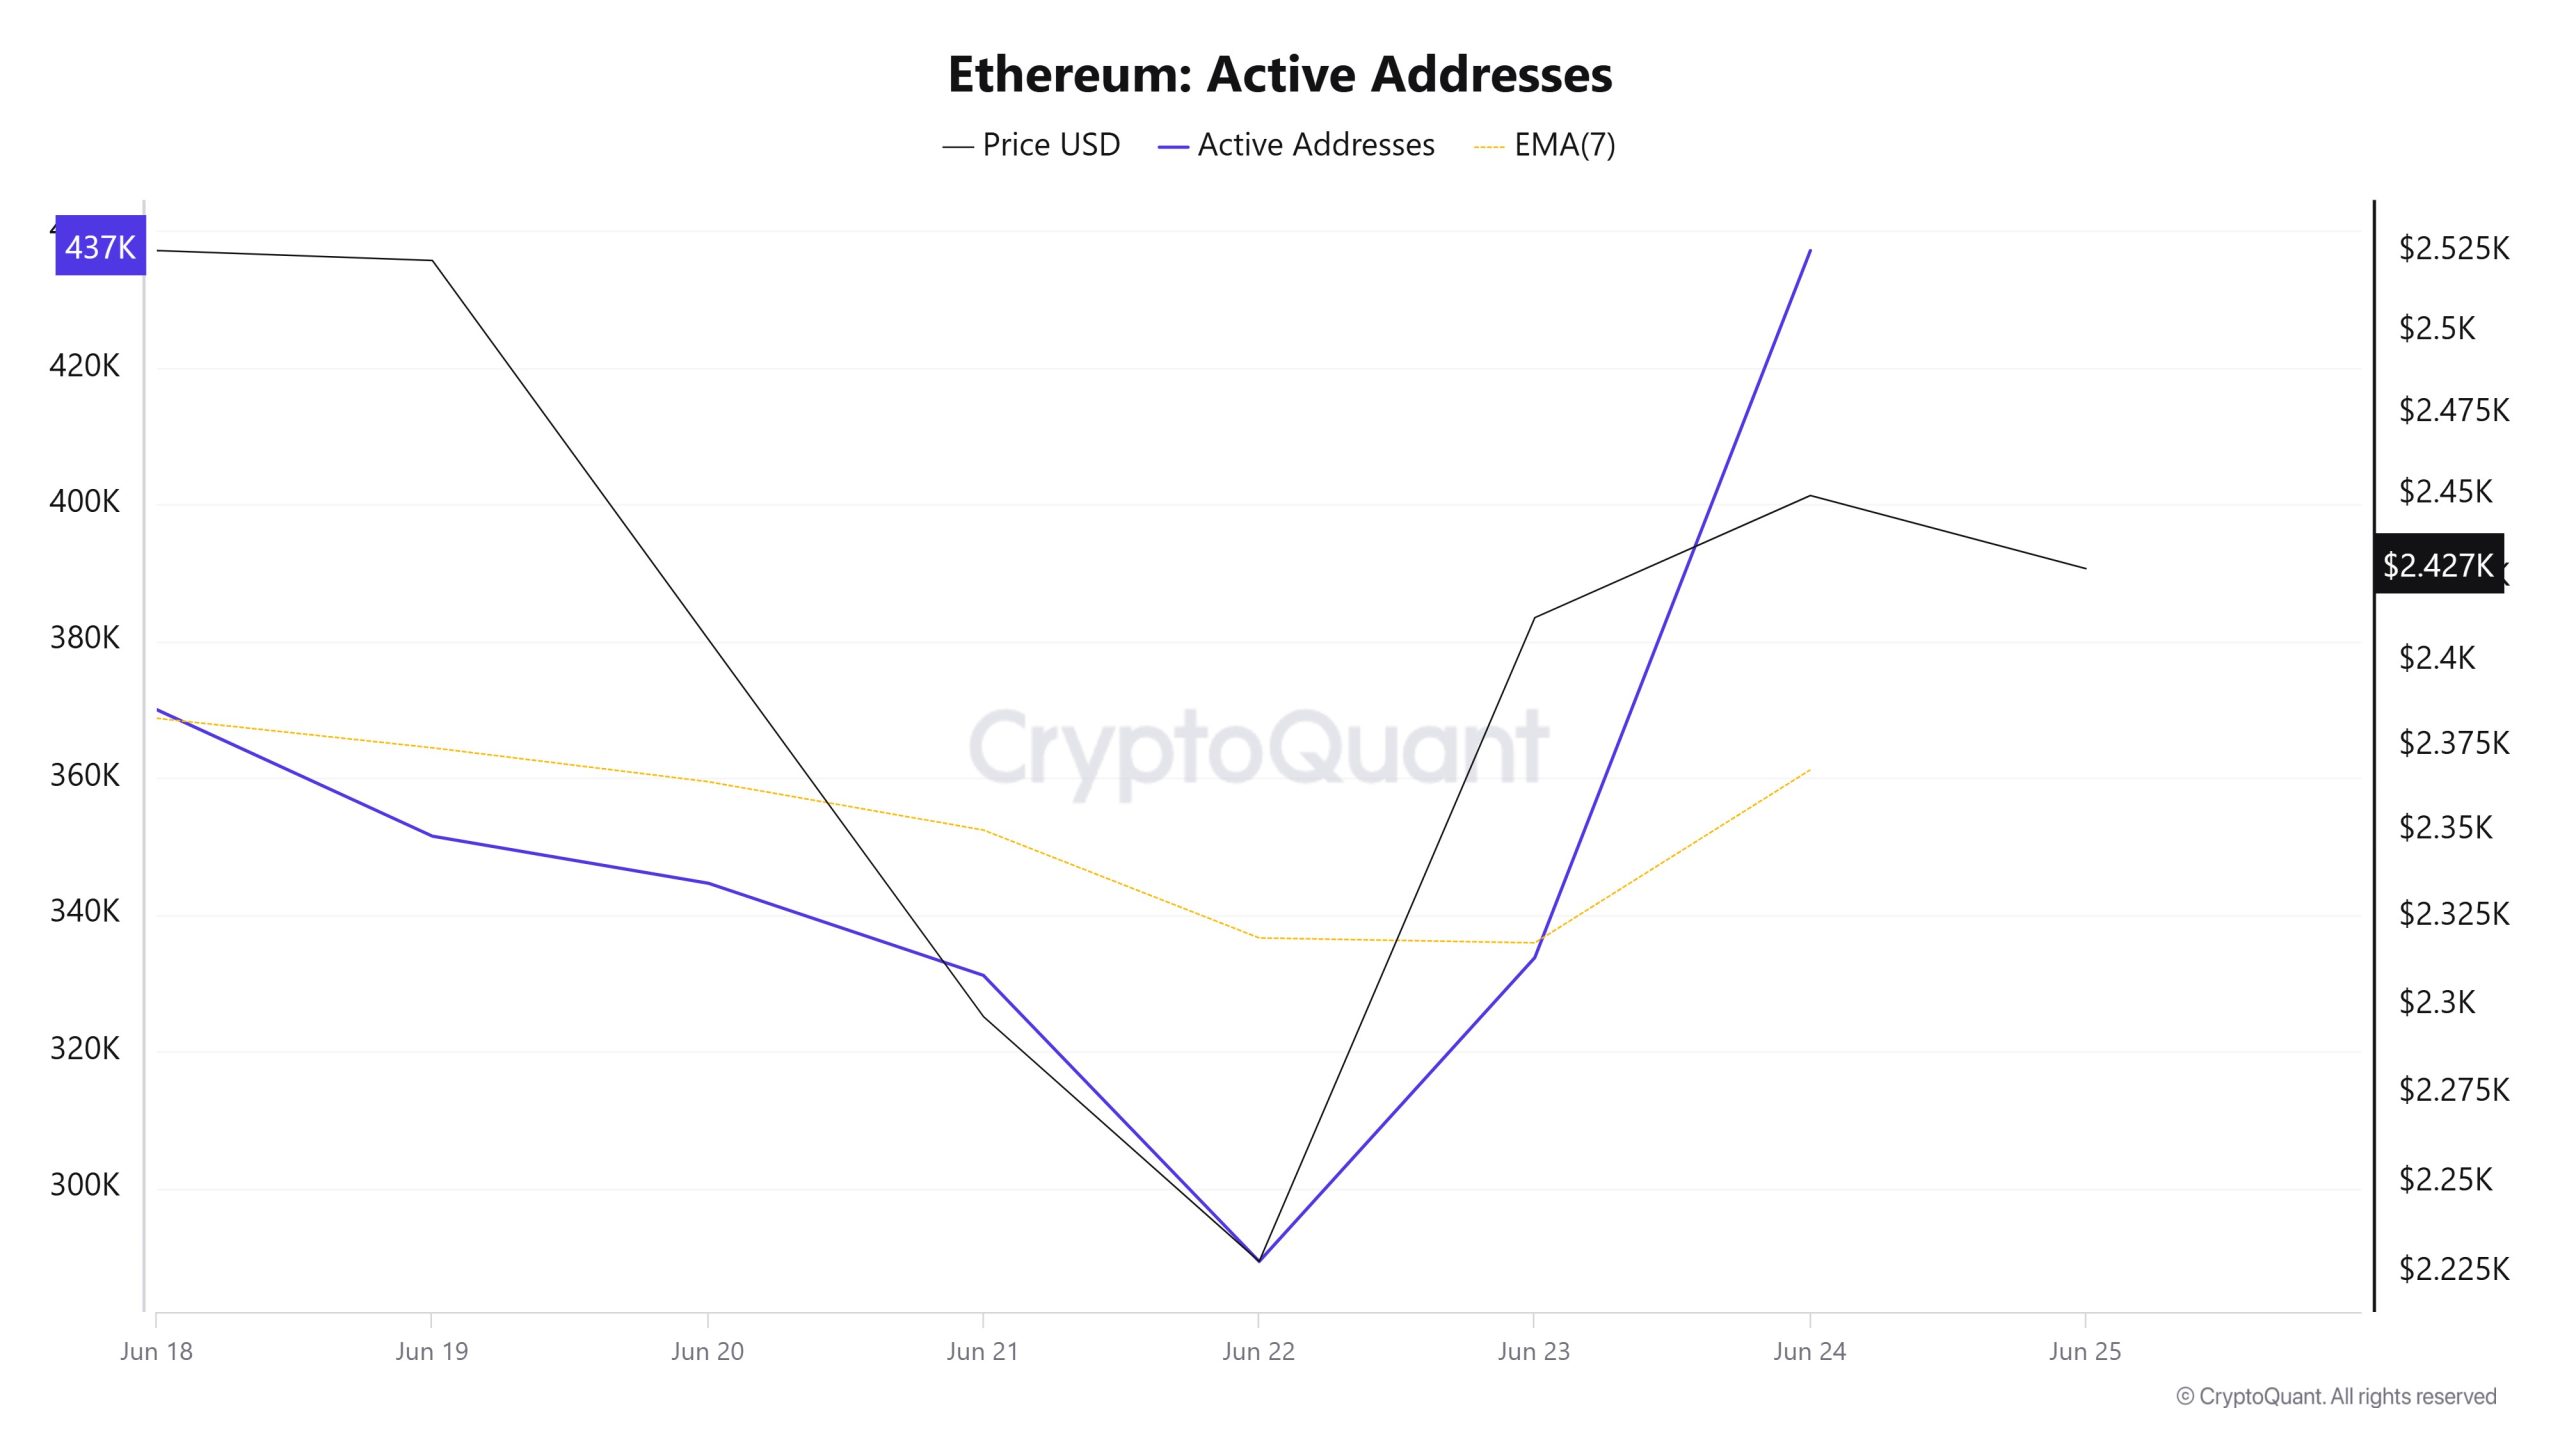
Between Haziran 18 and Haziran 25, there were 437,144 active inflows to the ETH network. In this date range, Ethereum rose from $2,225 to $2,525. On Haziran 15, at the intersection of price and the number of active addresses, it is seen that the number of active addresses increased with Ethereum purchases. When the 7-day simple moving average is followed, it is observed that there is an upward trend in Ethereum price.
Aktif Gönderme Adresleri
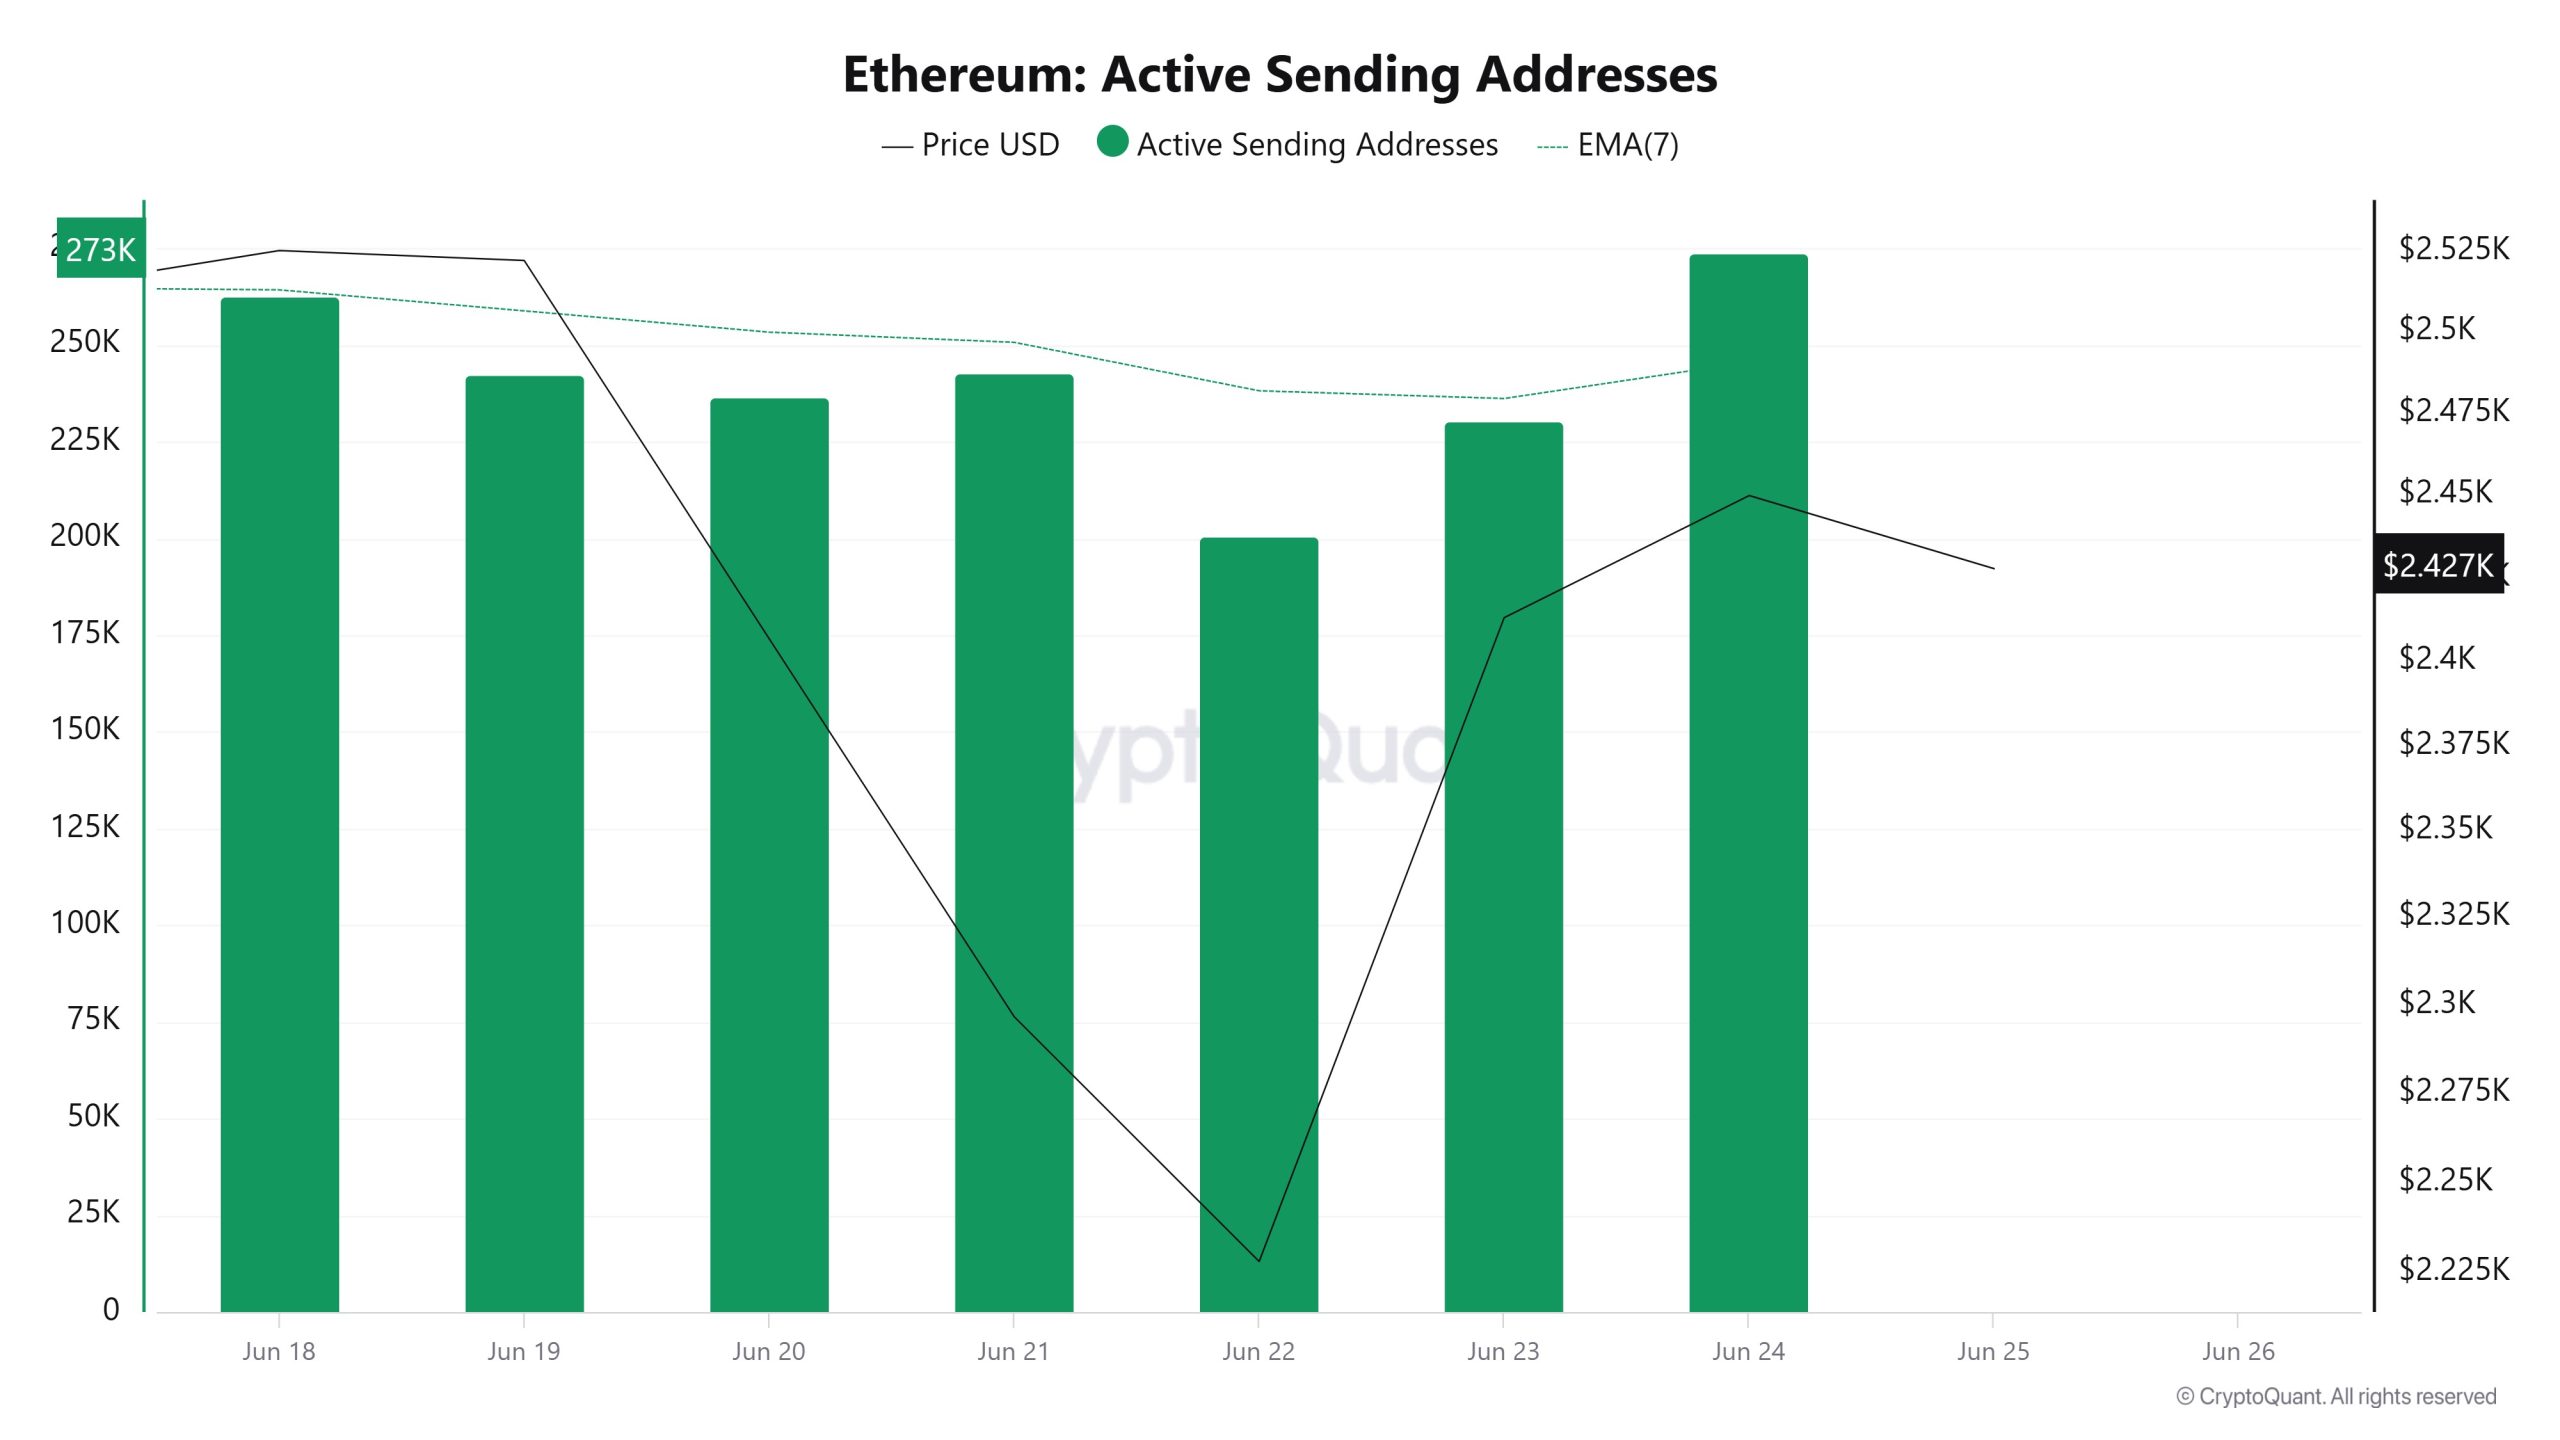
Between Haziran 18 and 25, a bearish trend was observed in active shipping addresses with the Black Line (price line). On the day the price reached a weekly high, active shipping addresses were 273,853; on Haziran 22, the day Ethereum hit its weekly low, active shipping addresses fell to 200,617. This situation caused Ethereum to rise to $2,500 levels.
Aktif Alıcı Adresleri
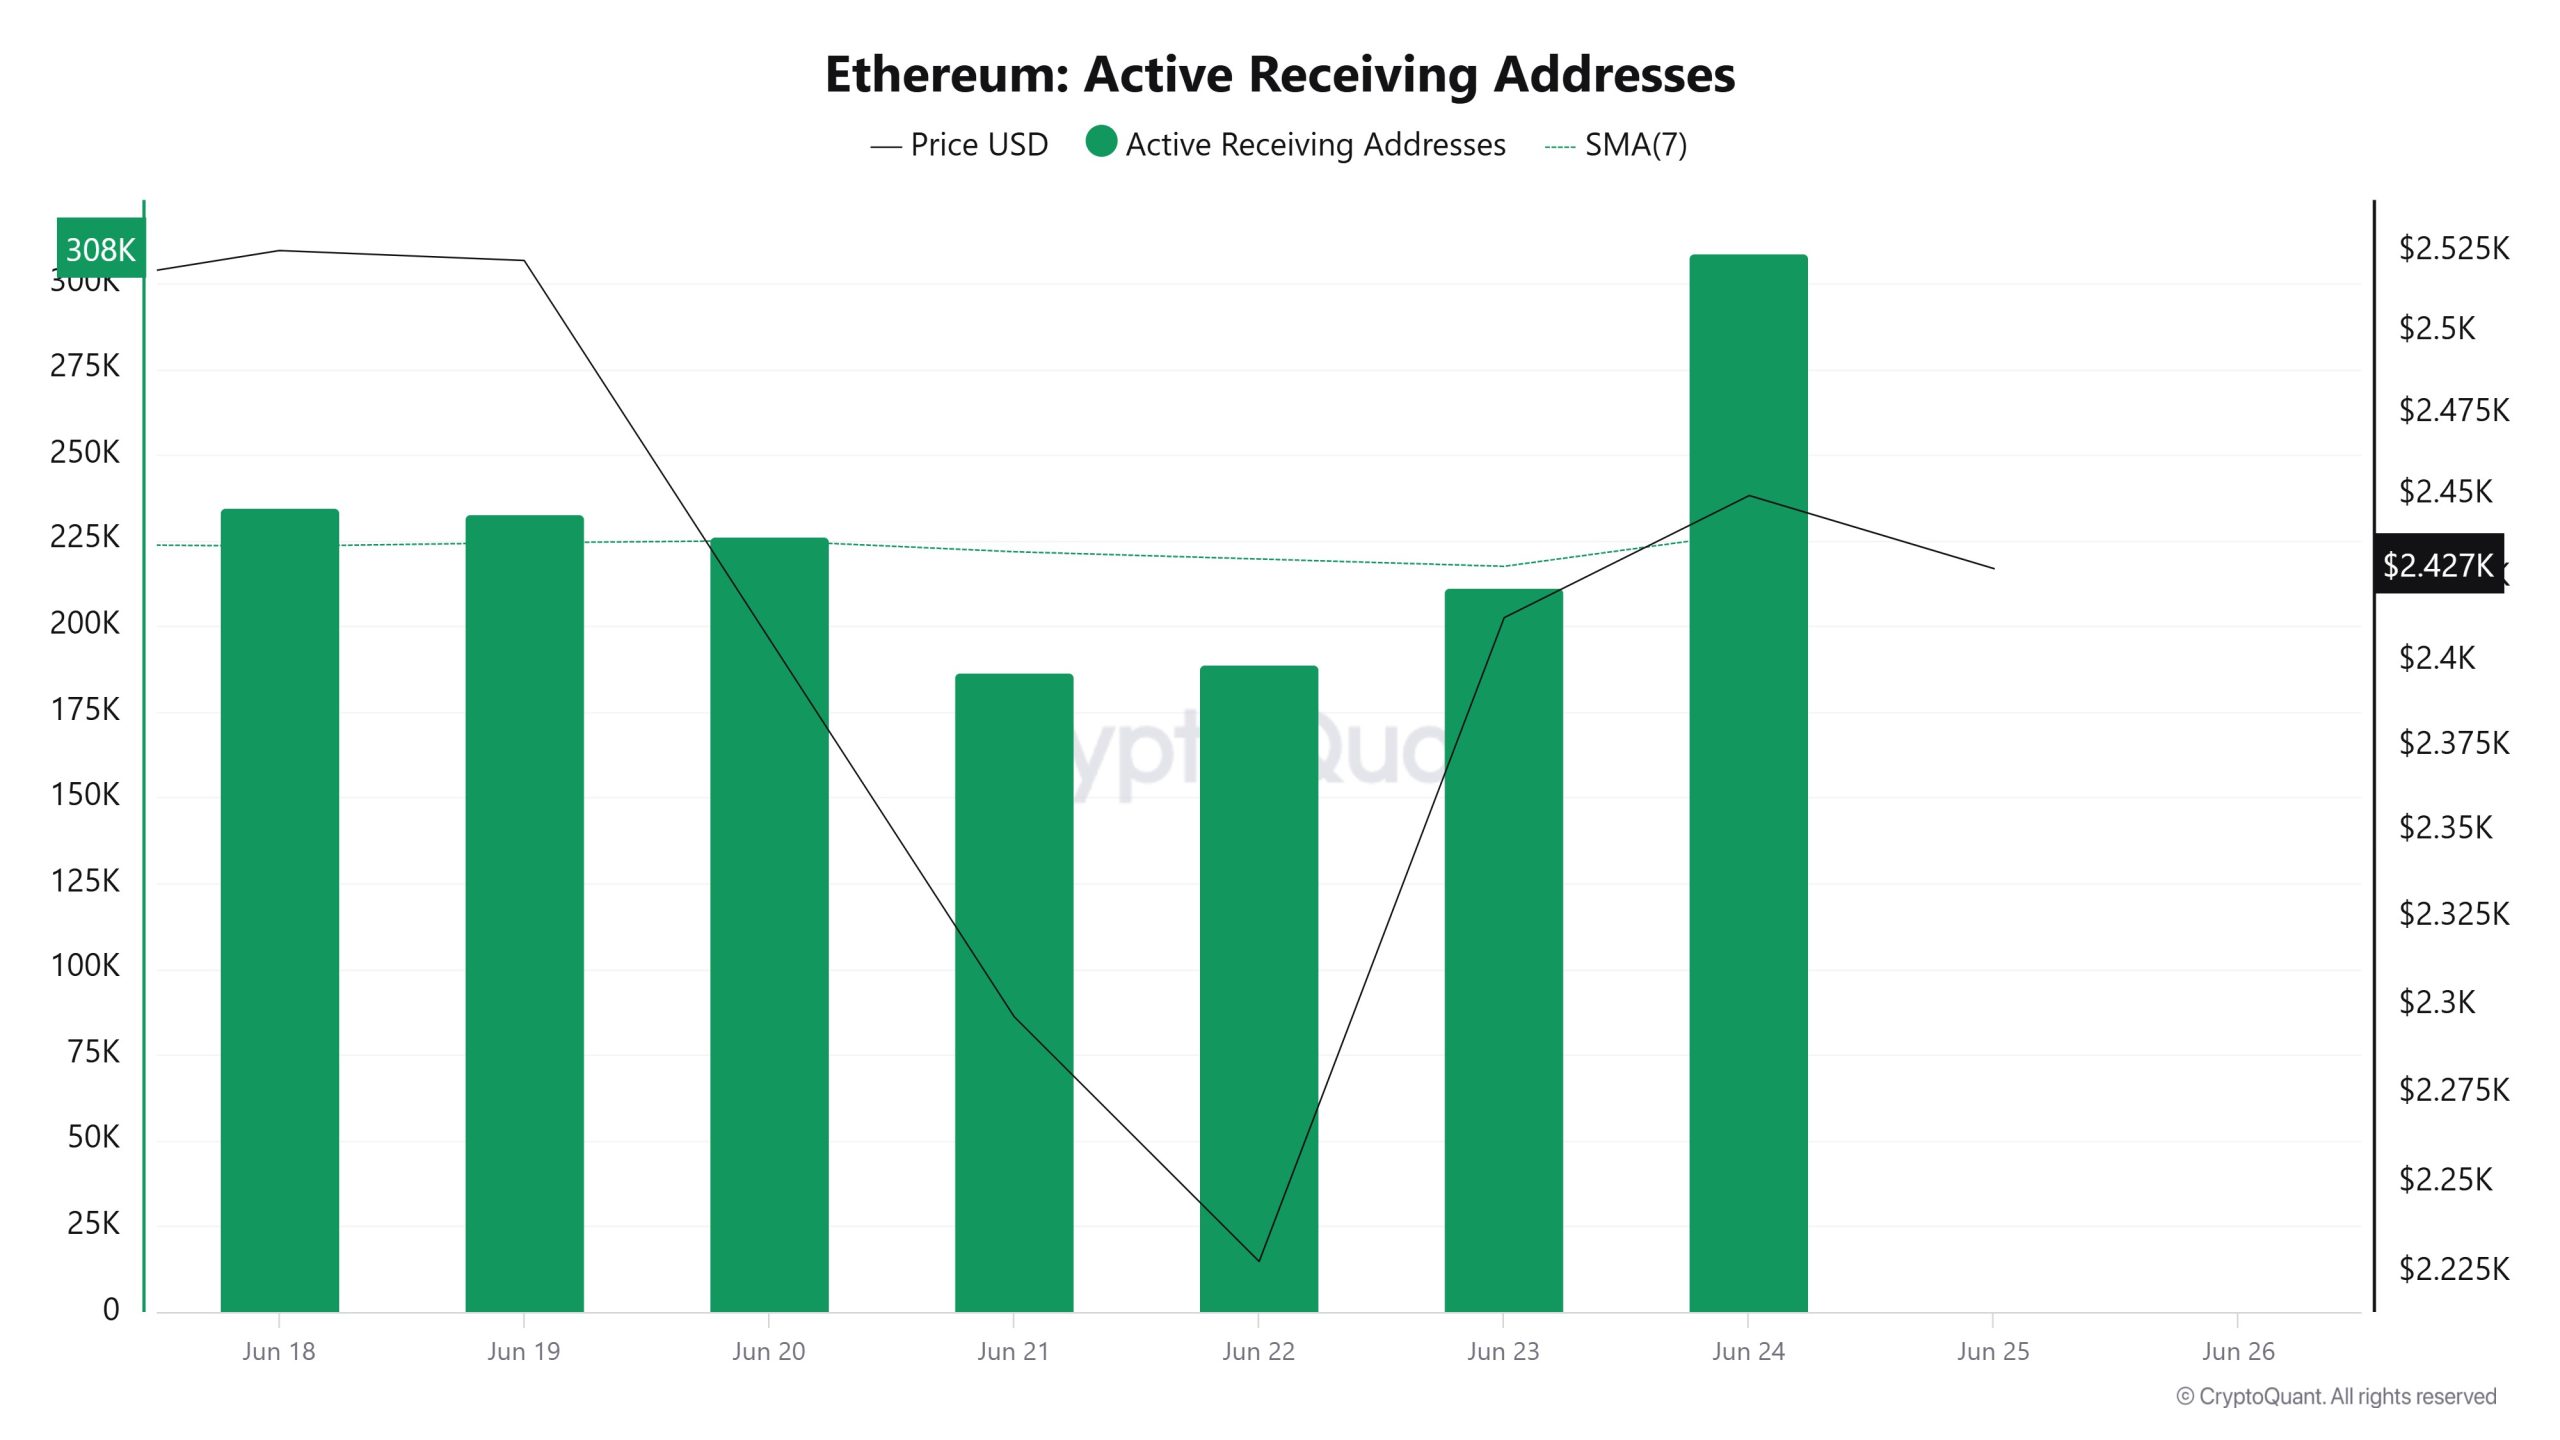
Between Haziran 18-25, there was a significant drop in active buying addresses, while the price fell in a correlated manner. On the day the price peaked, active receiving addresses were as high as 308,785, indicating that buyers were buying Ethereum at $2,450.
Toplam Bahis Değeri
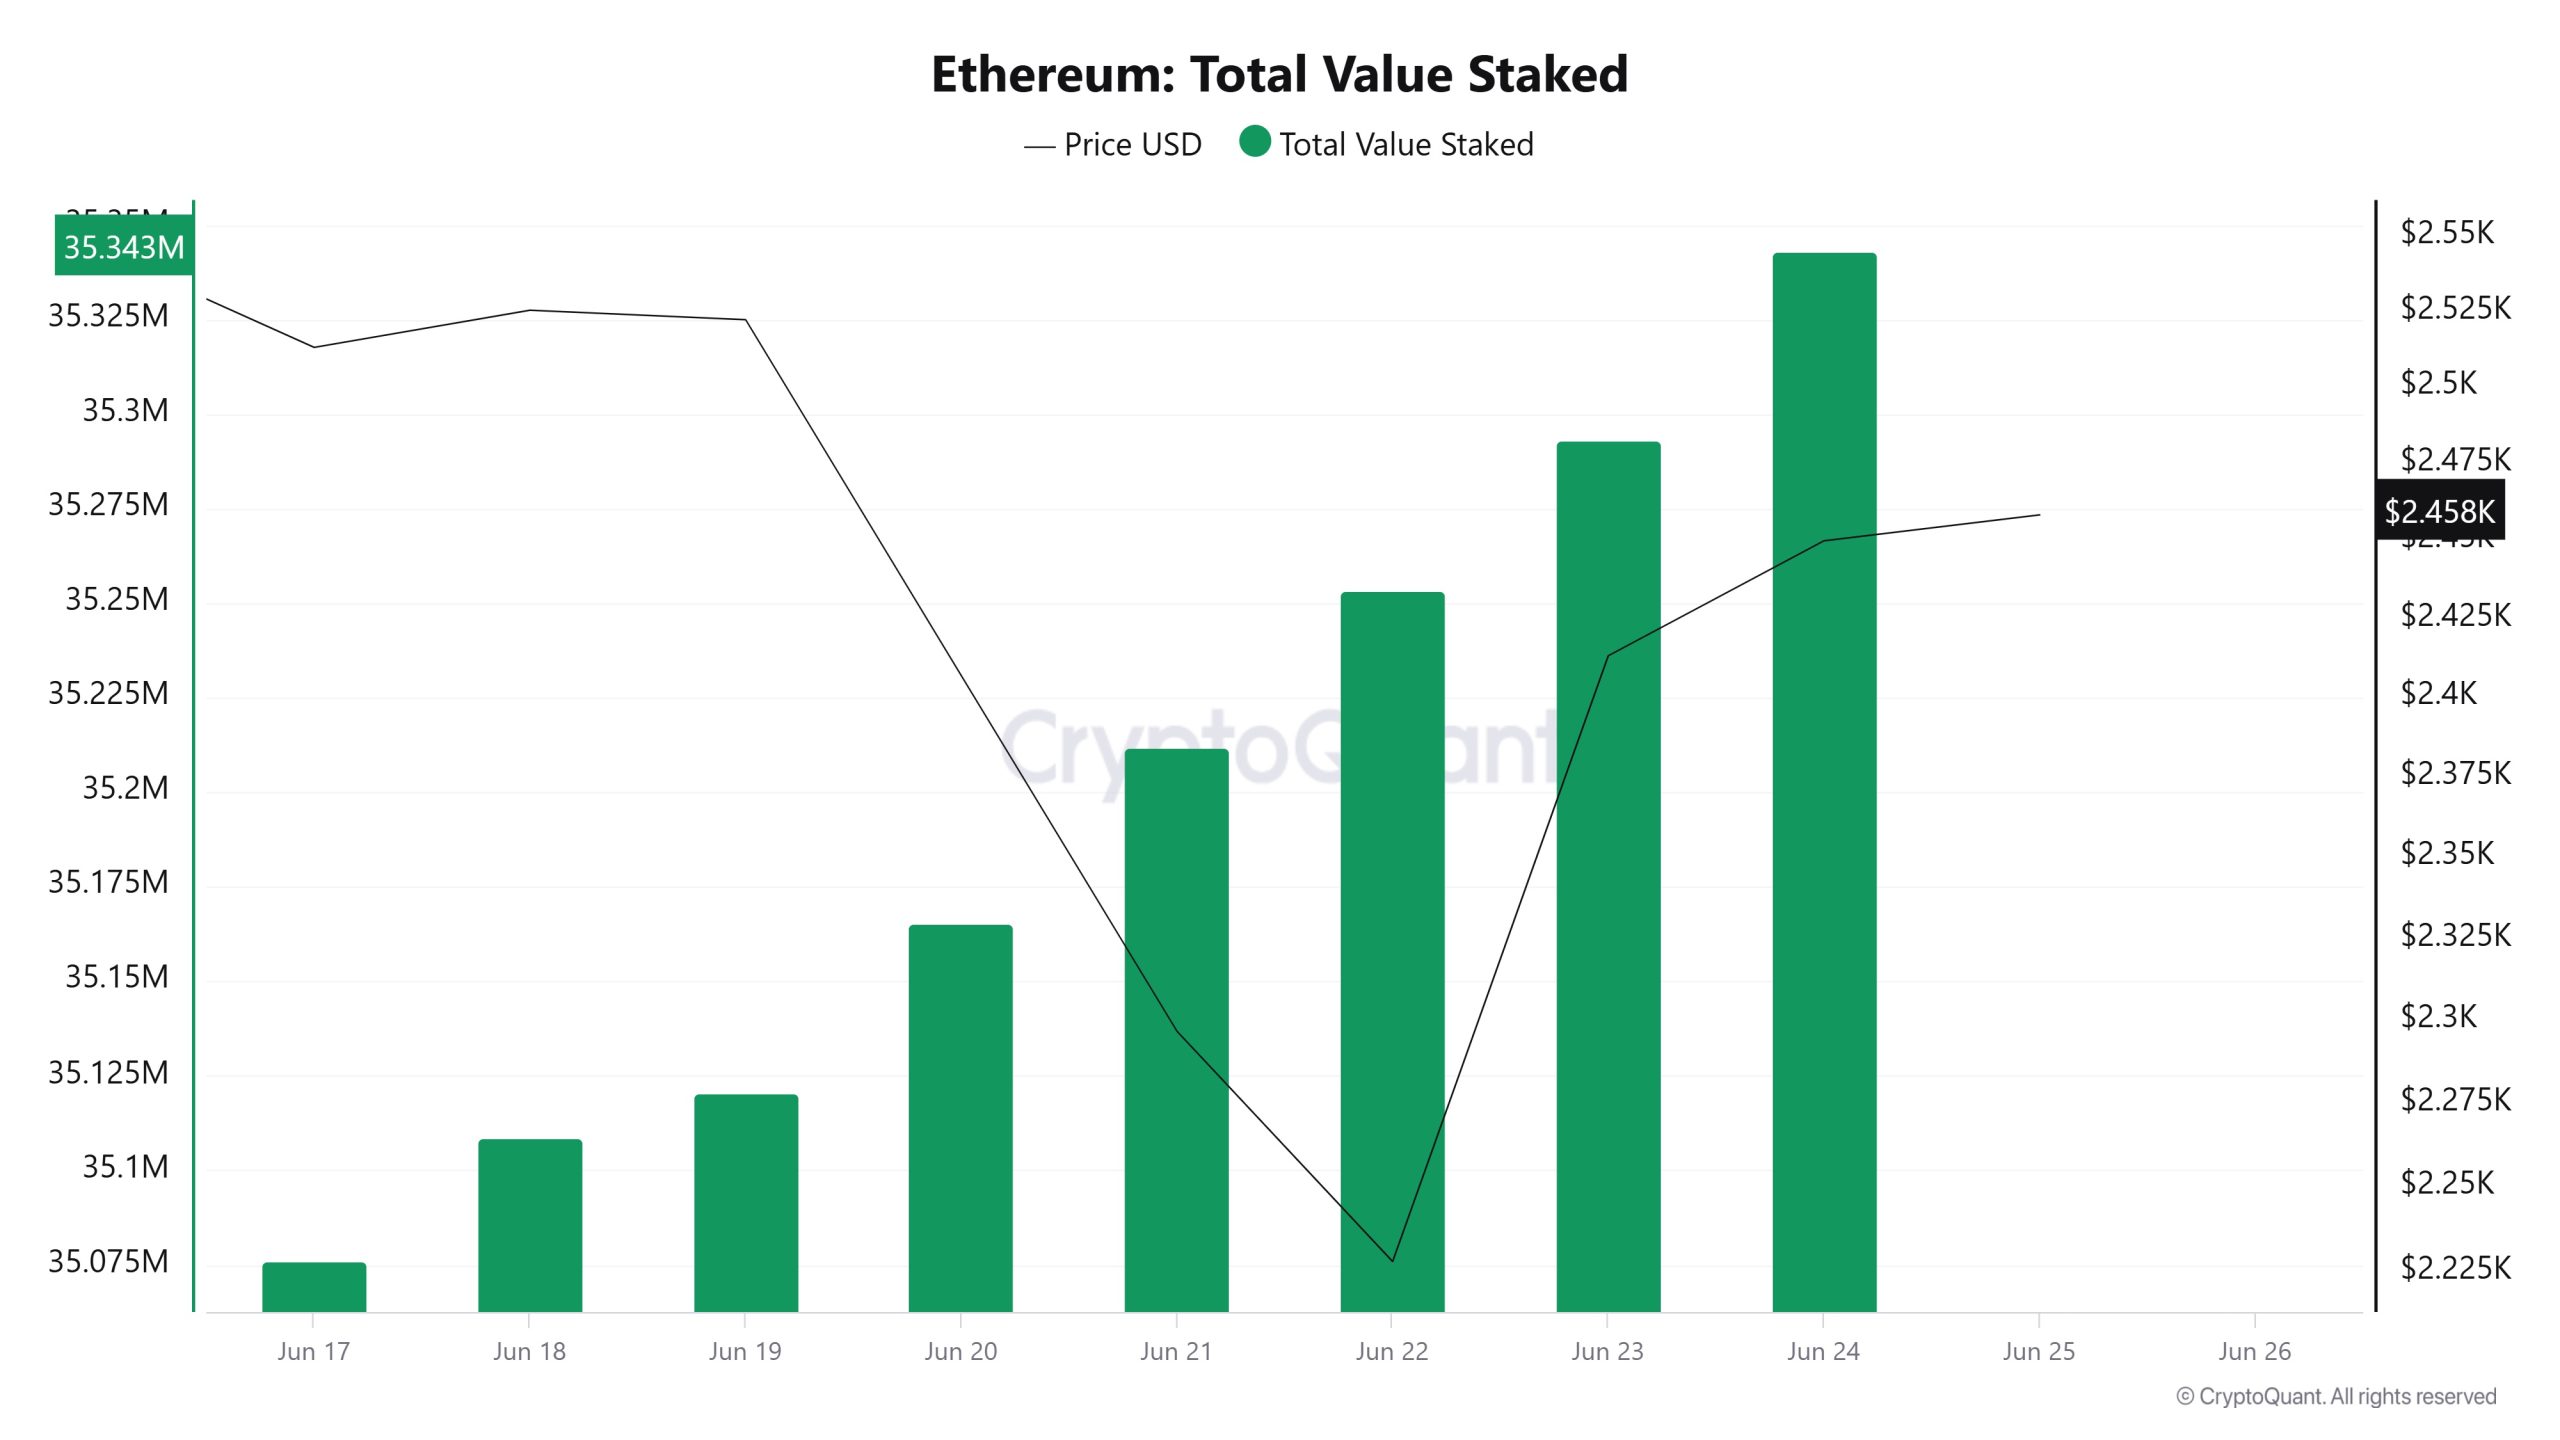
On Haziran 18th, ETH price was at 2,525 while Total Value Staked was at 35,108,708. As of Haziran 24, ETH price fell 3.01% to 2,449, while Total Value Staked increased 0.67% to 35,343,347.
Staking Girişleri
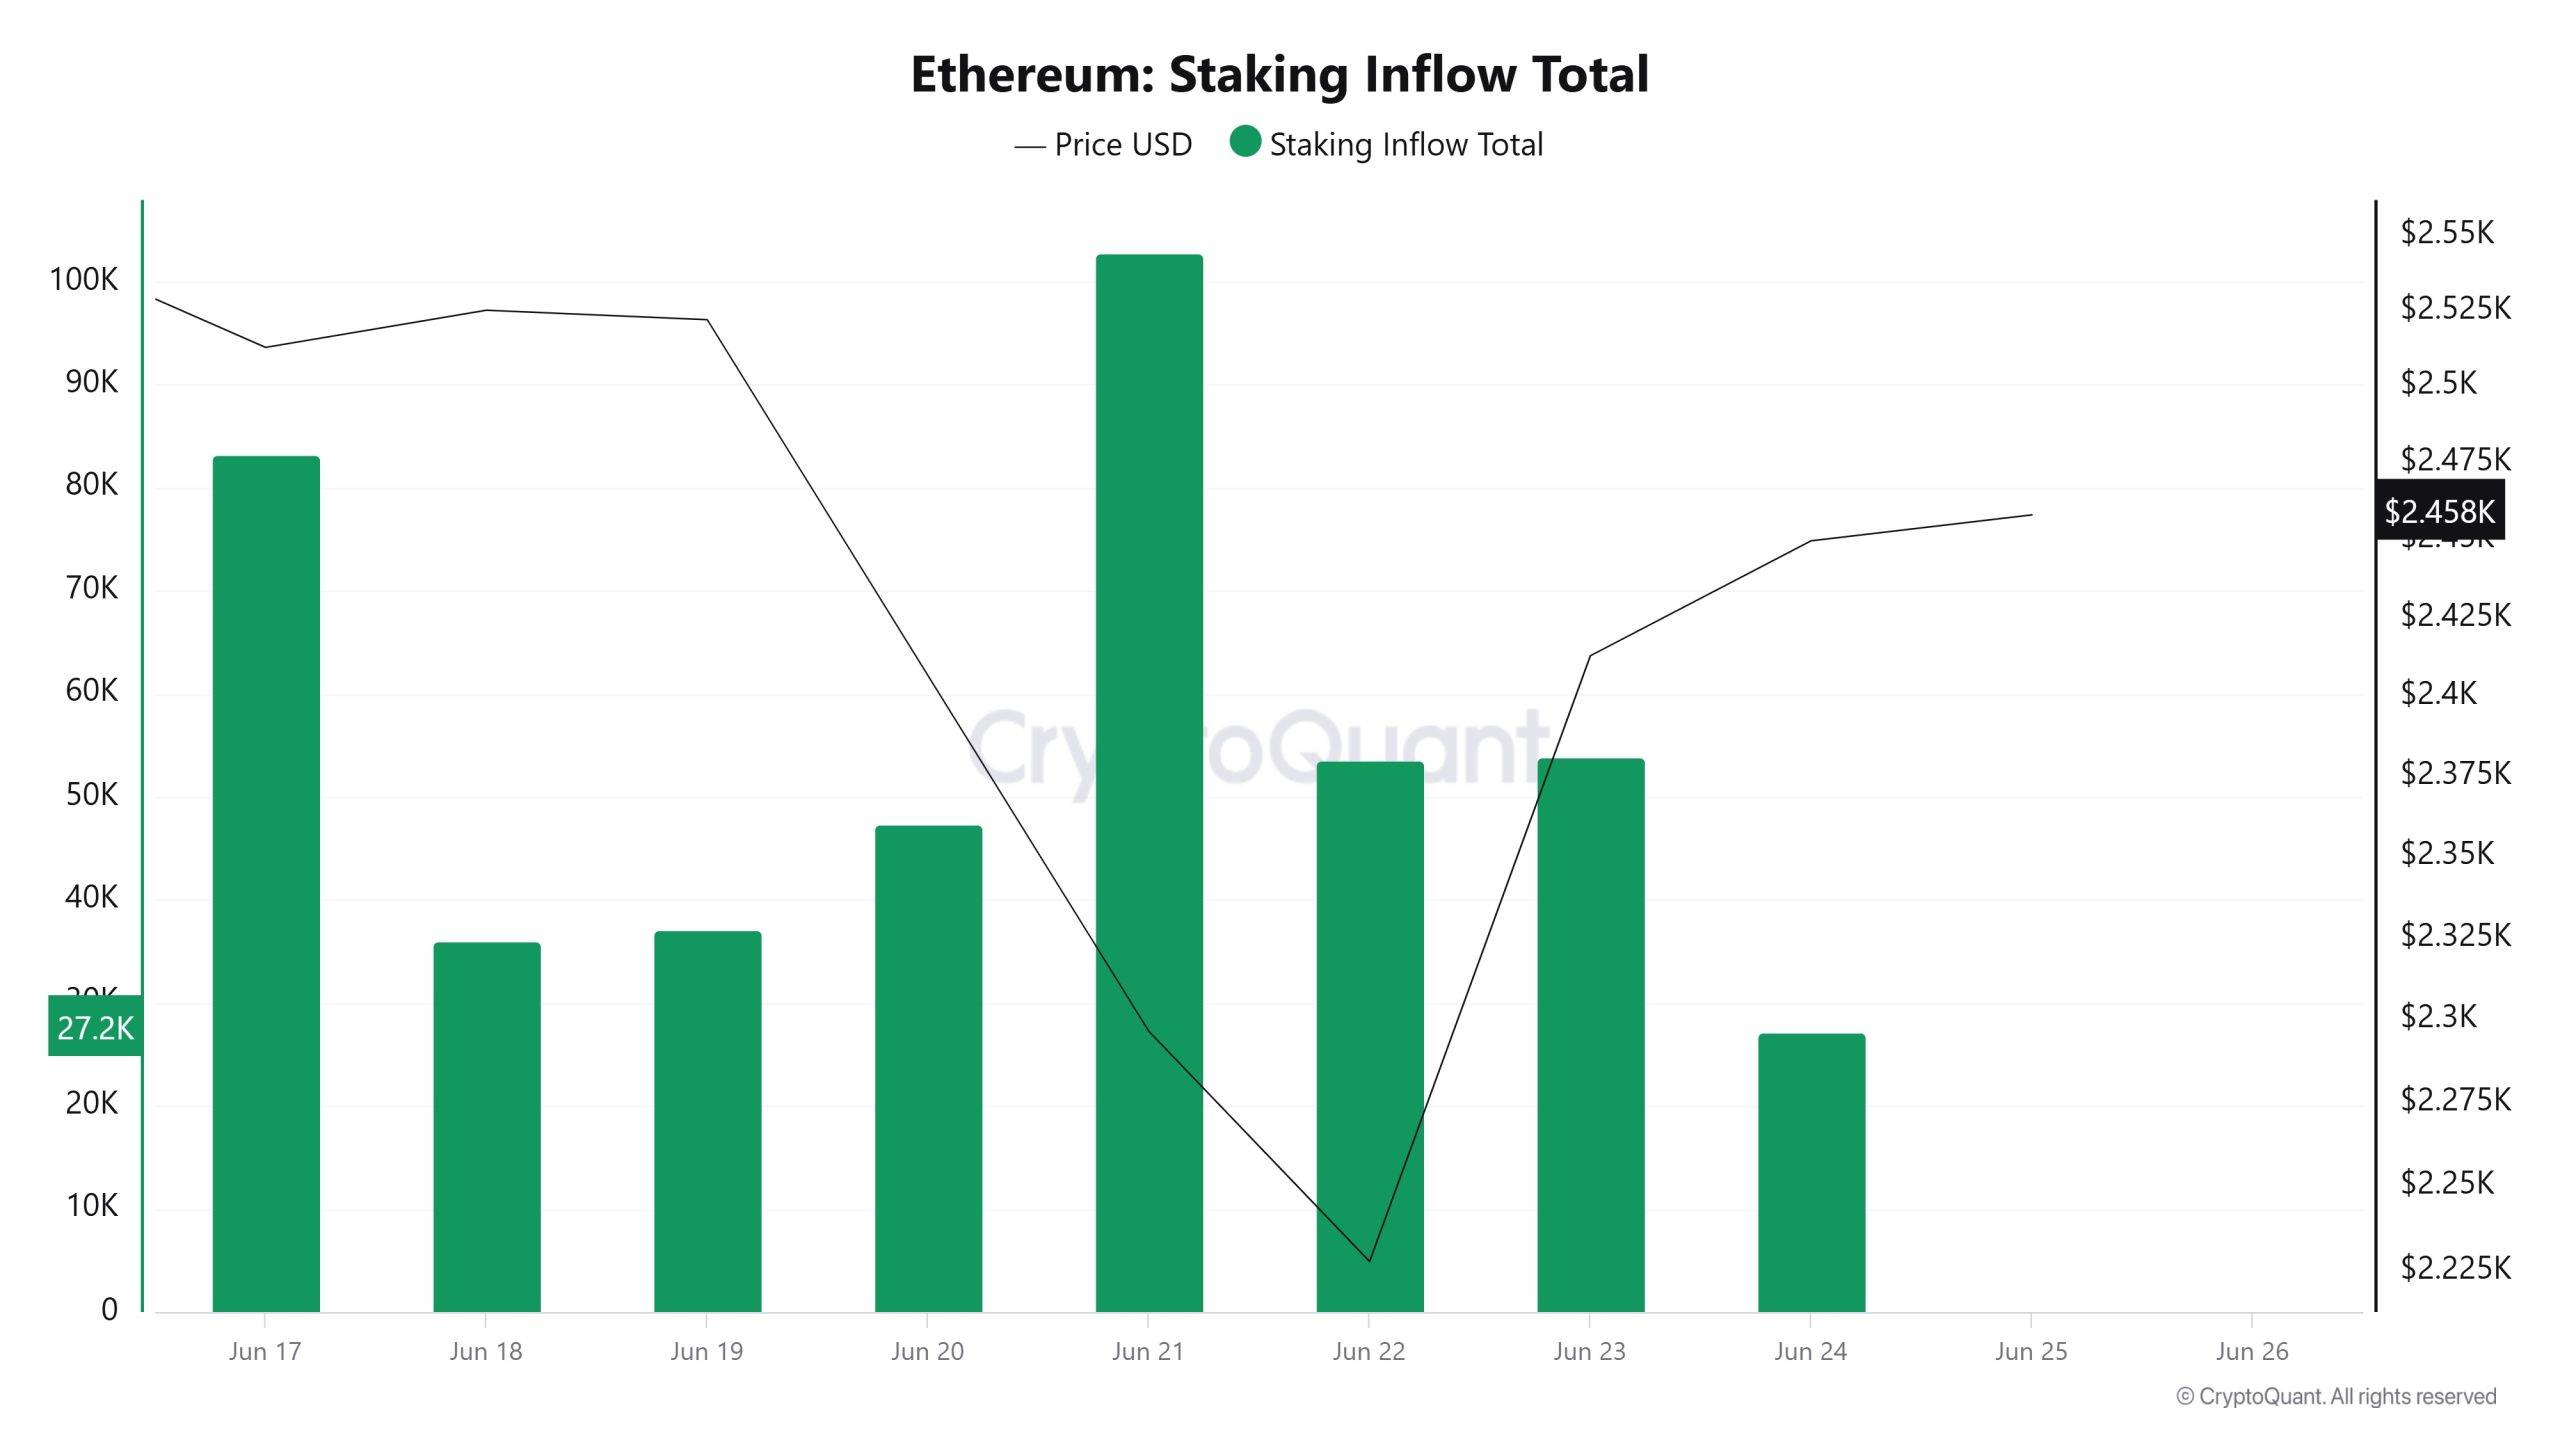
On Haziran 18th, ETH price was at 2,525 while Staking Inflow was 36,091. As of Haziran 24, ETH price fell to 2,449, a decrease of 3.01%, while Staking Inflow fell to 27,254, a decrease of 24.50%.
Türevler
Açık Faiz
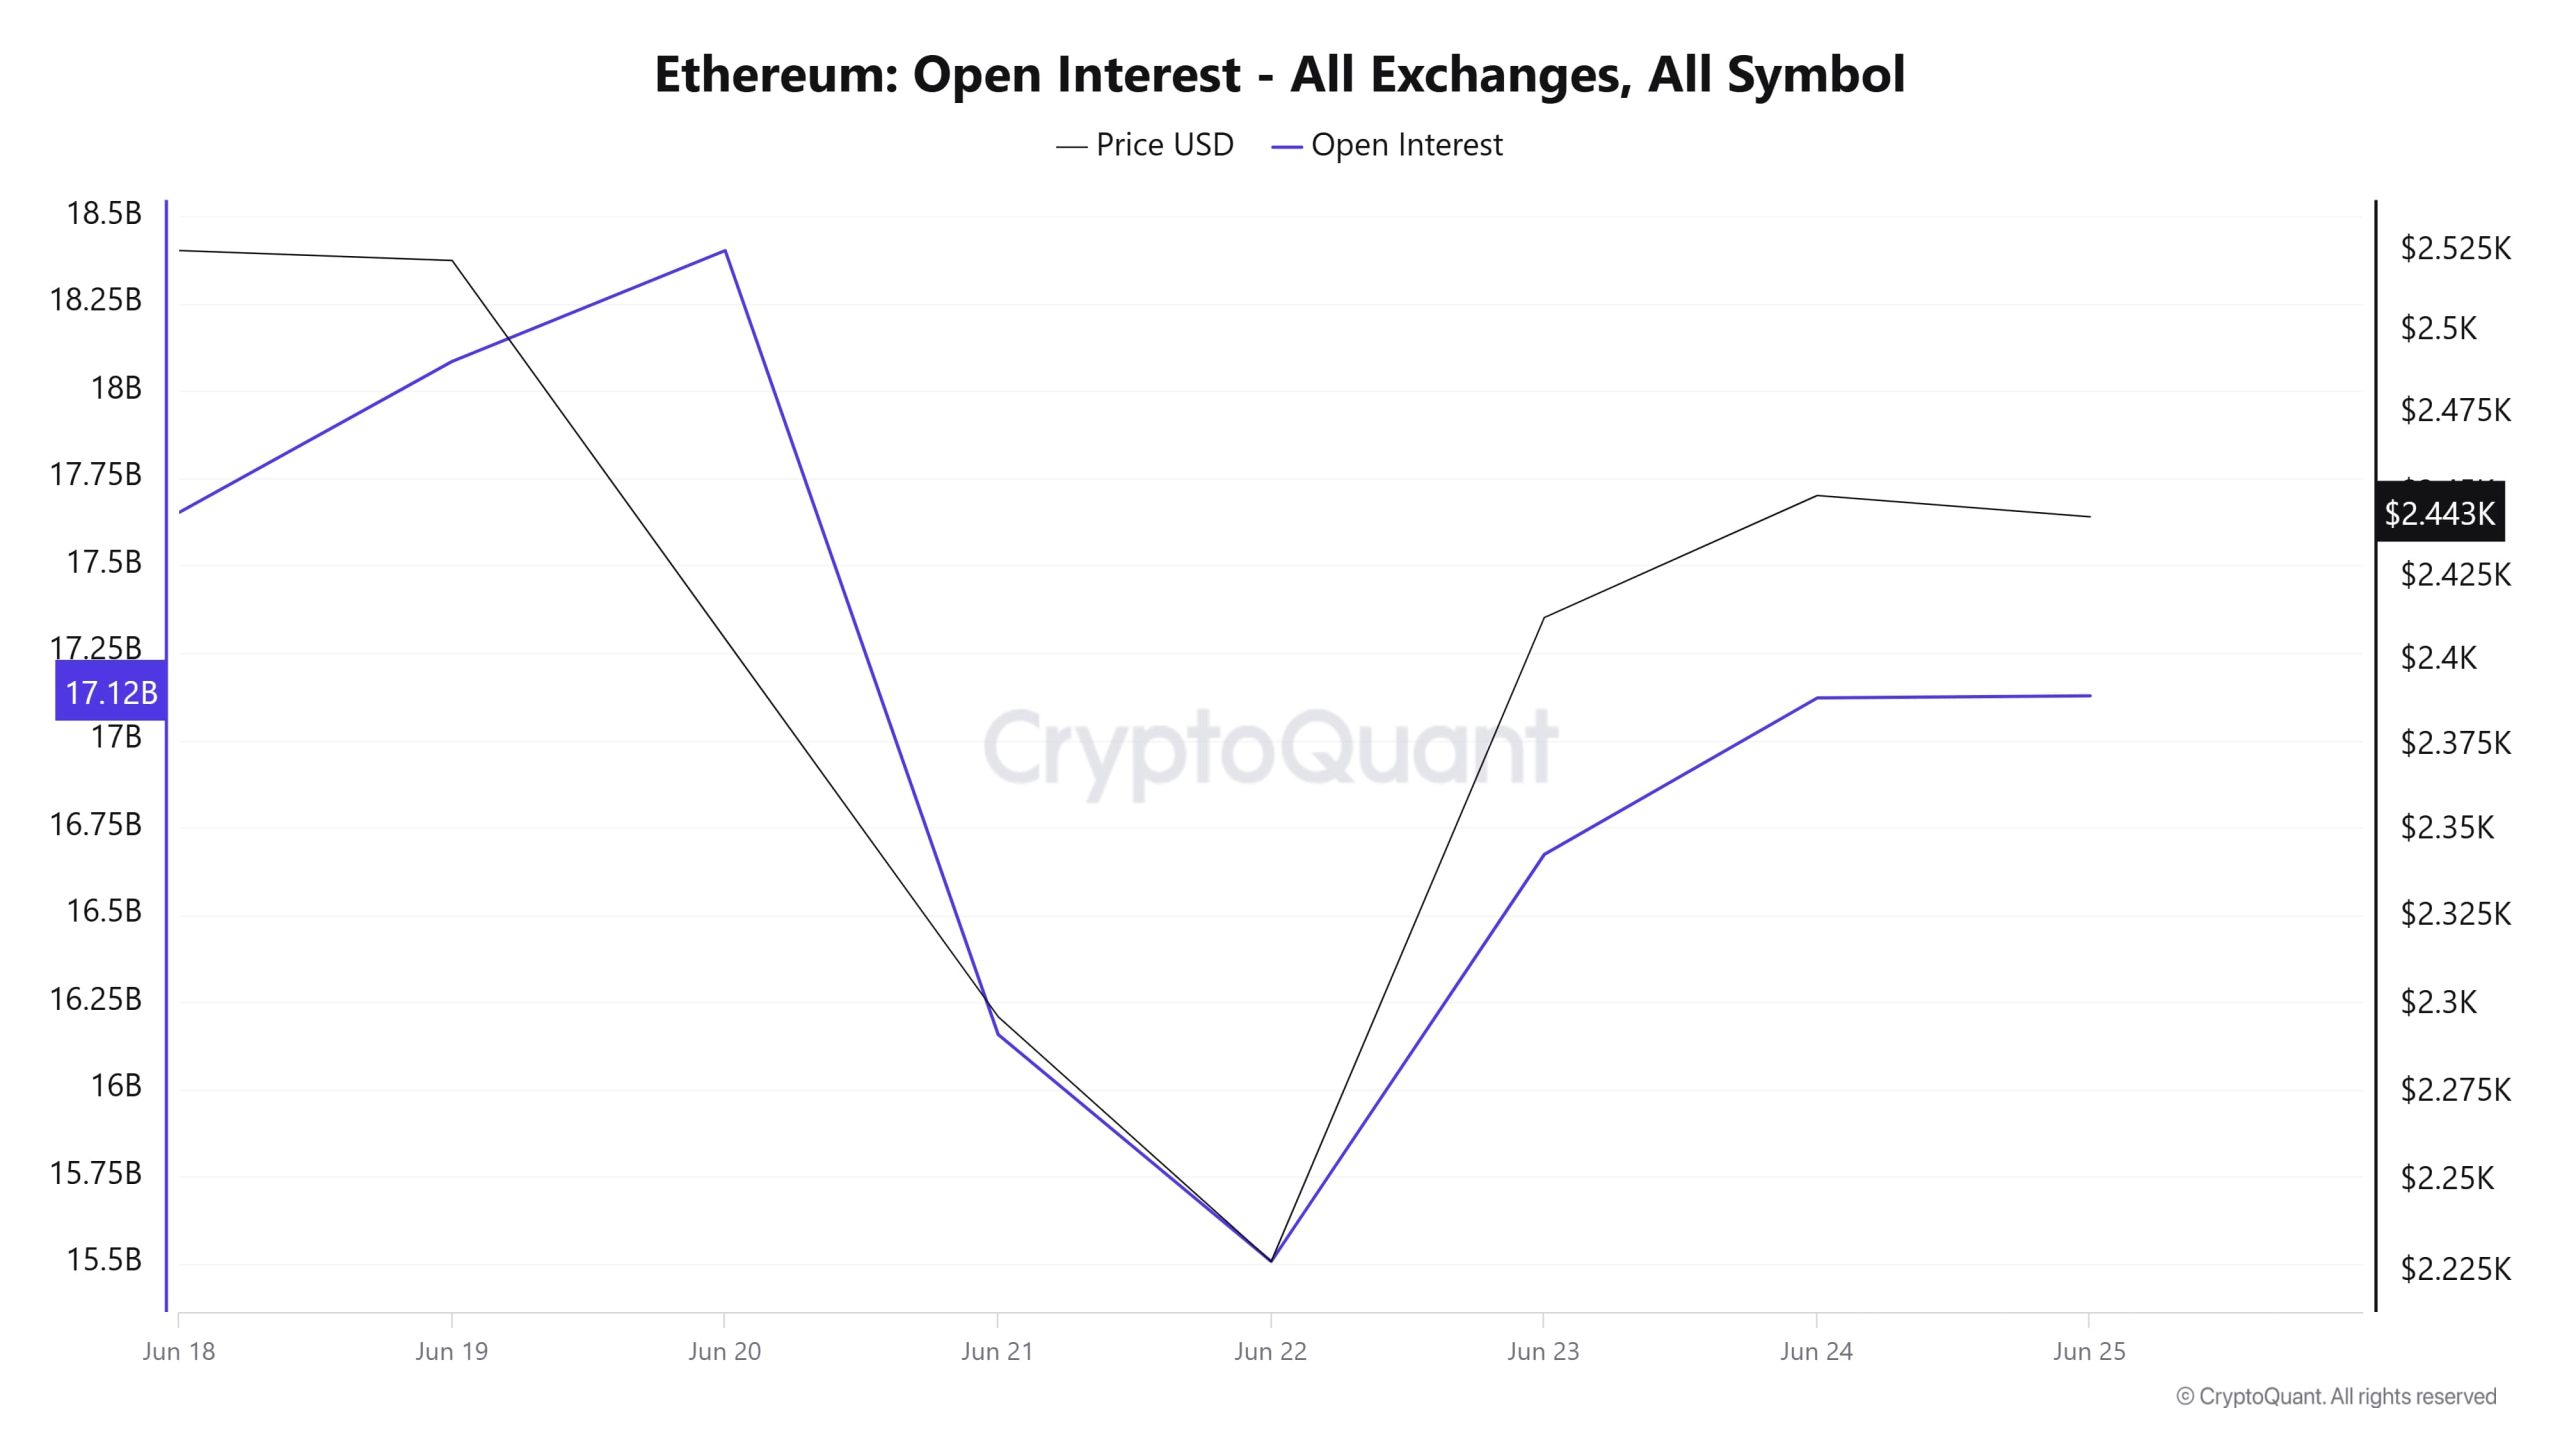
The Ethereum open interest chart from Haziran 18-25 reveals a significant breakout and subsequent recovery in the market, both on the price and position side. While the price maintained its upward momentum until the 20th of the month, open interest also increased in parallel. However, after Haziran 20, both price and open interest decline sharply. This indicates heavy liquidations, especially in leveraged positions. Around Haziran 22, both price and open interest hit a bottom and then started to recover again. This recovery is not sudden, but rather gradual, indicating that new market entries are being made more cautiously.
Fonlama Oranı
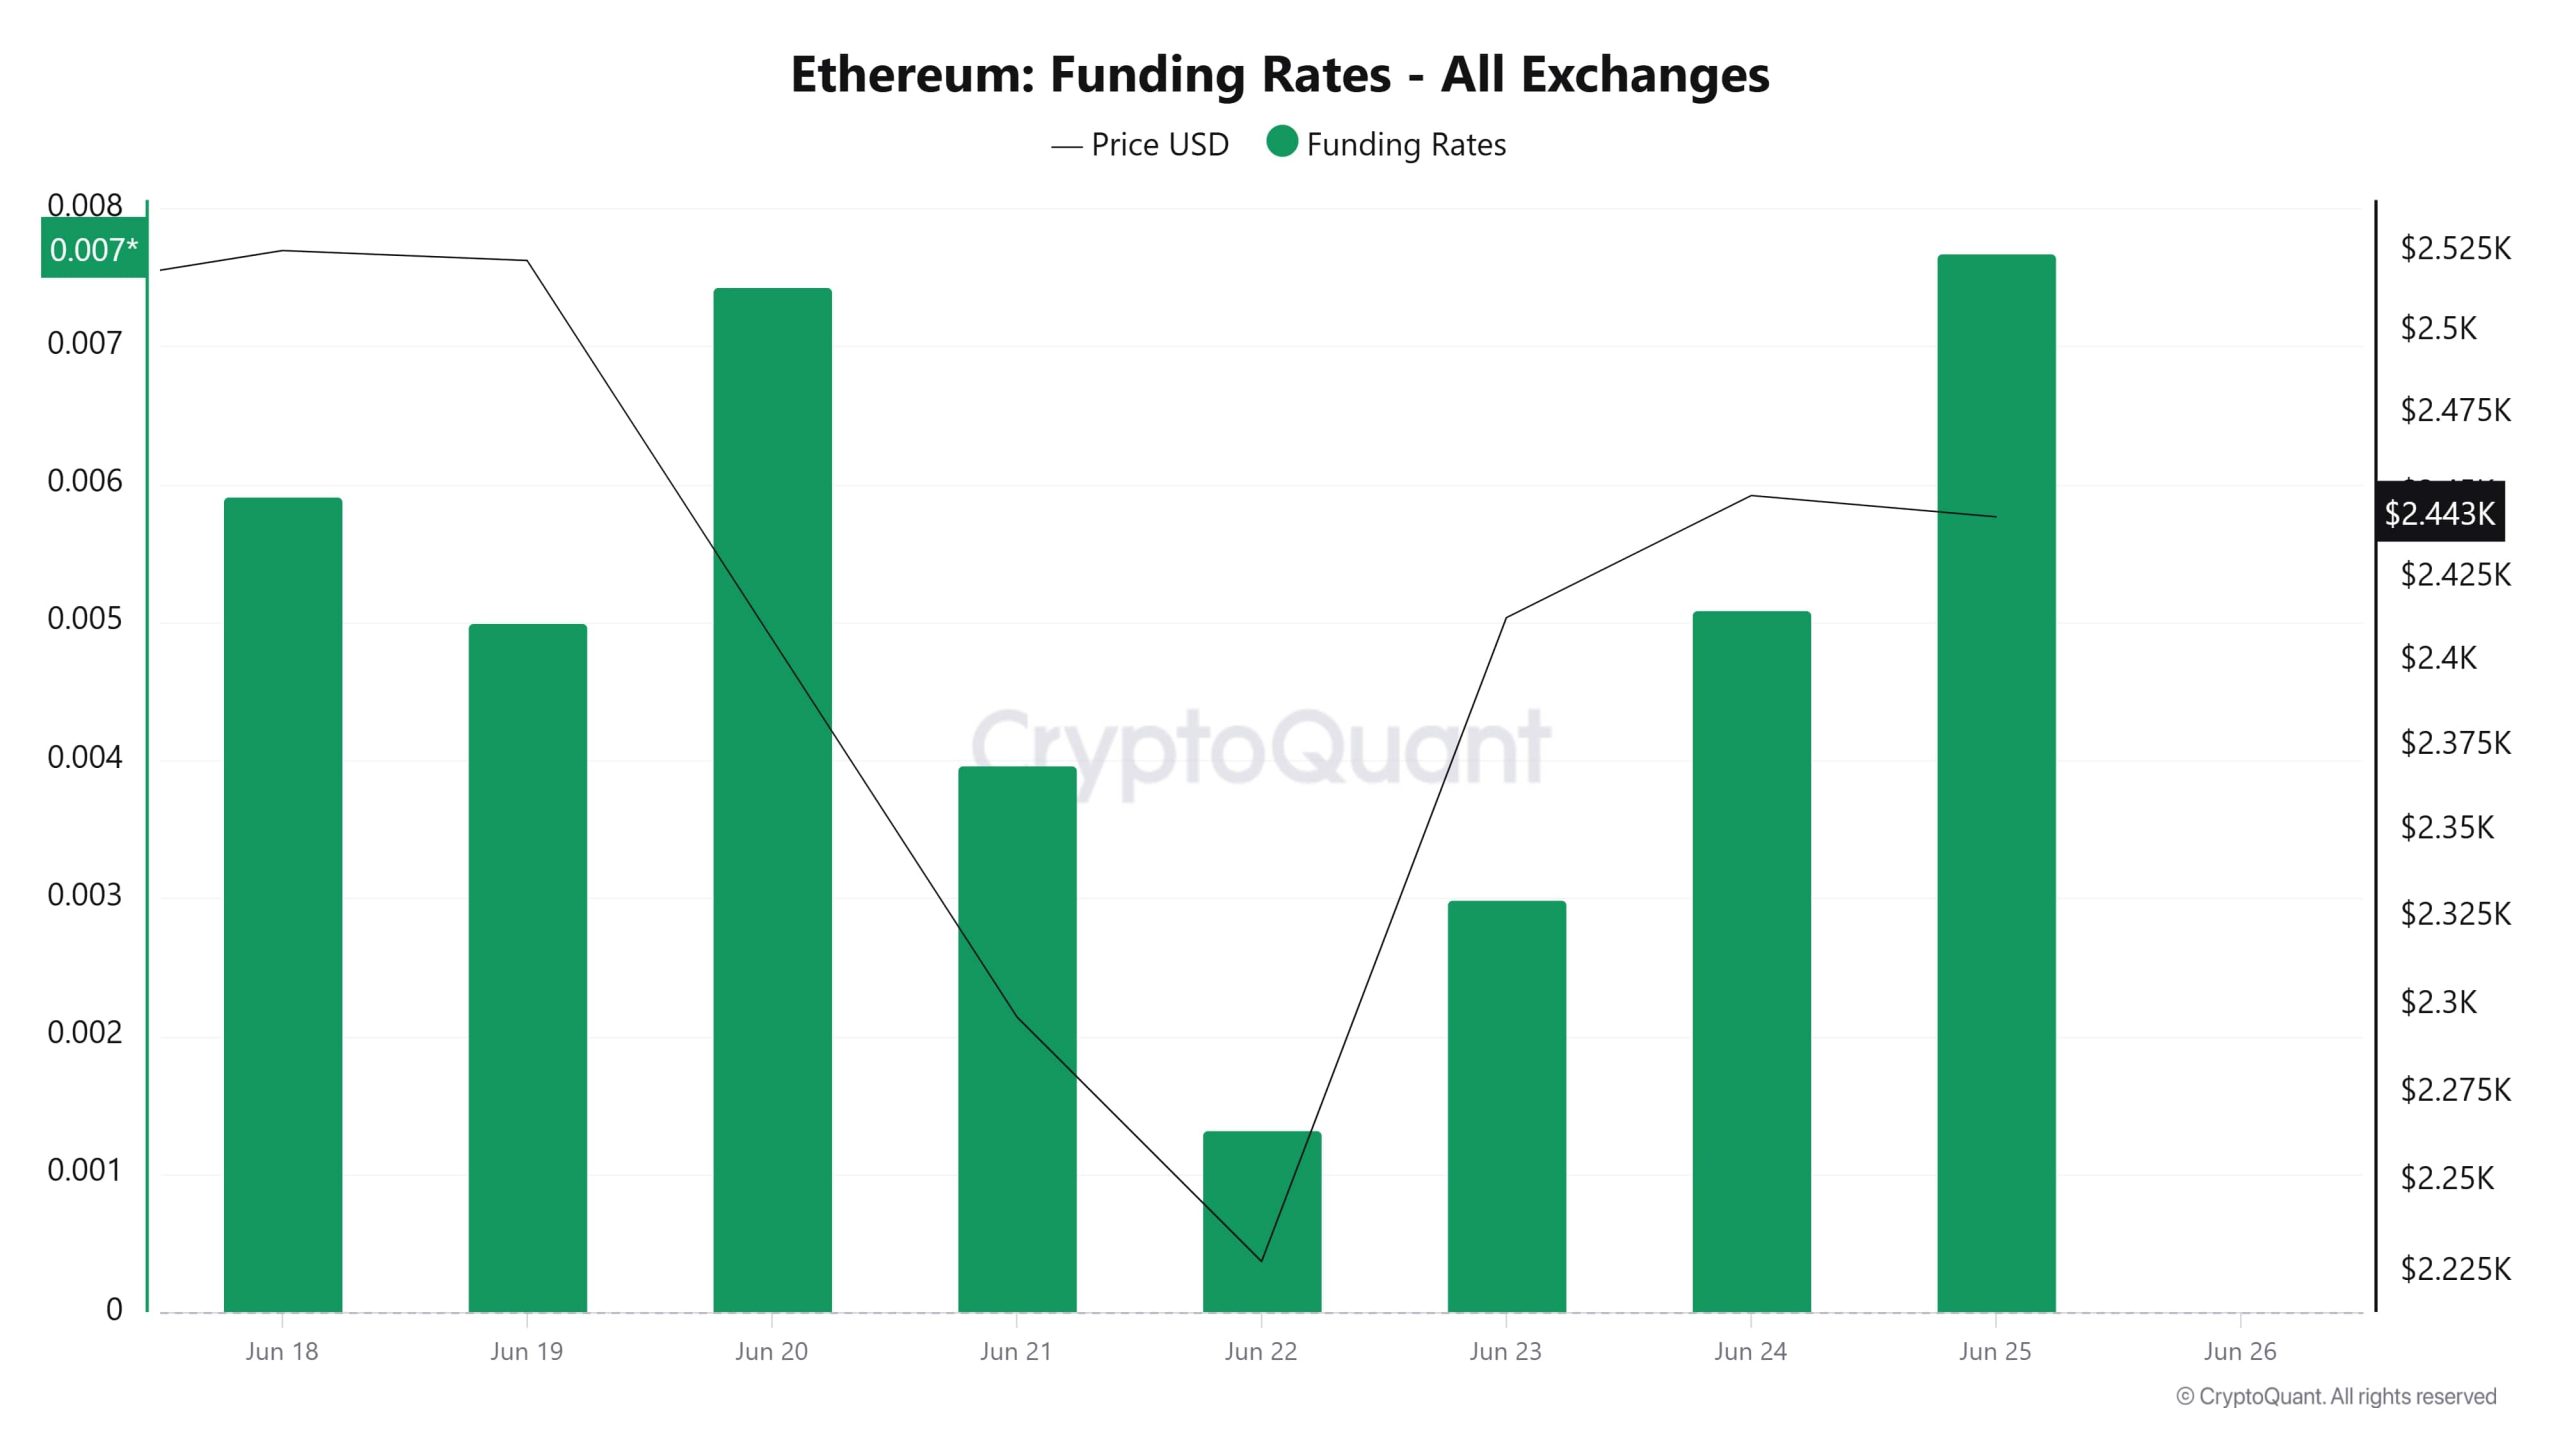
The Ethereum funding rate chart for Haziran 18-25 gives clear signals about the short-term sentiment of the market. While the rates were on the positive side at the beginning of the period, they peaked on Haziran 20 with the price. However, with the sharp price decline that followed, the funding rate also declined rapidly, reaching almost zero on Haziran 22. At this point, heavy liquidations in long positions seem to be effective. Afterwards, both the price and the funding rate recovered; especially on Haziran 25, the funding rate reached its previous highs again. This shows that after the decline, long trades regained their weight, and the market started to regain its risk appetite.
Uzun ve Kısa Tasfiyeler
In this week of confrontation between Iran and Israel and the US’s involvement in the conflict and its attacks on Iran’s nuclear facilities, about 1.5 billion dollars worth of long and 376 million dollars worth of short transactions were liquidated.
| Tarih | Uzun Tutar (Milyon $) | Kısa Tutar (Milyon $) |
|---|---|---|
| Haziran 18 | 63.52 | 46.56 |
| Haziran 19 | 18.28 | 13.83 |
| Haziran 20 | 125.63 | 29.62 |
| Haziran 21 | 249.64 | 23.74 |
| Haziran 22 | 874.26 | 74.25 |
| 23 Haziran | 50.28 | 149.18 |
| Haziran 24 | 134.68 | 38.97 |
| Toplam | 1516.29 | 376.15 |
Tedarik Dağıtımı
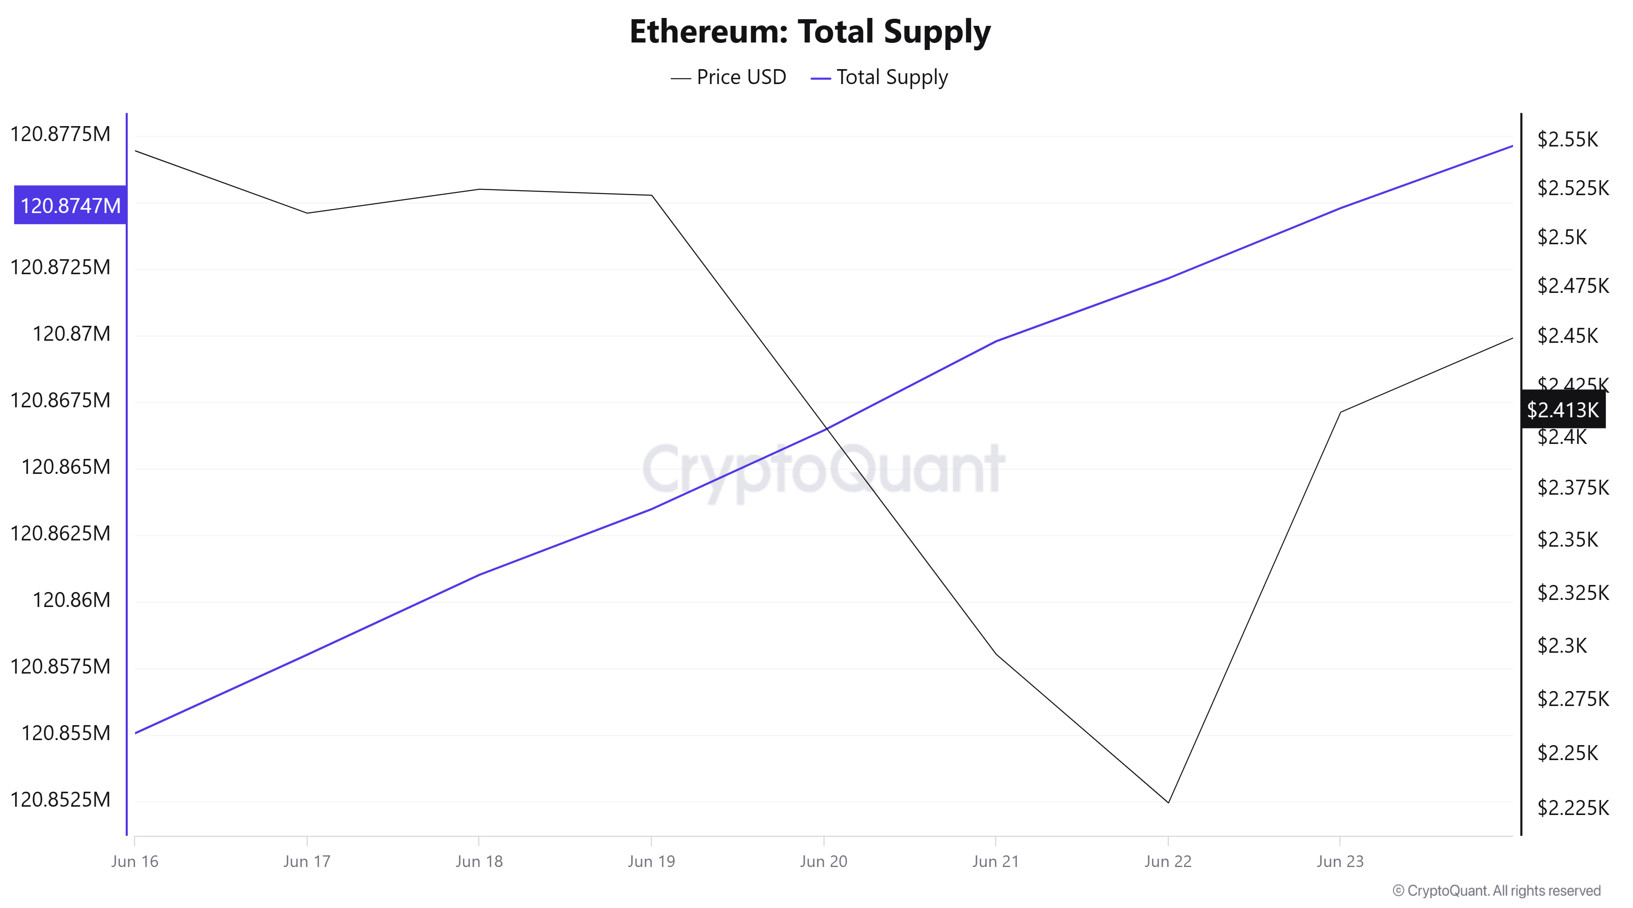
Total Supply: reached 122,874,790 units, up about 0.0163% from last week.
New Supply: The amount of ETH produced this week was 19,722.
Velocity: Velocity was 8.42 as of Haziran 23, down from 8.35 last week.
| Cüzdan Kategorisi | 16.06.2025 | 23.06.2025 | Değişim (%) |
|---|---|---|---|
| 100 - 1k ETH | 9.1329M | 9.0967M | -0.40% |
| 1k - 10k ETH | 13.6089M | 13.5439M | -0.48% |
| 10k - 100k ETH | 16.9157M | 16.8646M | -0.30% |
| 100k+ ETH | 4.3916M | 4.1547M | -5.39% |
According to the latest weekly data, a limited decrease of -0.40% was observed in 100 – 1k ETH wallets. Wallets in the 1k – 10k ETH range experienced a similarly gradual decrease of -0.48%. The 10k – 100k ETH segment showed a slight decline of -0.30%, while 100k+ ETH wallets recorded a notable drop of -5.39%.
Döviz Rezervi
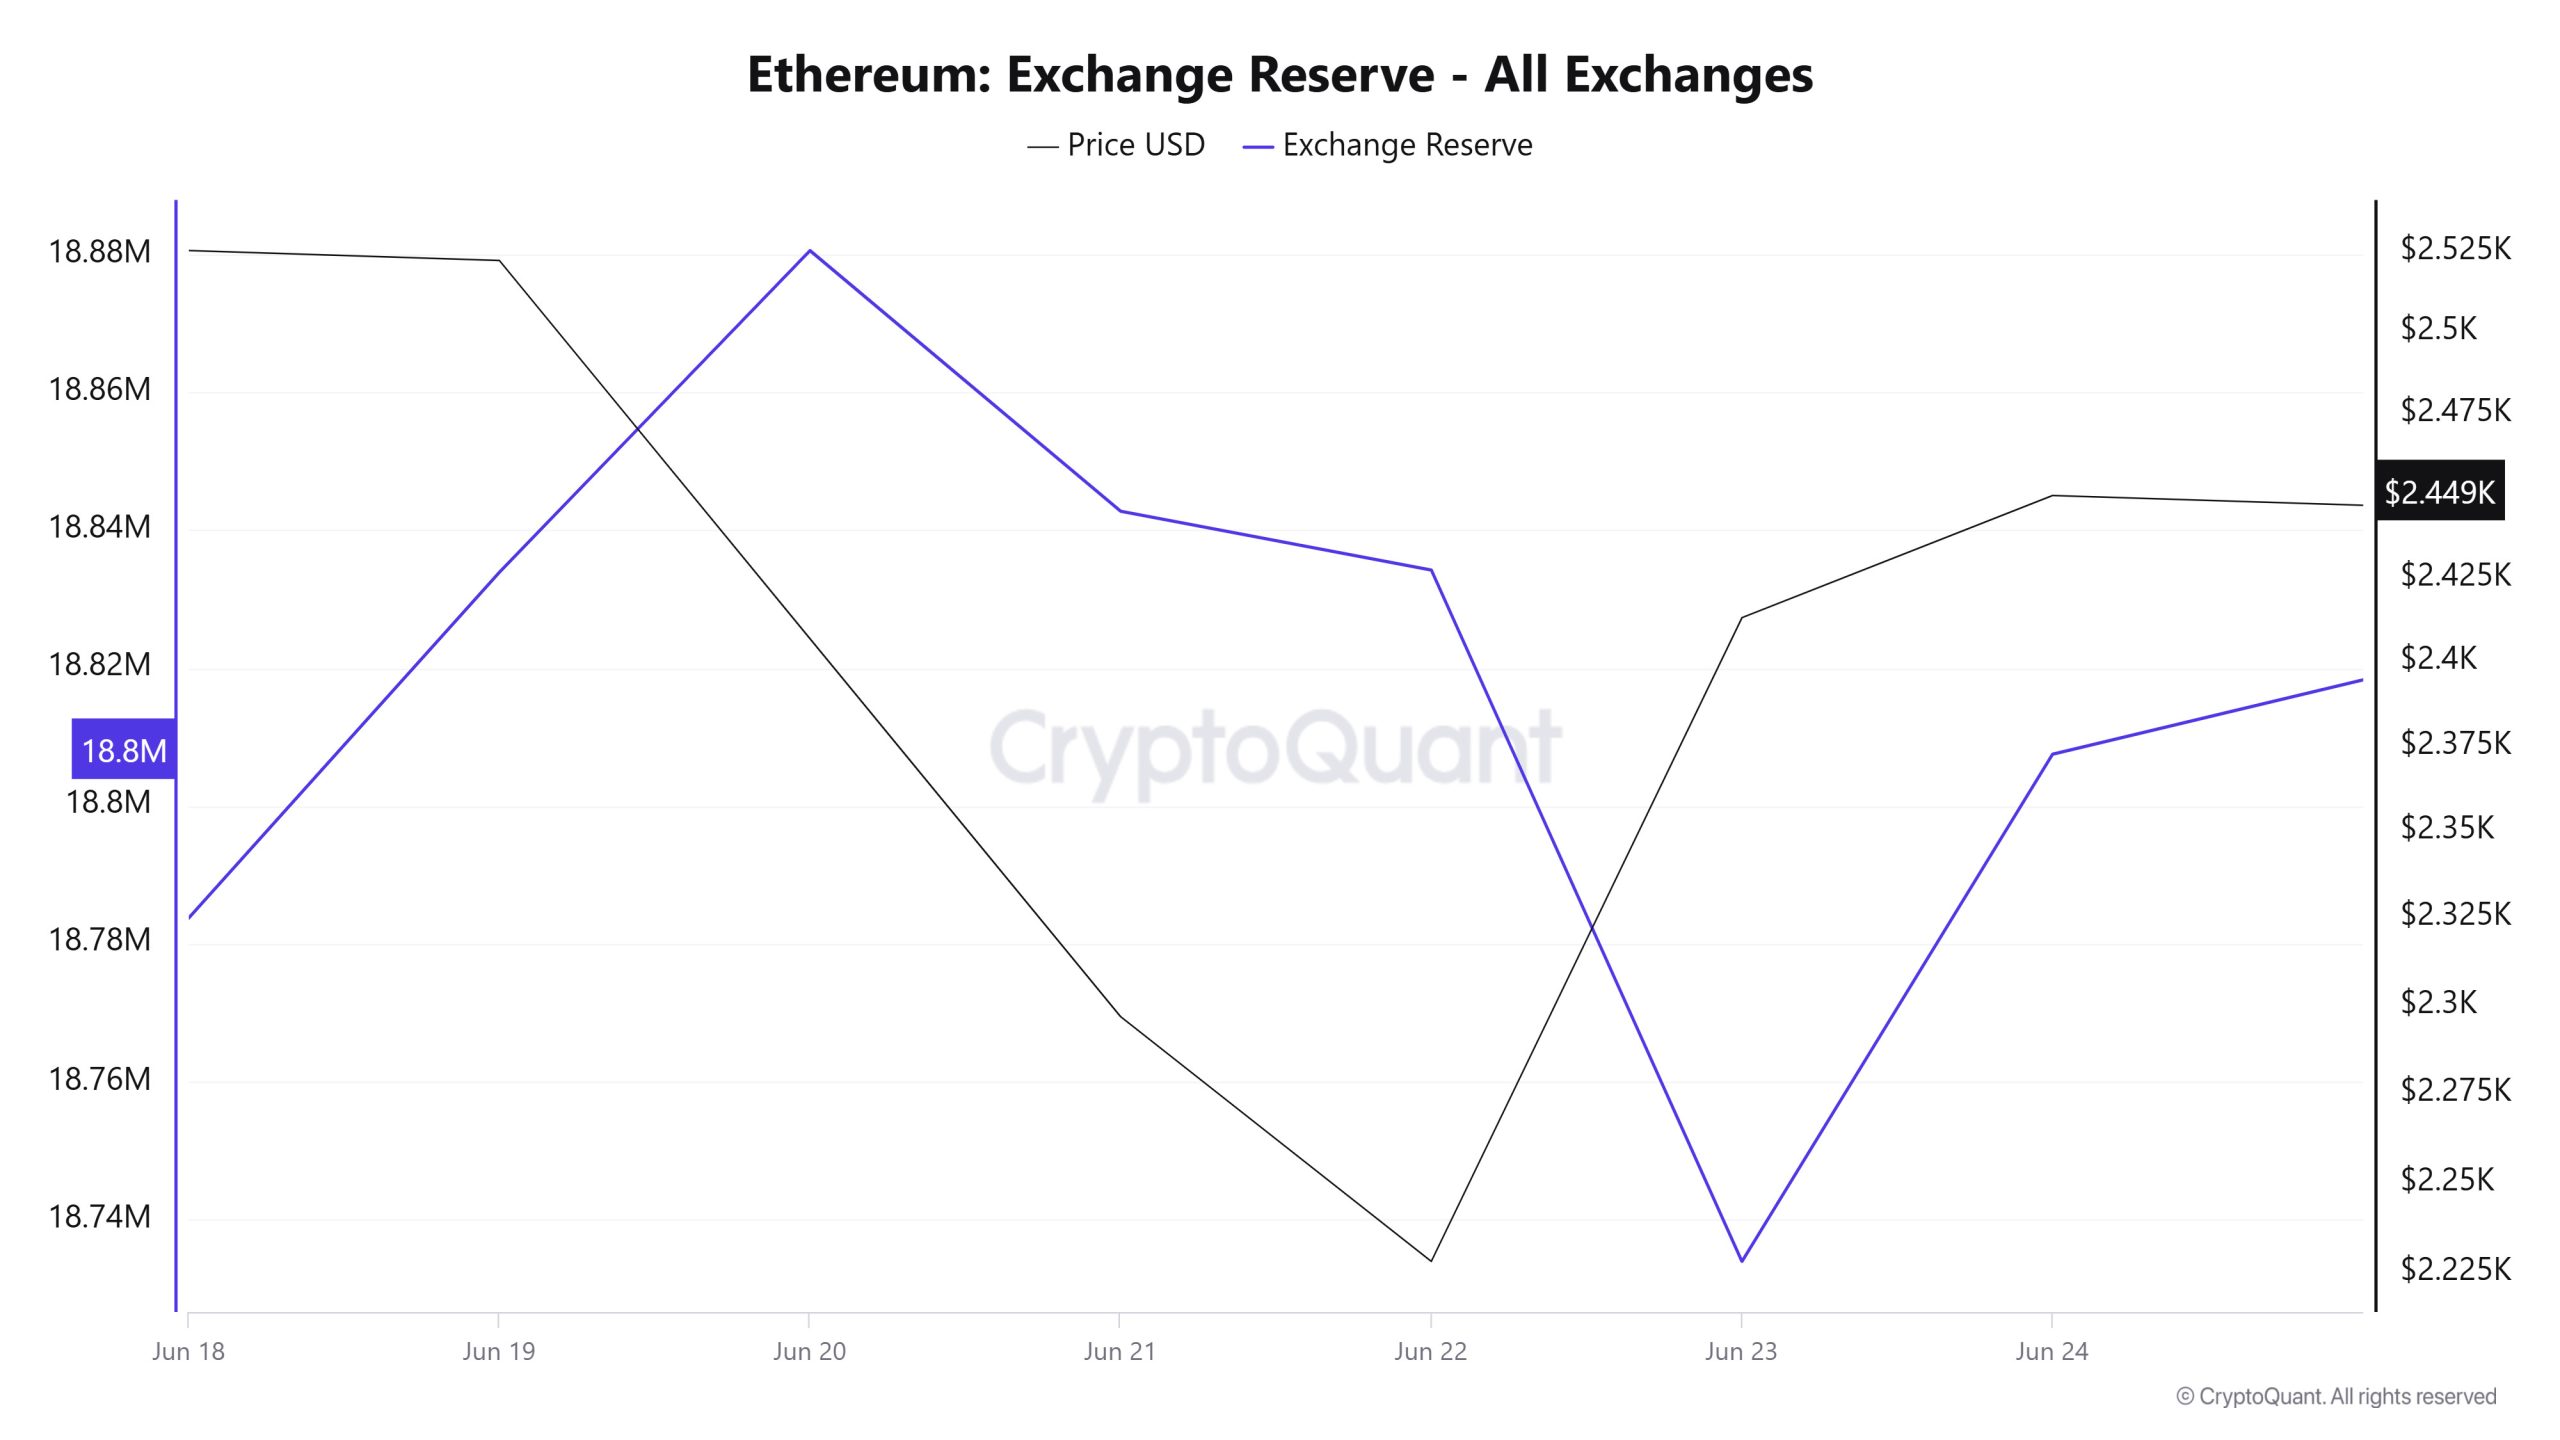
Between Haziran 18-24, 2025, Ethereum reserves on exchanges increased from 18,783,757 ETH to 18,807,504 ETH. During this period, there was a total net inflow of 23,747 ETH and the Ethereum reserves of exchanges increased by 0.13%. The Ethereum price, on the other hand, fell from $2,525 to $2,450 during the same period, depreciating by about 3%. While the inflow in the stock markets indicates that a selling trend may occur in the short term, the decline in the price indicates a weakening in market perception. Selling pressure may continue in the short term.
| Tarih | Borsa Girişi | Döviz Çıkışı | Exchange Netflow | Döviz Rezervi | ETH Fiyat |
|---|---|---|---|---|---|
| 18-Jun | 870,644 | 834,110 | 36,533 | 18,783,757 | 2,525 |
| 19-Jun | 492,288 | 442,139 | 50,149 | 18,833,906 | 2,522 |
| 20-Jun | 1,255,342 | 1,208,673 | 46,668 | 18,880,573 | 2,407 |
| 21-Jun | 451,237 | 489,047 | -37,810 | 18,842,764 | 2,297 |
| 22-Jun | 793,612 | 802,158 | -8,547 | 18,834,217 | 2,228 |
| 23-Jun | 1,063,314 | 1,163,609 | -100,295 | 18,733,922 | 2,413 |
| 24-Jun | 1,110,711 | 1,037,129 | 73,582 | 18,807,504 | 2,450 |
Ücretler ve Gelirler
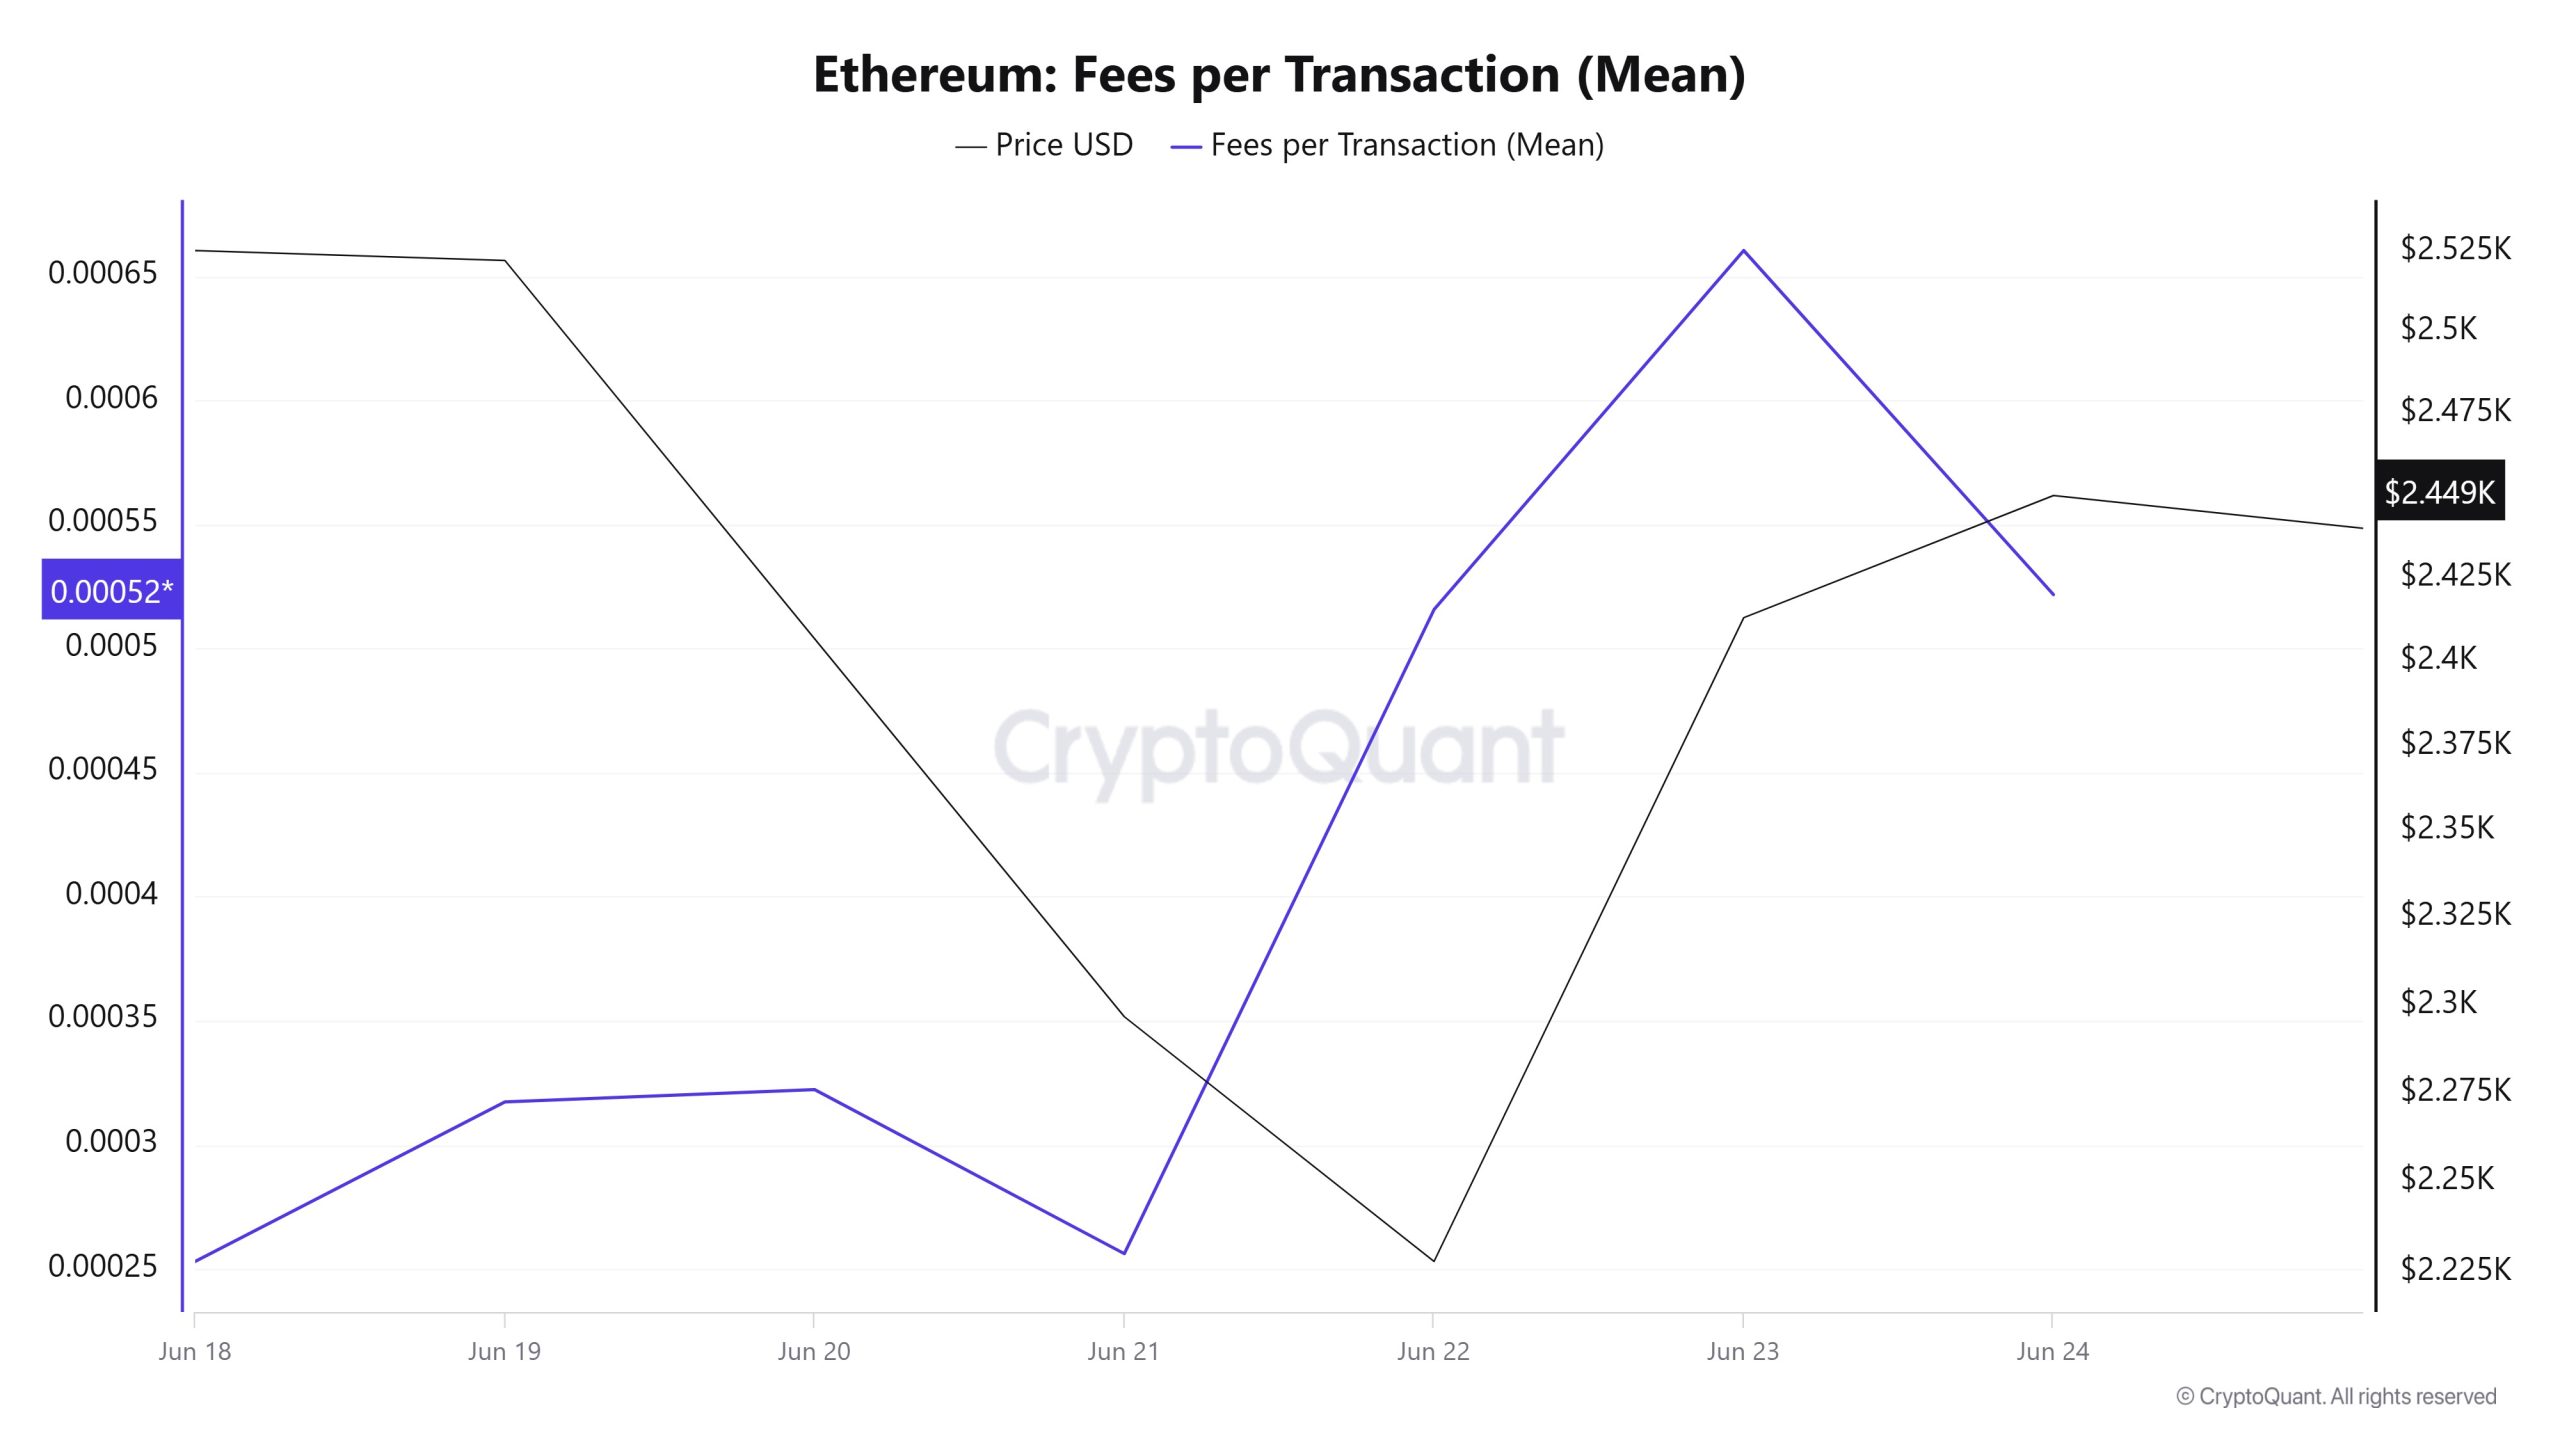
When the Ethereum Fees per Transaction (Mean) data between Haziran 18 and Haziran 24 are analyzed, it is seen that this value was realized at 0.00025302661890073 on Haziran 18, the first day of the week.
Following this, a horizontal trend was observed in the indicator, and as of Haziran 21, it fell to 0.000256168710775691, recording the lowest value of the week.
After that, Ethereum Fees per Transaction (Mean) resumed its upward trend and closed at 0.000521677761571229 on Haziran 24, the last day of the week.
Bitcoin: Ücretler (Toplam)
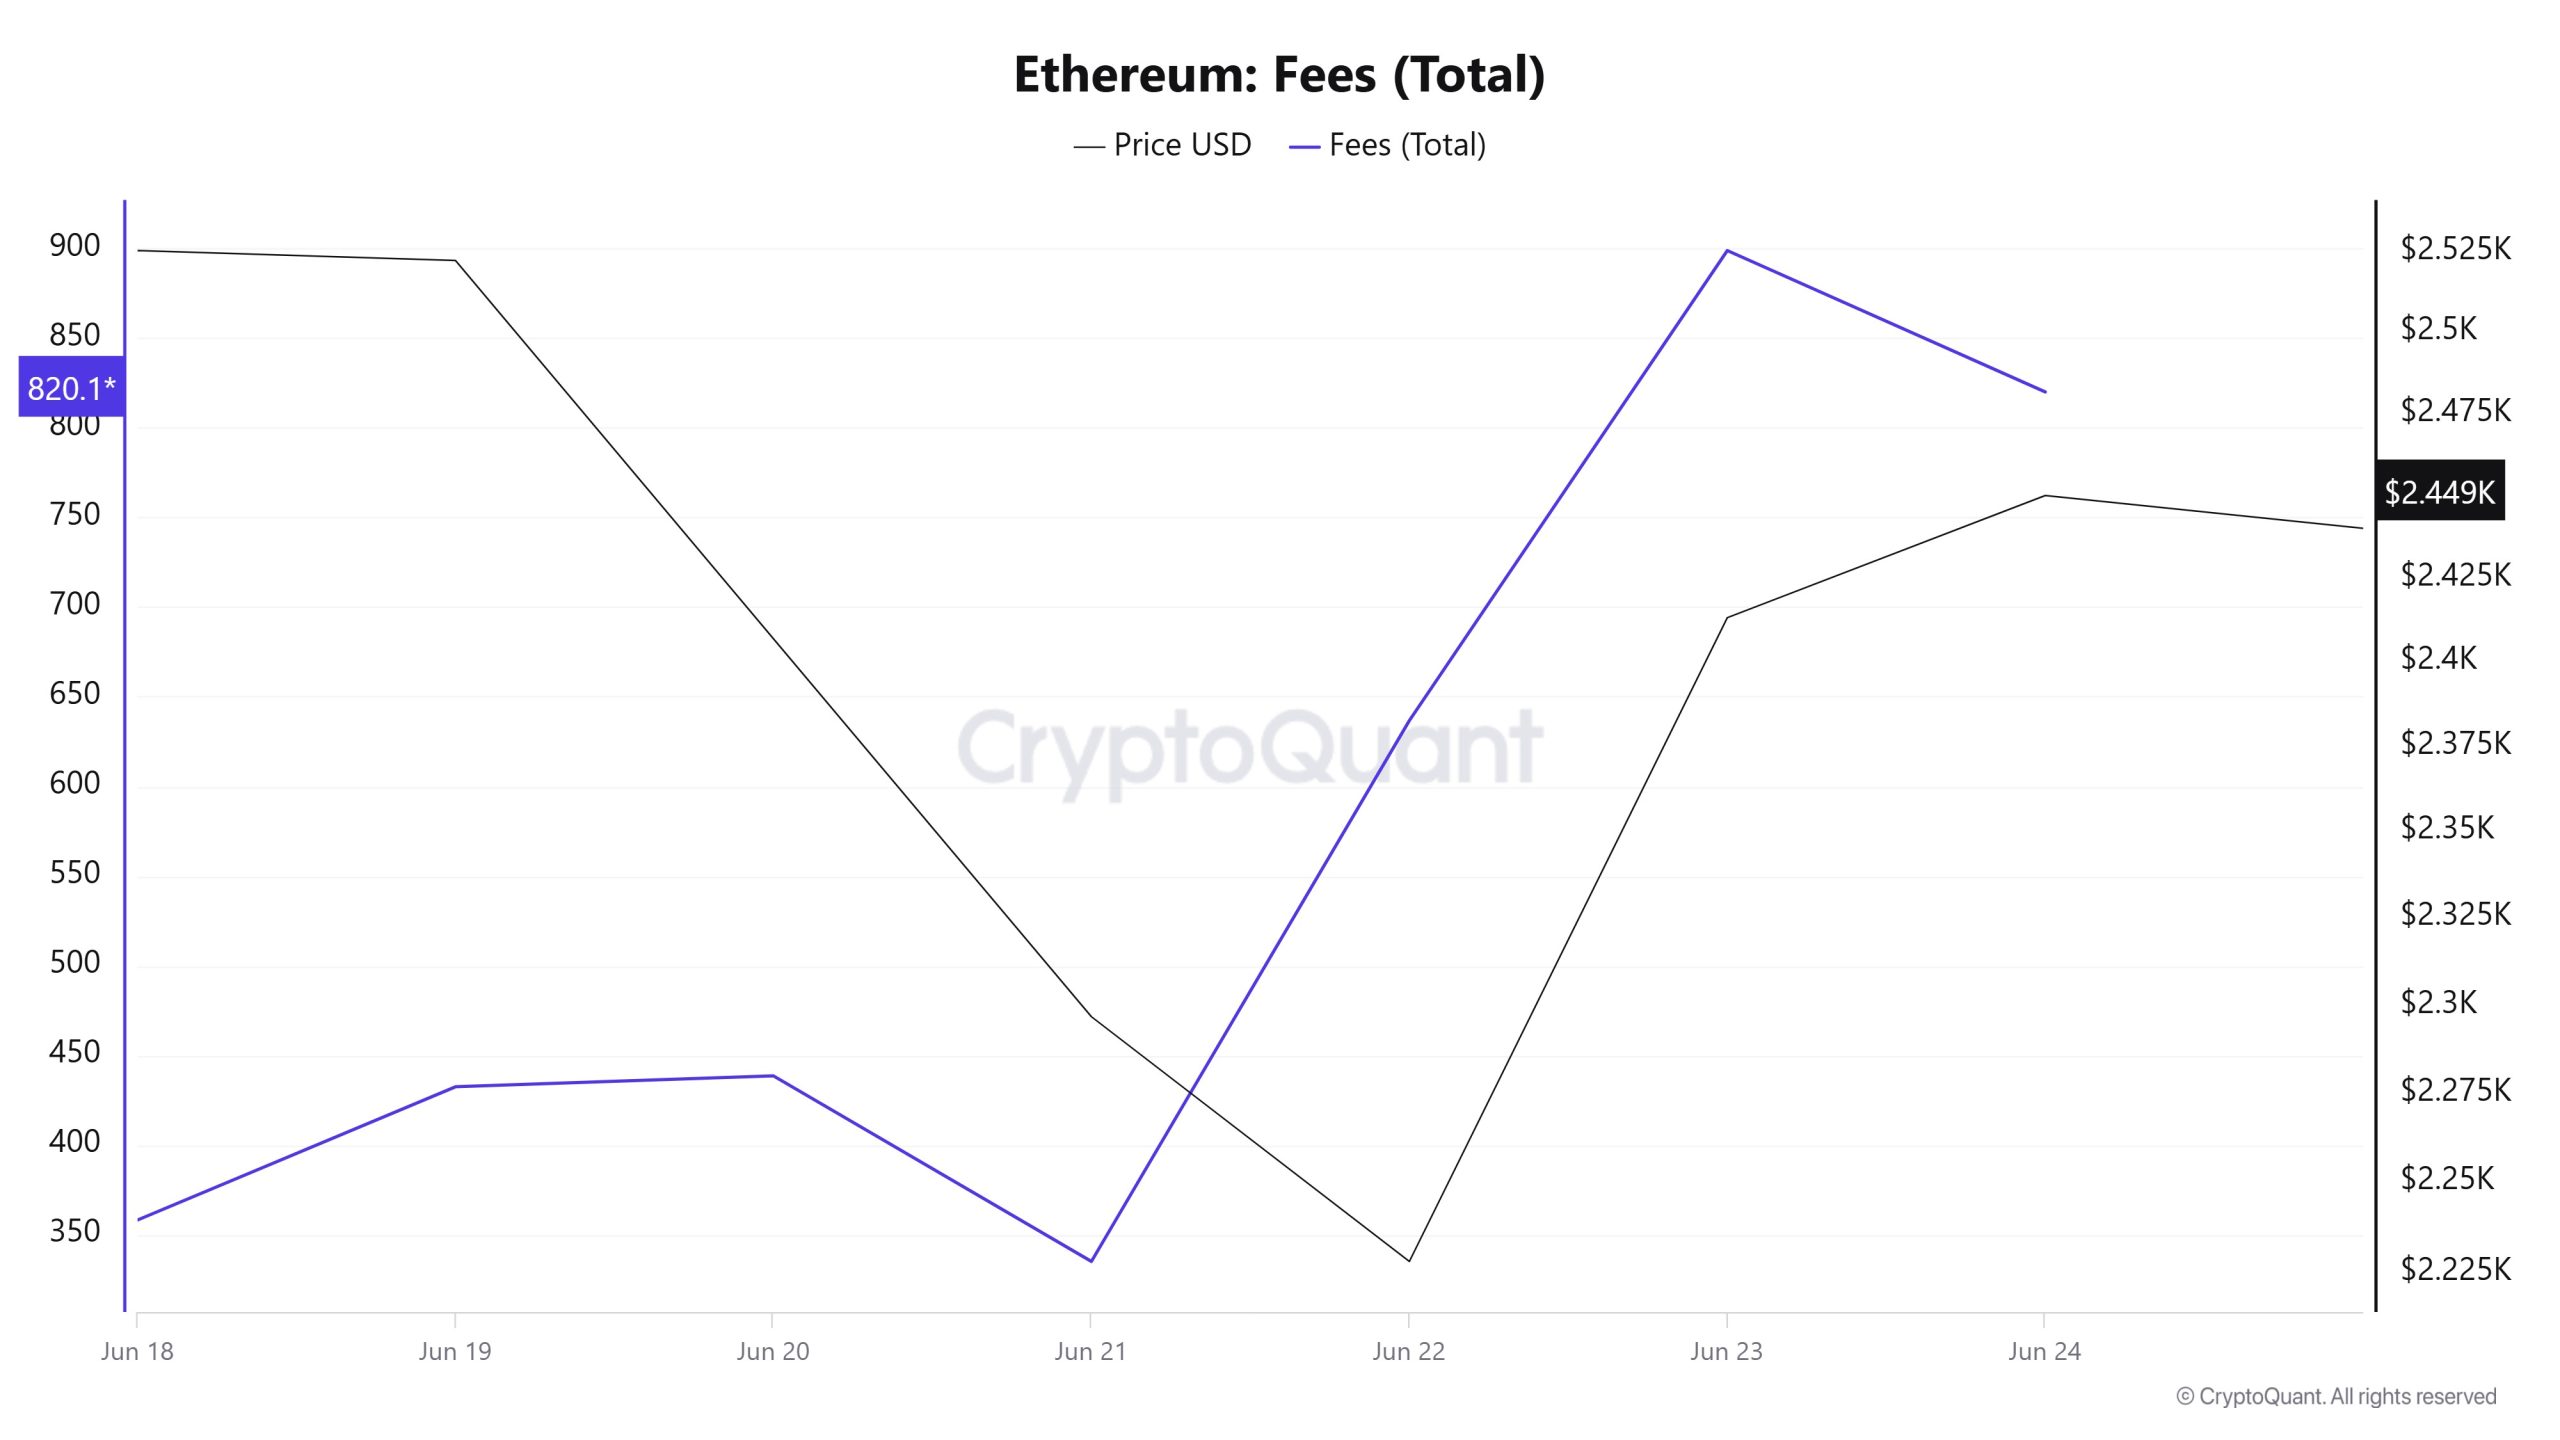
Similarly, when the Ethereum Fees (Total) data between Haziran 18 and 24 is analyzed, it is seen that this value was realized at 358.07542724312725 on Haziran 18, the first day of the week.
Following this, a horizontal trend was observed in the indicator, and as of Haziran 21, it fell to 334.9403331705049, recording the lowest value of the week.
After this level, Ethereum Fees (Total) started to rise again and closed at 820,1155236665674 on Haziran 24, the last day of the week.
Blocks Mined
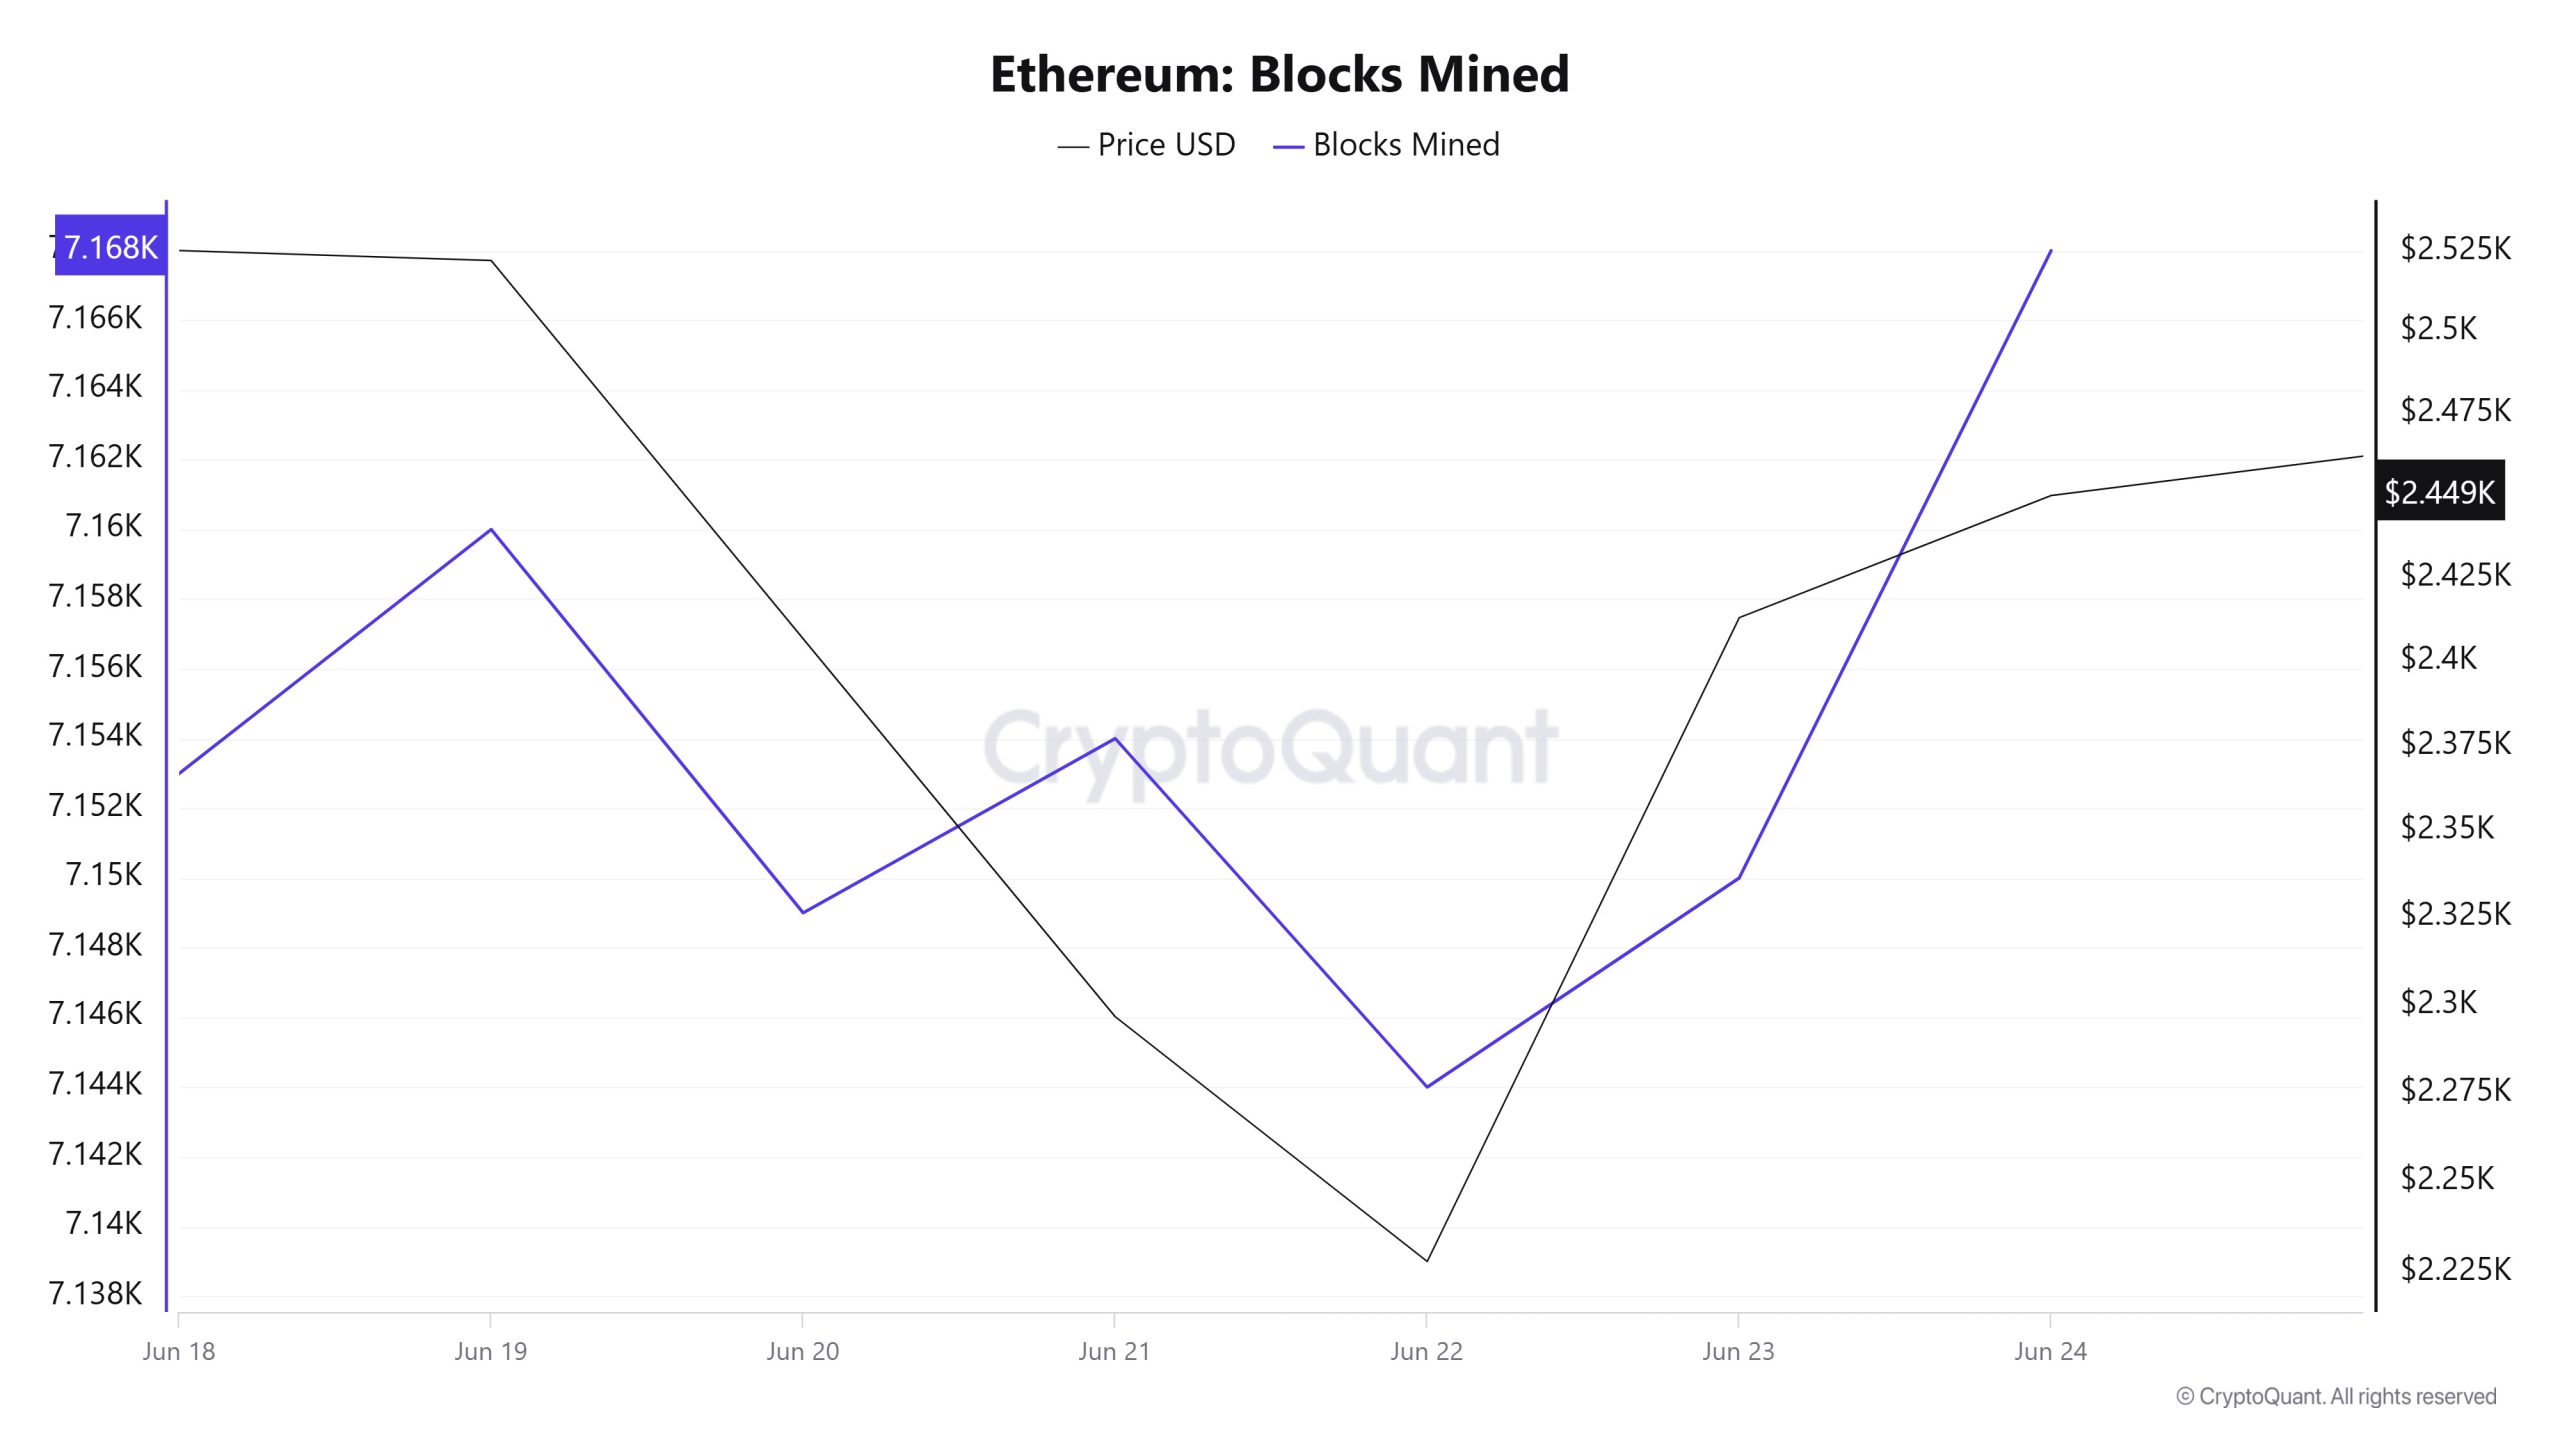
Between Haziran 18 and Haziran 24, Ethereum block production data shows a decline until the middle of the week, followed by a sharp increase. While 7,153 blocks were generated on Haziran 18, this number increased to 7,168 as of Haziran 24. This increase indicates a short-term acceleration in the network’s transaction verification capacity and optimized block production performance to manage potential network congestion.
There was a generally positive correlation between the number of block production and the Ethereum price in the relevant period.
Blok Boyutu
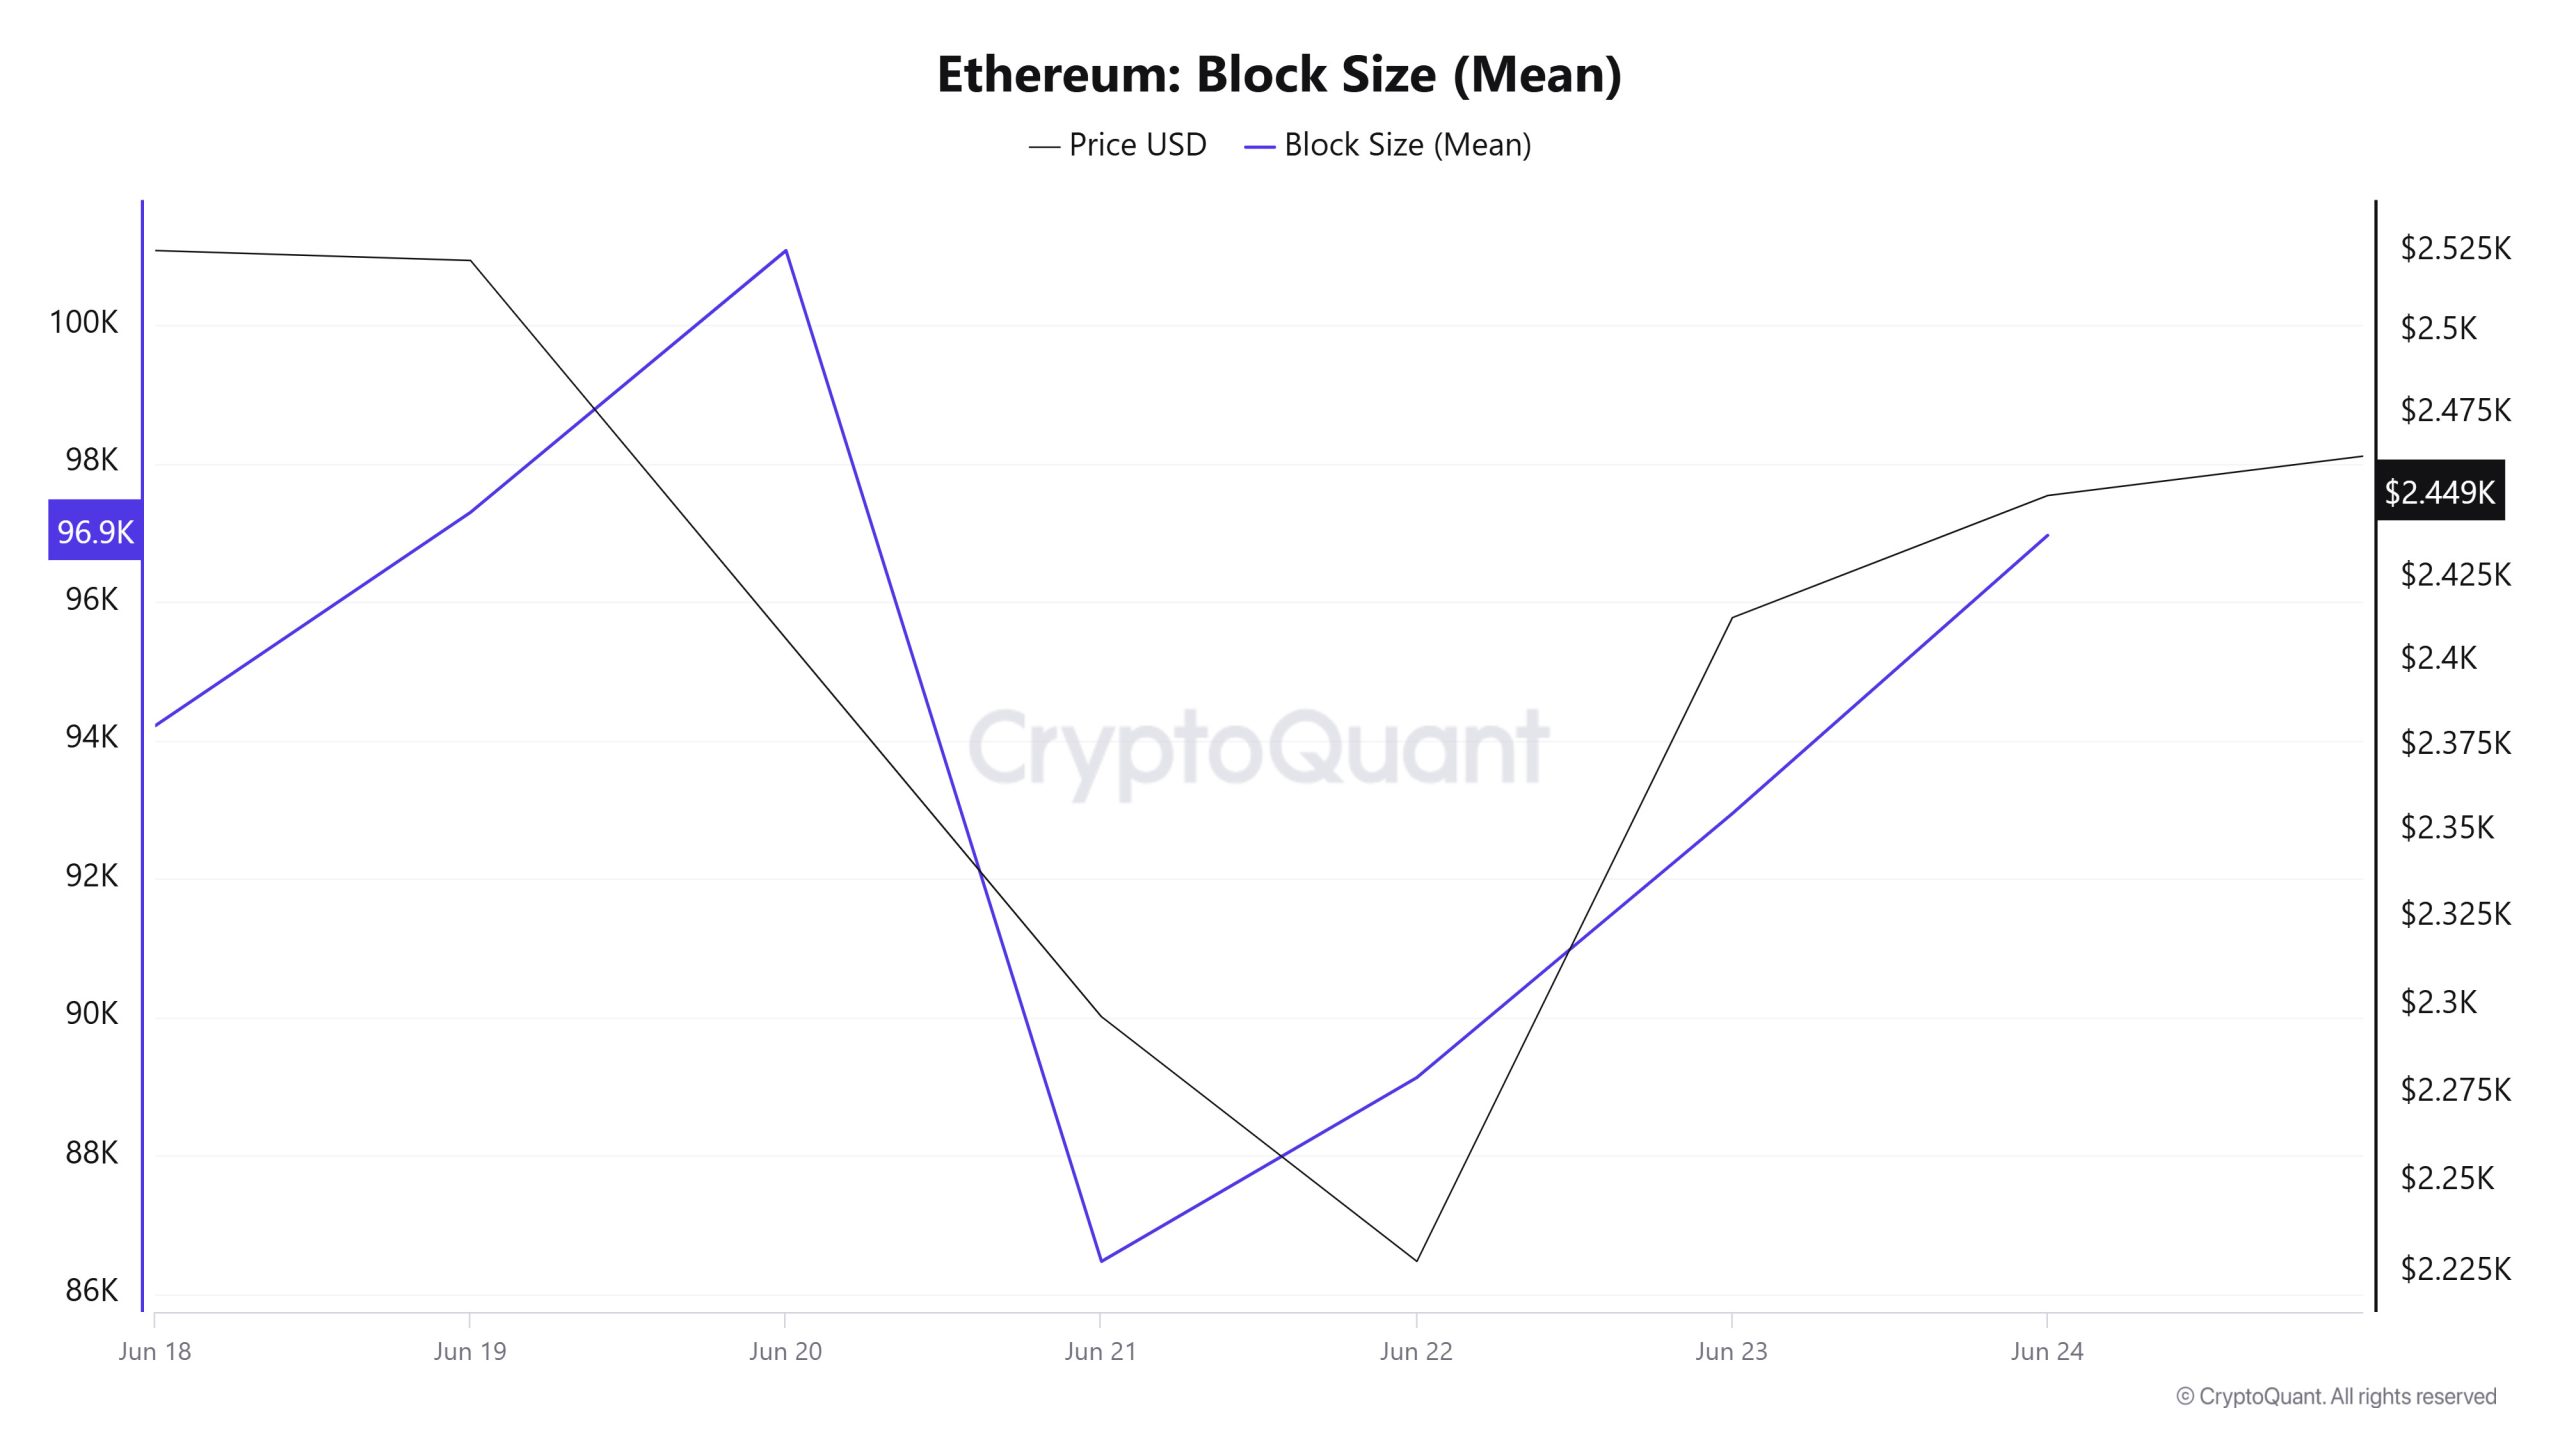
Between Haziran 18 and Haziran 24, Ethereum block size data showed a sharp increase after a mid-week drop. On Haziran 18, the average block size was 94,211 bytes, while this value increased to 96,962 bytes as of Haziran 24.
There was a positive correlation between block size and Ethereum price during the week.
Blok Aralığı

When the Haziran 18 – 24 Ethereum block data is analyzed, an upward trend in block times was observed until the middle of the week, but towards the end of the week, this trend reversed and decreased. On Haziran 18, the average block duration was recorded as 12.08 seconds, while it decreased to 12.05 seconds as of Haziran 24.
During the period in question, Ethereum block duration and price movement were negatively correlated throughout the week.
İşlem
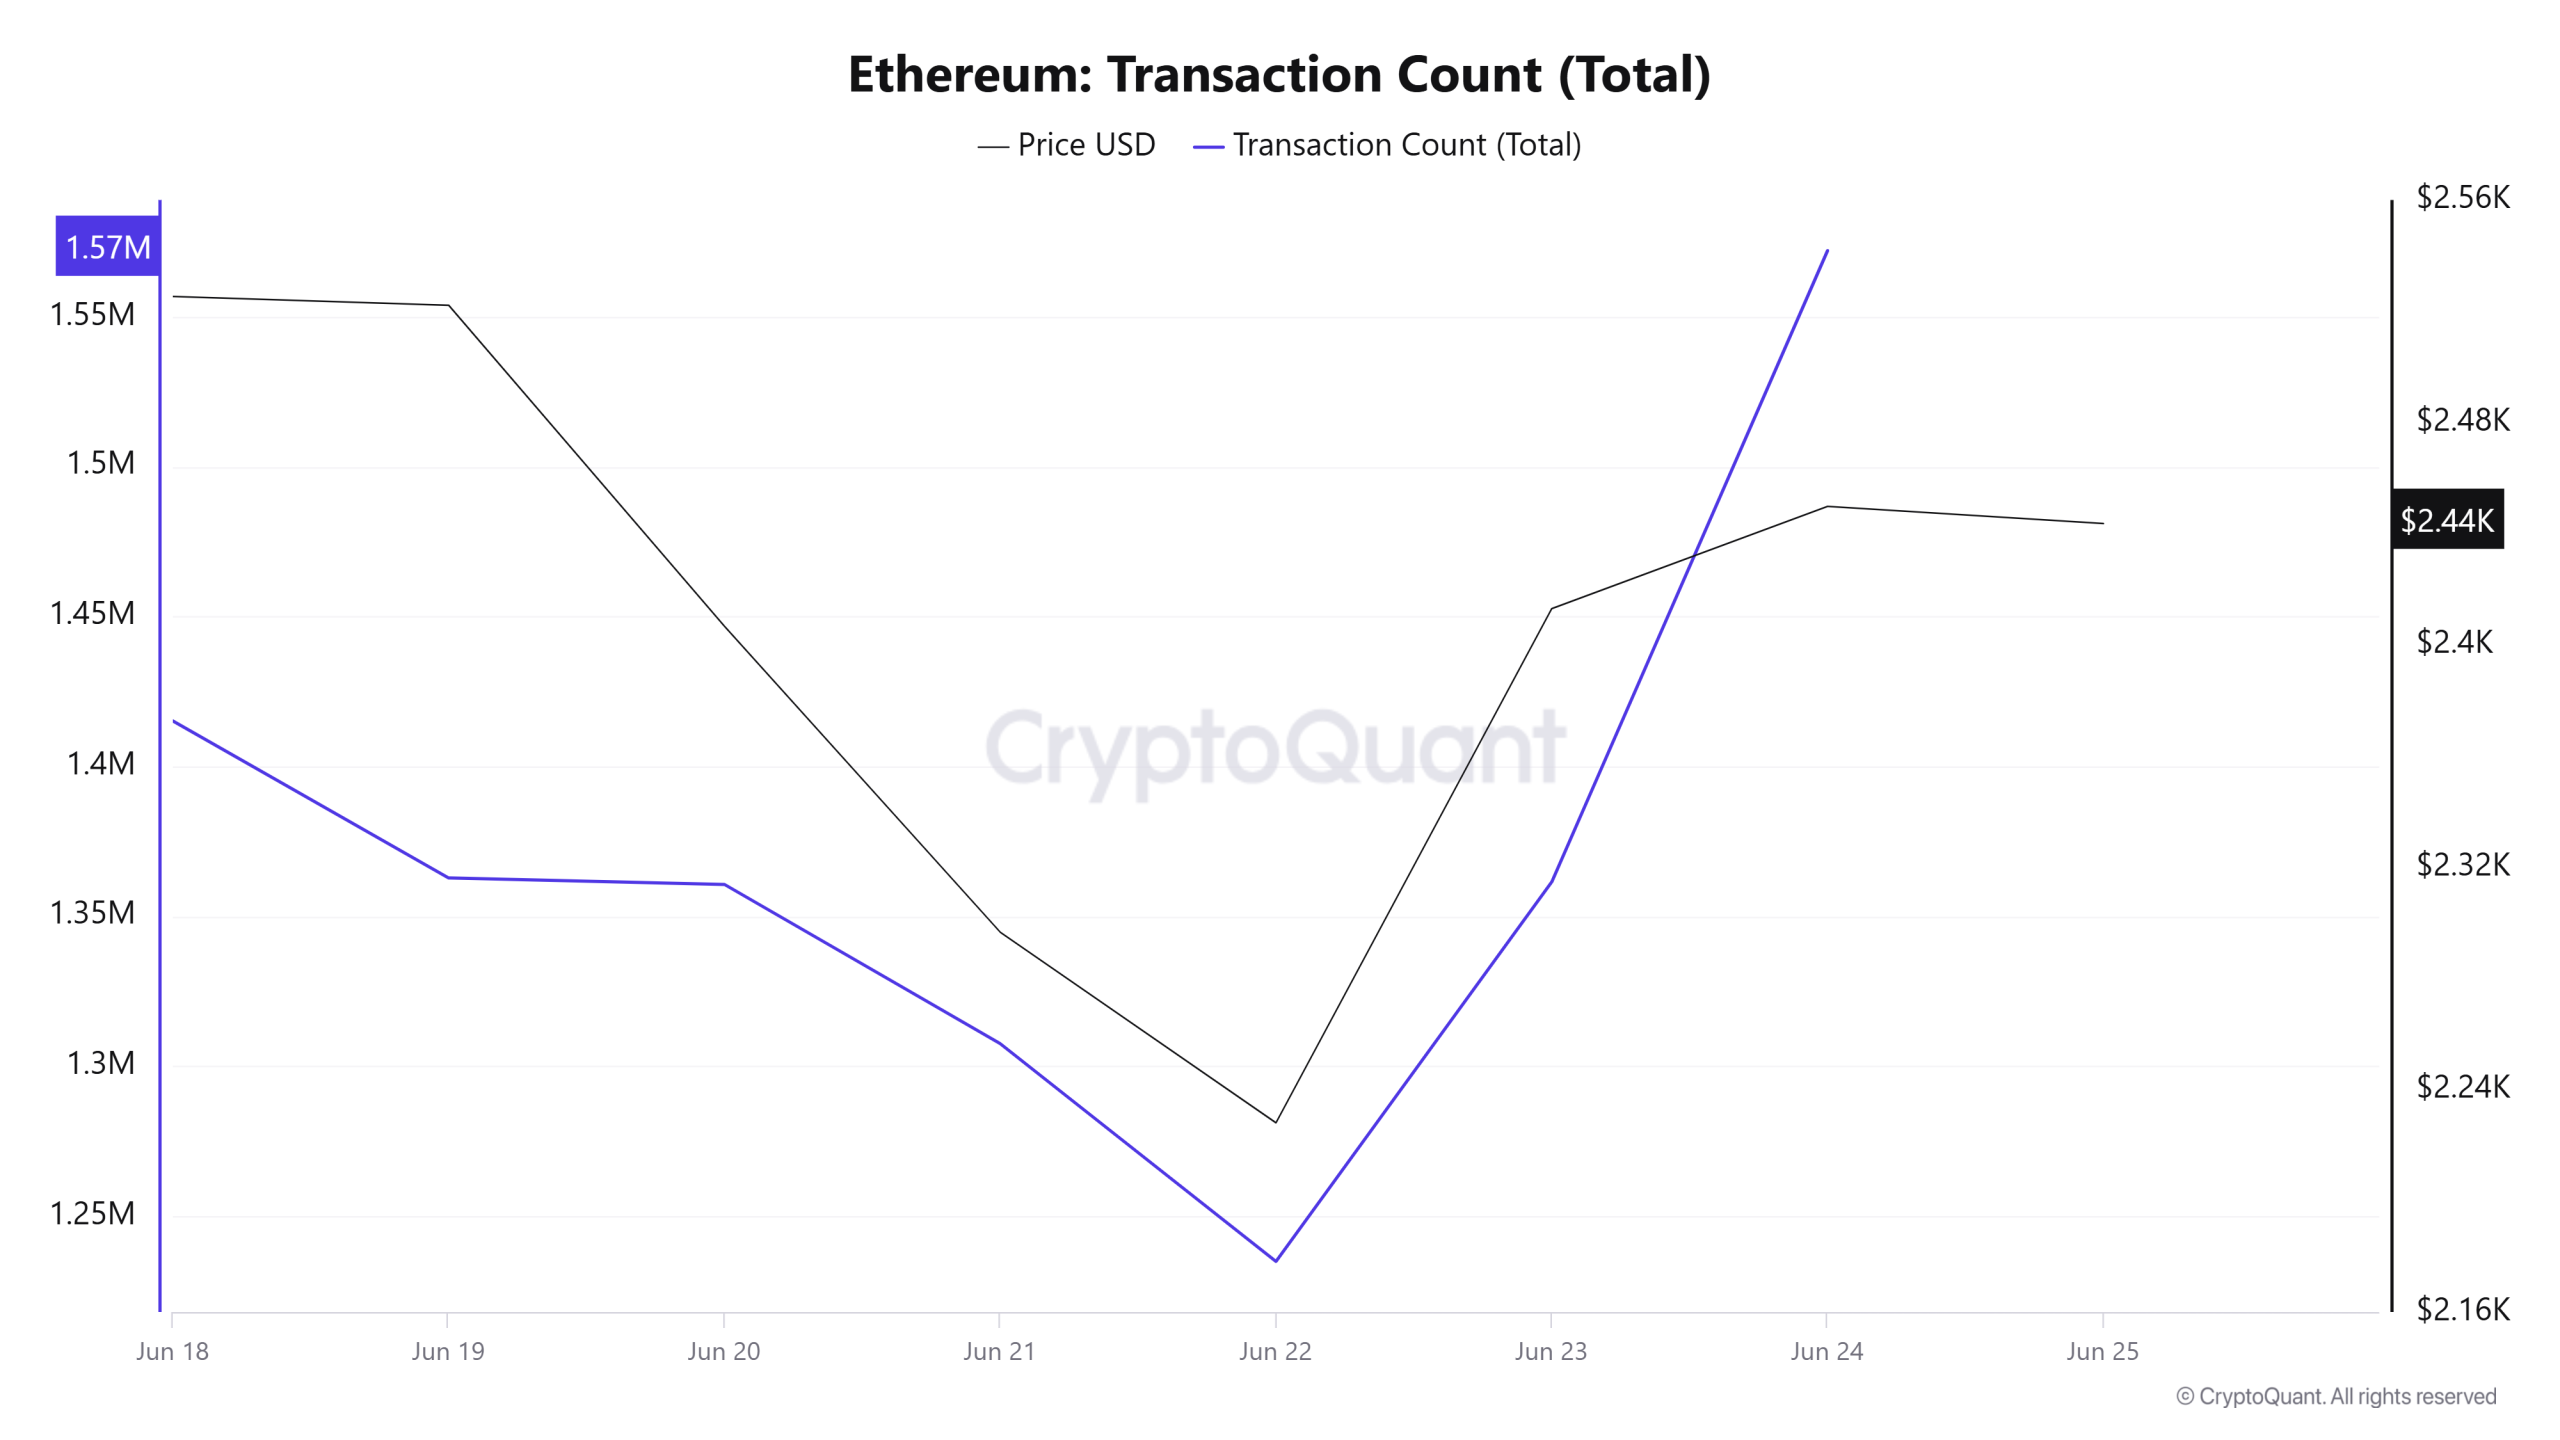
Last week, there were a total of 9,727,815 transactions on the Ethereum network, while this week it decreased by about 1.17% to 9,614,385. The highest weekly transaction count was 1,572,073 on Haziran 24, while the lowest was 1,234,821 on Haziran 22.
The change in the number of transactions shows that the utilization of the network has decreased compared to last week and accordingly, Ethereum burns have also decreased. The correlation between price and number of transactions was generally positive throughout the week.
Transfer Edilen Jetonlar
Last week, the total amount of ETH transferred on the Ethereum network was 13,557,583, while this week it decreased by about 3.94% to 13,023,438. 2,857,630 ETH transfers on Haziran 20 was the highest daily token transfer amount of the week, while the lowest value of the week was recorded on Haziran 21 with only 1,074,839 ETH transfers.
The decline in the network’s utilization, combined with the decrease in the number of transactions on Ethereum and the amount of ETH transferred, suggests that overall activity is weakening. This supports that investors are more cautious in the short term and uncertainty about the market direction continues to increase.
Tahmini Kaldıraç Oranı
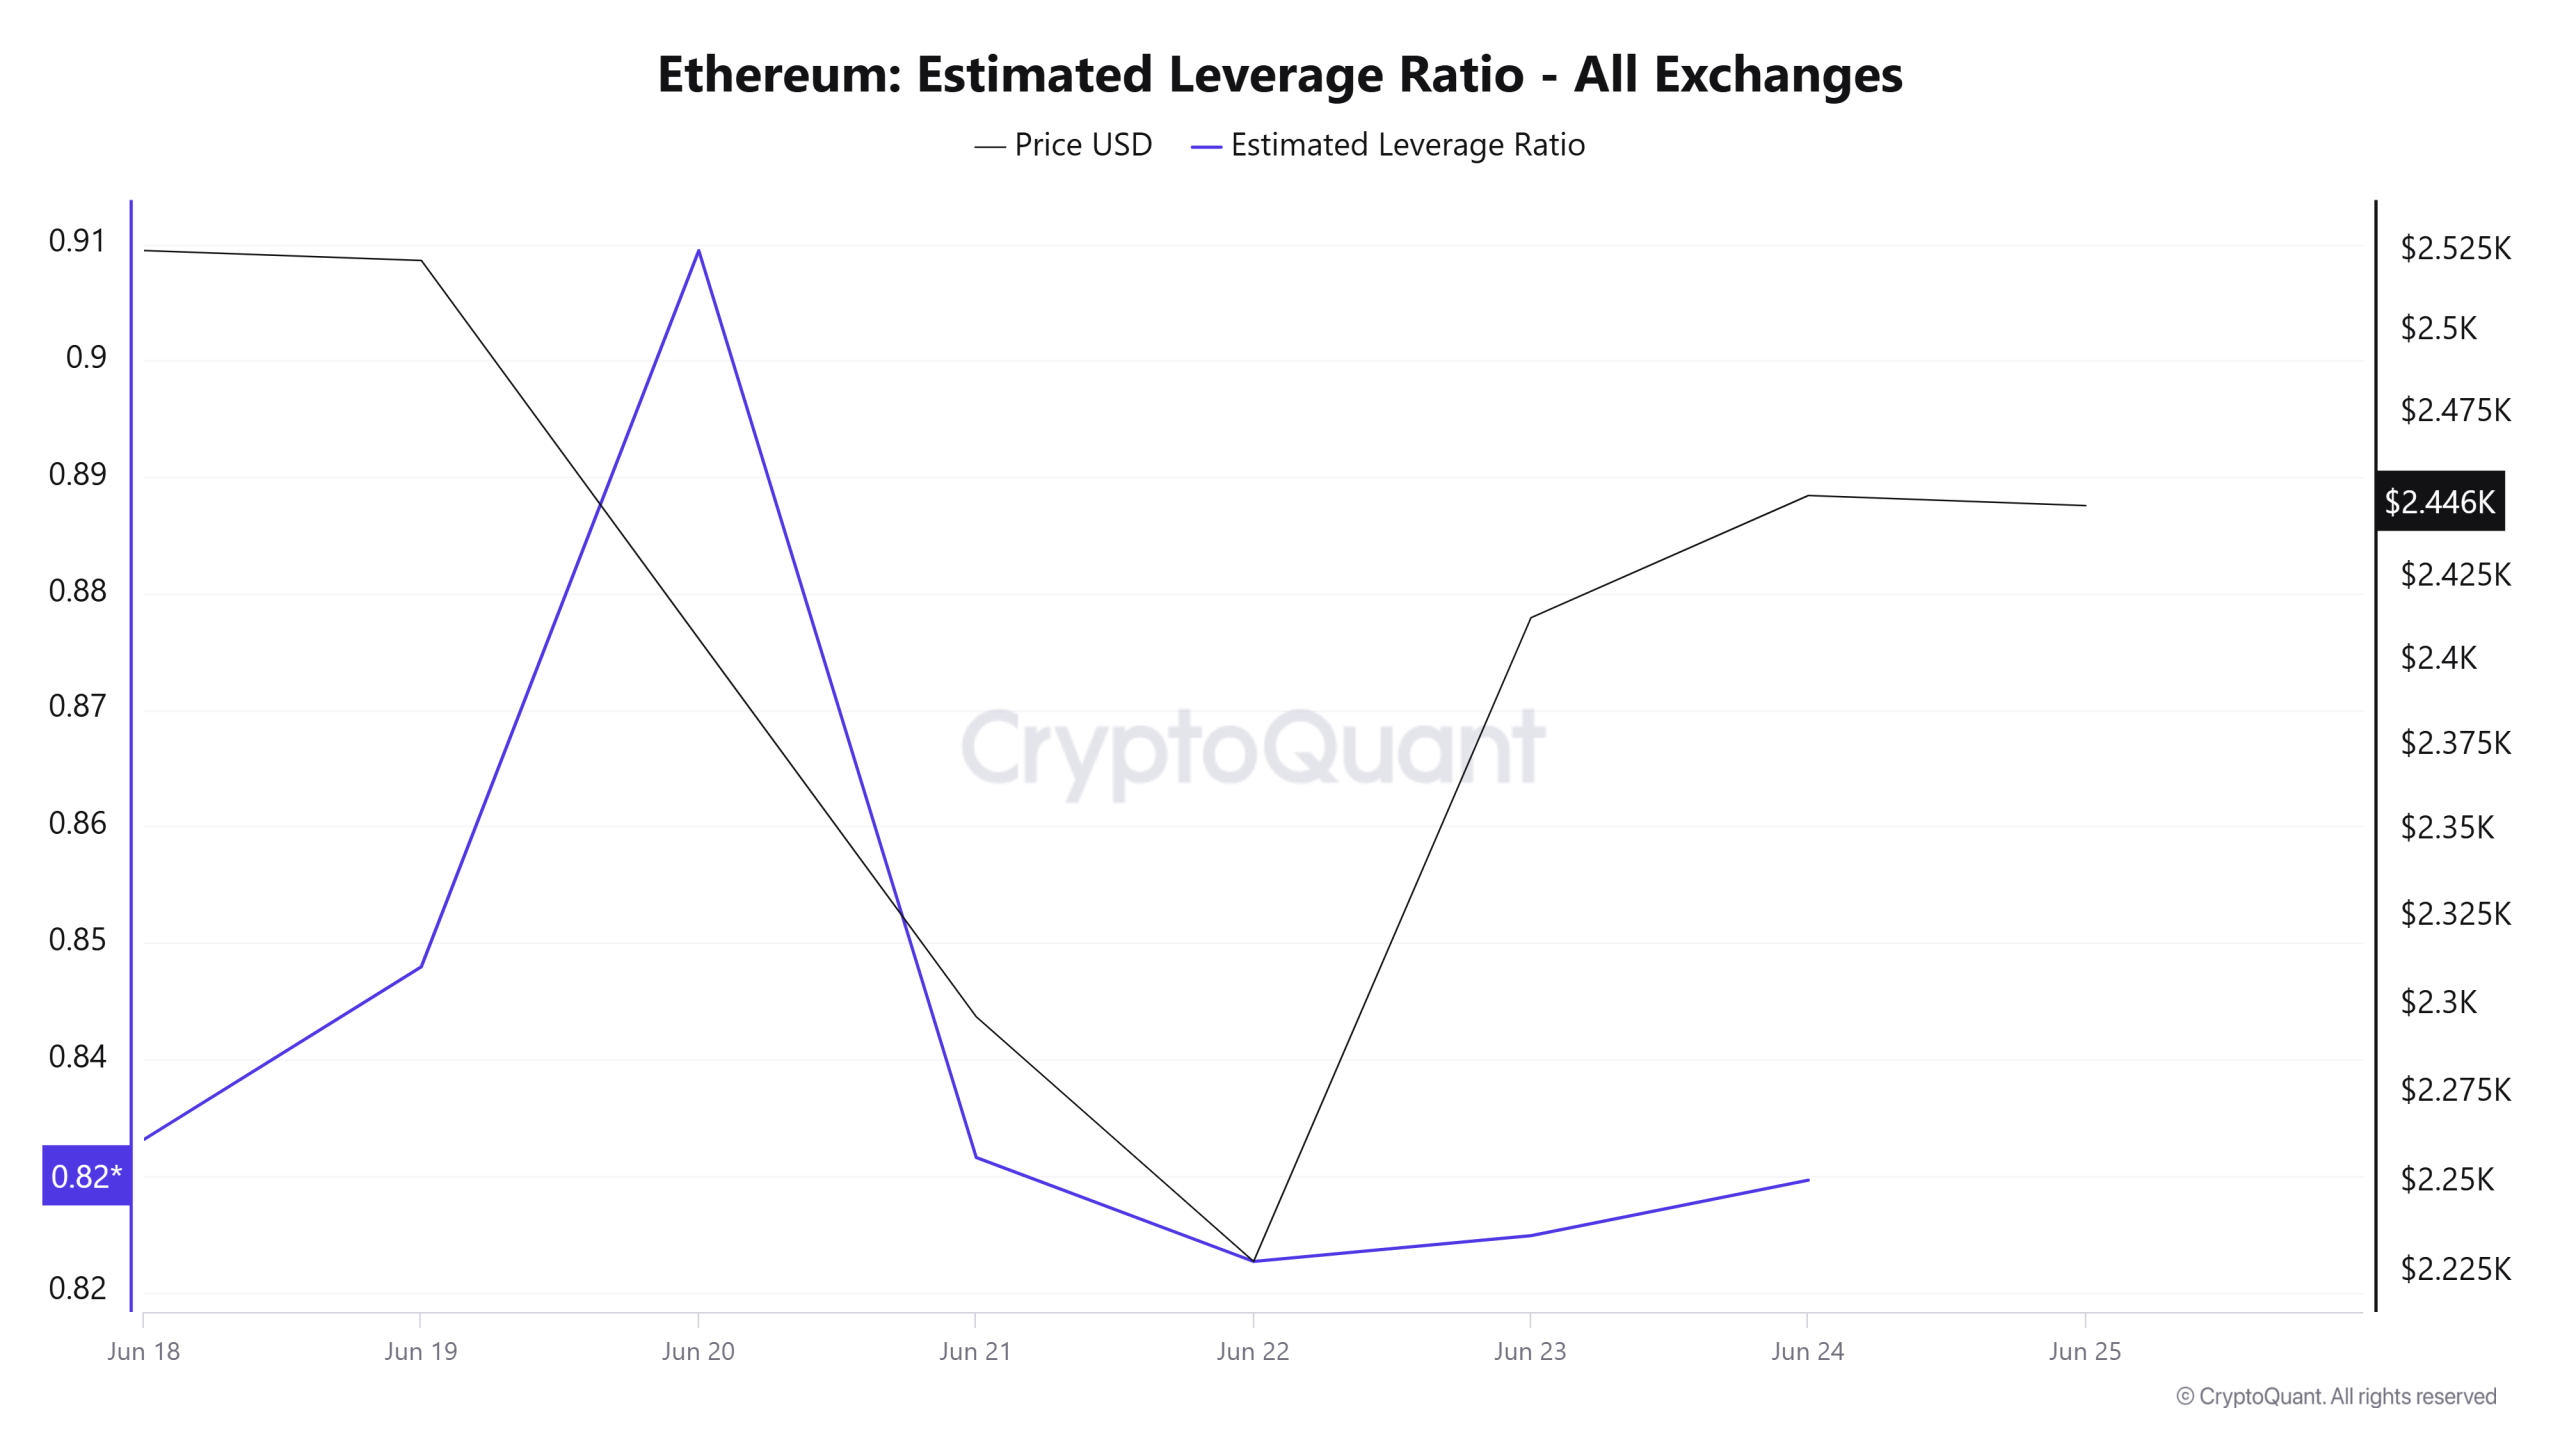
During the 7-day period, the metric generally increased in the first time of the process. ELR (Estimated Leverage Ratio), which was 0.833 at the beginning of the process, reached 0.909 on Haziran 20. This was also the peak of the process. On Haziran 22, it fell to 0.822, the lowest point of the process. The metric remained flat for the rest of the process and as of the time of writing, it has a value of 0.829. A higher ELR means that participants are willing to take on more risk and usually indicates bullish conditions or expectations. It should be noted that these rallies can also be caused by dwindling reserves. When we look at Ethereum reserves, there were 18.78 million reserves at the beginning of the process, while this figure fluctuated during the rest of the process. It is currently seen as 18.81 million. At the same time, Ethereum’s Open Interest is seen as 34.80 billion dollars at the beginning of the process. As of now, the volume decreased in the process and the open interest value stands out as 31.53 billion dollars. With all this data, the ELR metric generally followed a falling trend. The price of the asset, with all this data, was valued at $ 2,569 at the top of the process, while the lowest point was realized at $ 2,112. At the time of writing, investors’ and traders’ risk appetite has slightly decreased. In addition, the depreciation in ELR is reflected in the price and is at $ 2,419. The fact that the open interest rate moved in parallel with the fluctuating reserves throughout the process explains the slight decline in the ELR rate. As a result, the decrease in reserves and the decrease in the open interest rate indicate that the market is currently pessimistic. If the balance in the amount of reserves continues and the open interest data decreases, we can predict that the retracement will continue.
ETH Onchain Overall
| Metrik | Yükseliş 📈 | Düşüş 📉 | Nötr ➖ |
|---|---|---|---|
| Aktif Adresler | ✓ | ||
| Toplam Bahis Değeri | ✓ | ||
| Türevler | ✓ | ||
| Tedarik Dağıtımı | ✓ | ||
| Döviz Rezervi | ✓ | ||
| Ücretler ve Gelirler | ✓ | ||
| Bloks Mined | ✓ | ||
| İşlem | ✓ |
- The metrics and guidance in the table do not, by themselves, describe or imply an expectation of future price changes for any asset. The prices of digital assets may vary depending on many different variables. The onchain analysis and related guidance is intended to assist investors in their decision-making process, and making financial investments based solely on the results of this analysis may result in harmful transactions. Even if all metrics produce a bullish, bearish or neutral result at the same time, the expected results may not be seen depending on market conditions. Investors reviewing the report would be well advised to heed these caveats.
Yasal Uyarı
The investment information, comments and recommendations contained in this document do not constitute investment advisory services. Investment advisory services are provided by authorized institutions on a personal basis, taking into account the risk and return preferences of individuals. The comments and recommendations contained in this document are of a general type. These recommendations may not be suitable for your financial situation and risk and return preferences. Therefore, making an investment decision based solely on the information contained in this document may not result in results that are in line

