
Active Addresses
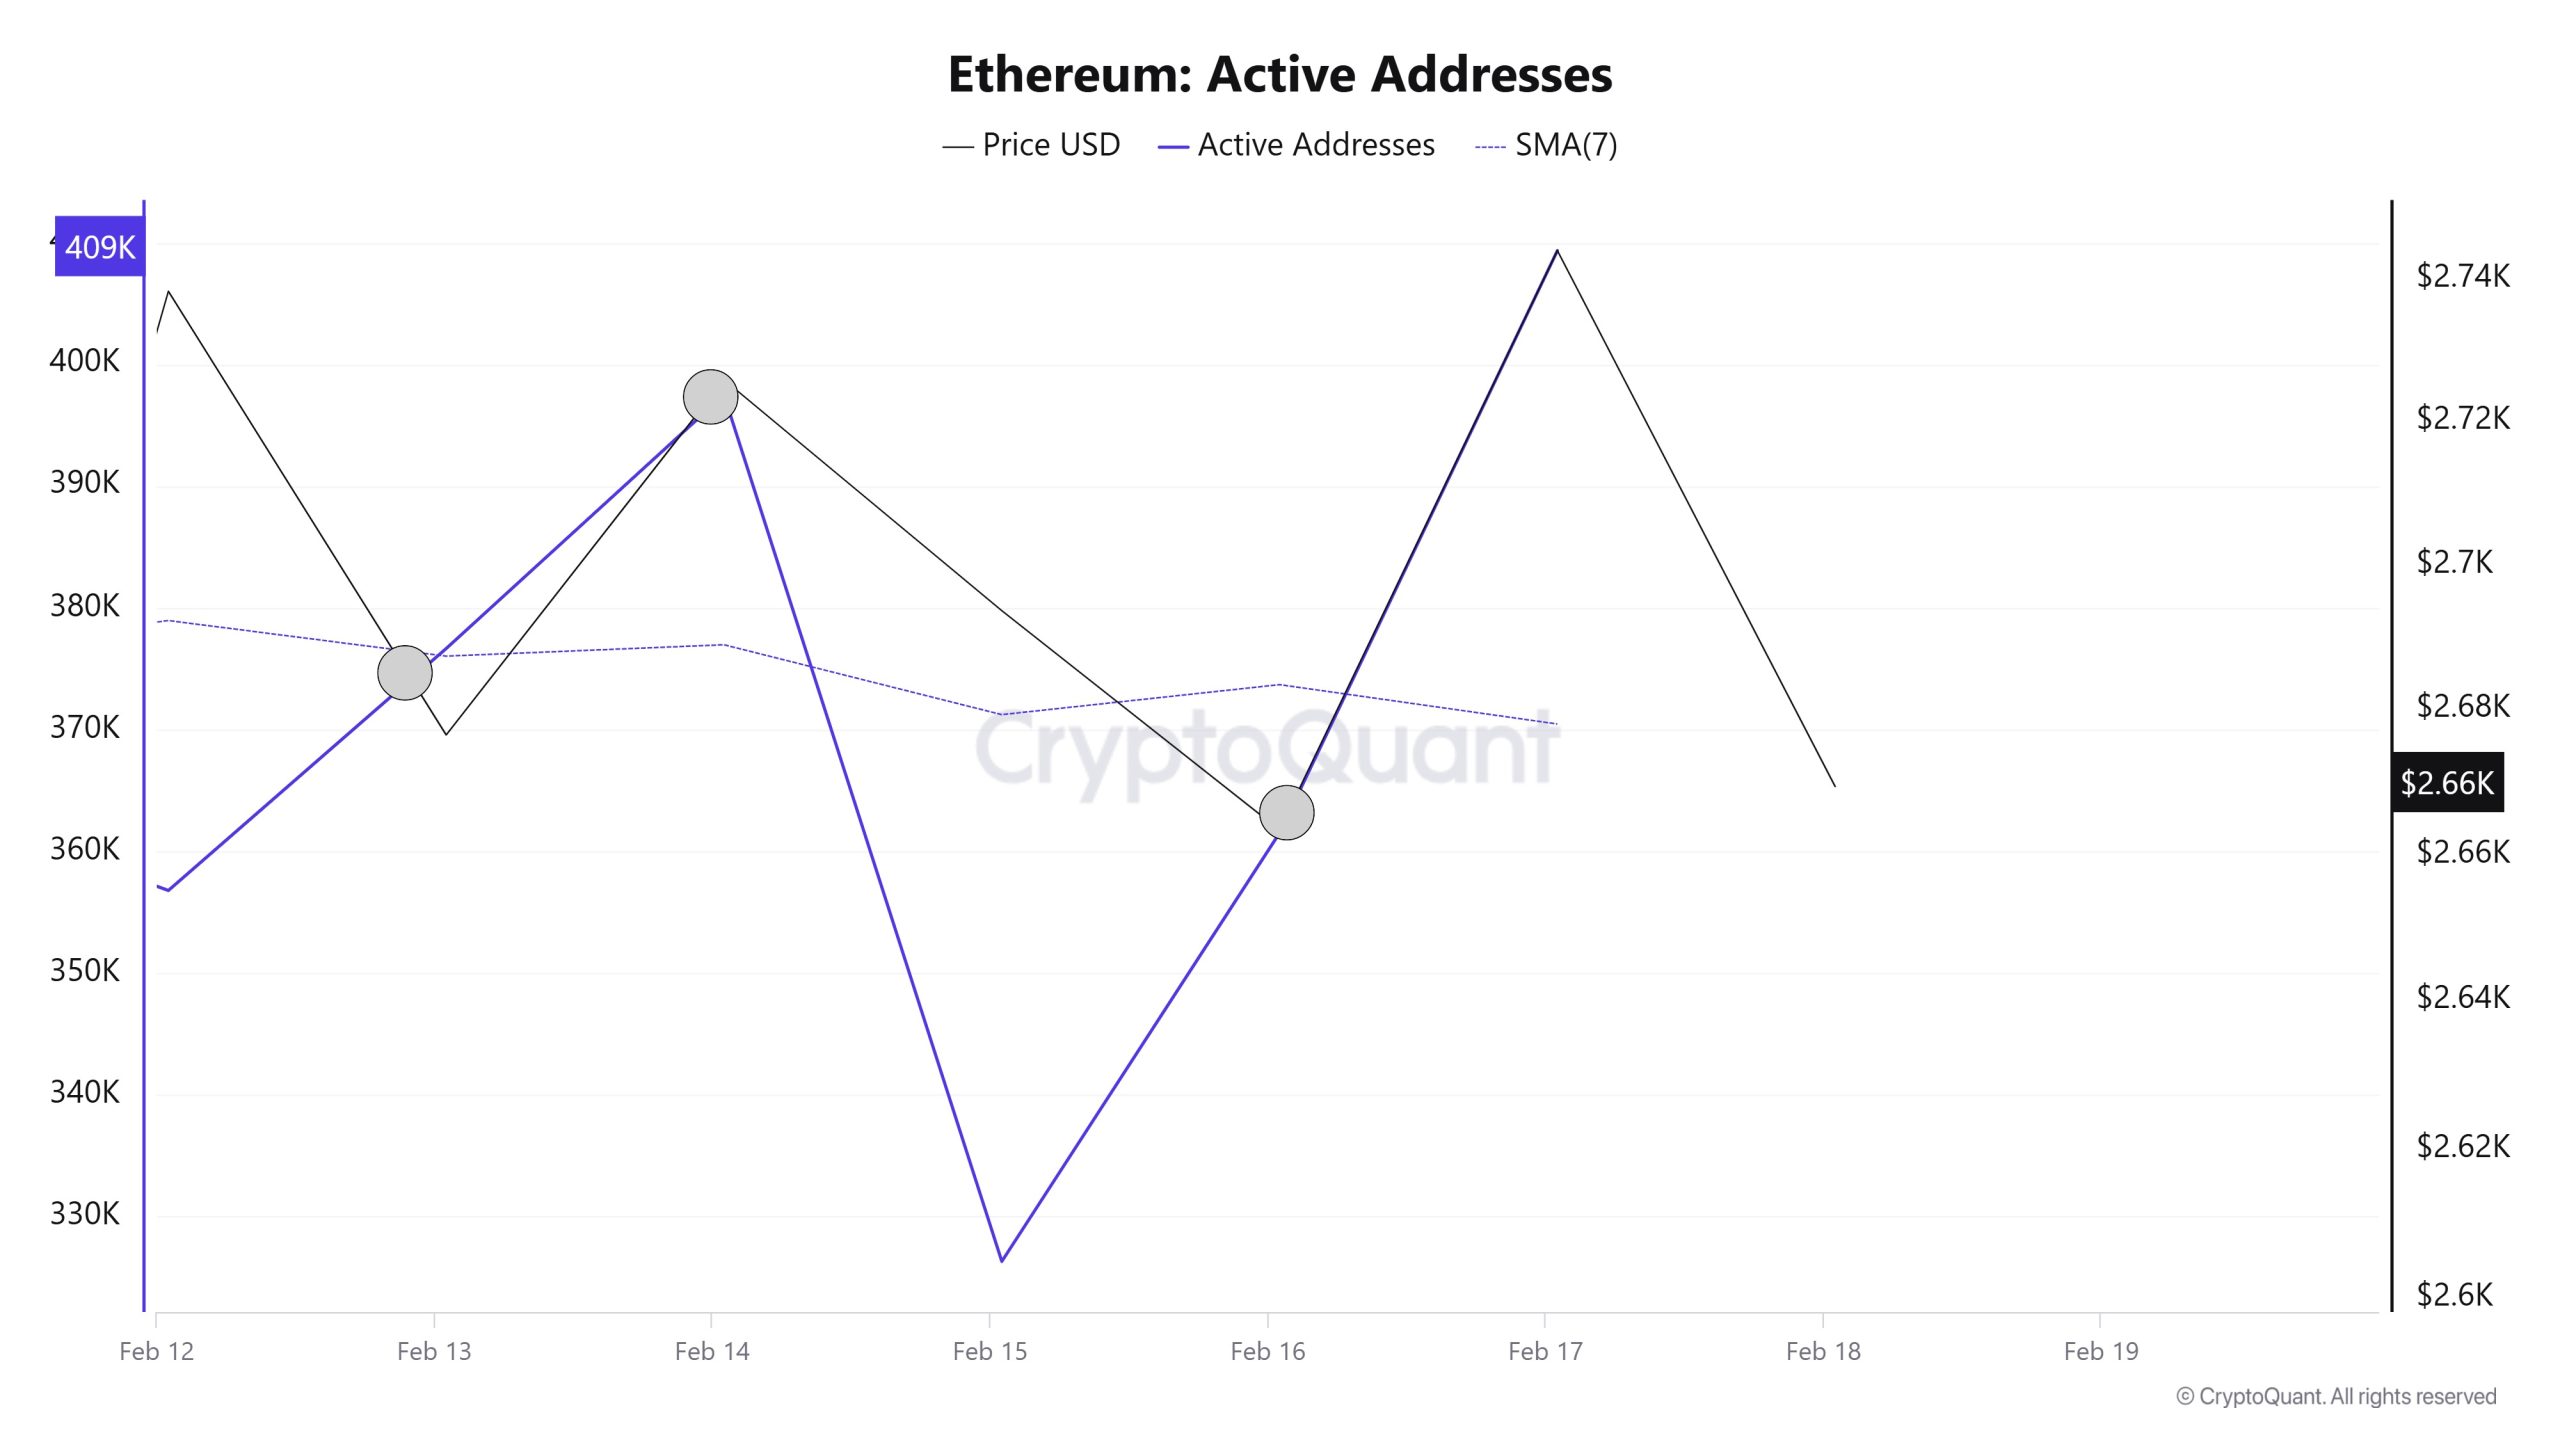
In the number of active addresses, there were 376,653 entries to exchanges between Şubat 12 and Şubat 18, 2025 this week. During this period, Ethereum rose from 2.676 to 2.744. In the region marked on the chart, we see that Ethereum purchases accelerated in the region where the price and the number of active addresses intersect. When we follow the 7-day simple moving average, it is observed that the price follows a downward trend on the dates when this average cuts the price. This situation indicates that the Ethereum price experienced entries at $ 2,663 and exited at $ 2,693.
Aktif Gönderme Adresleri
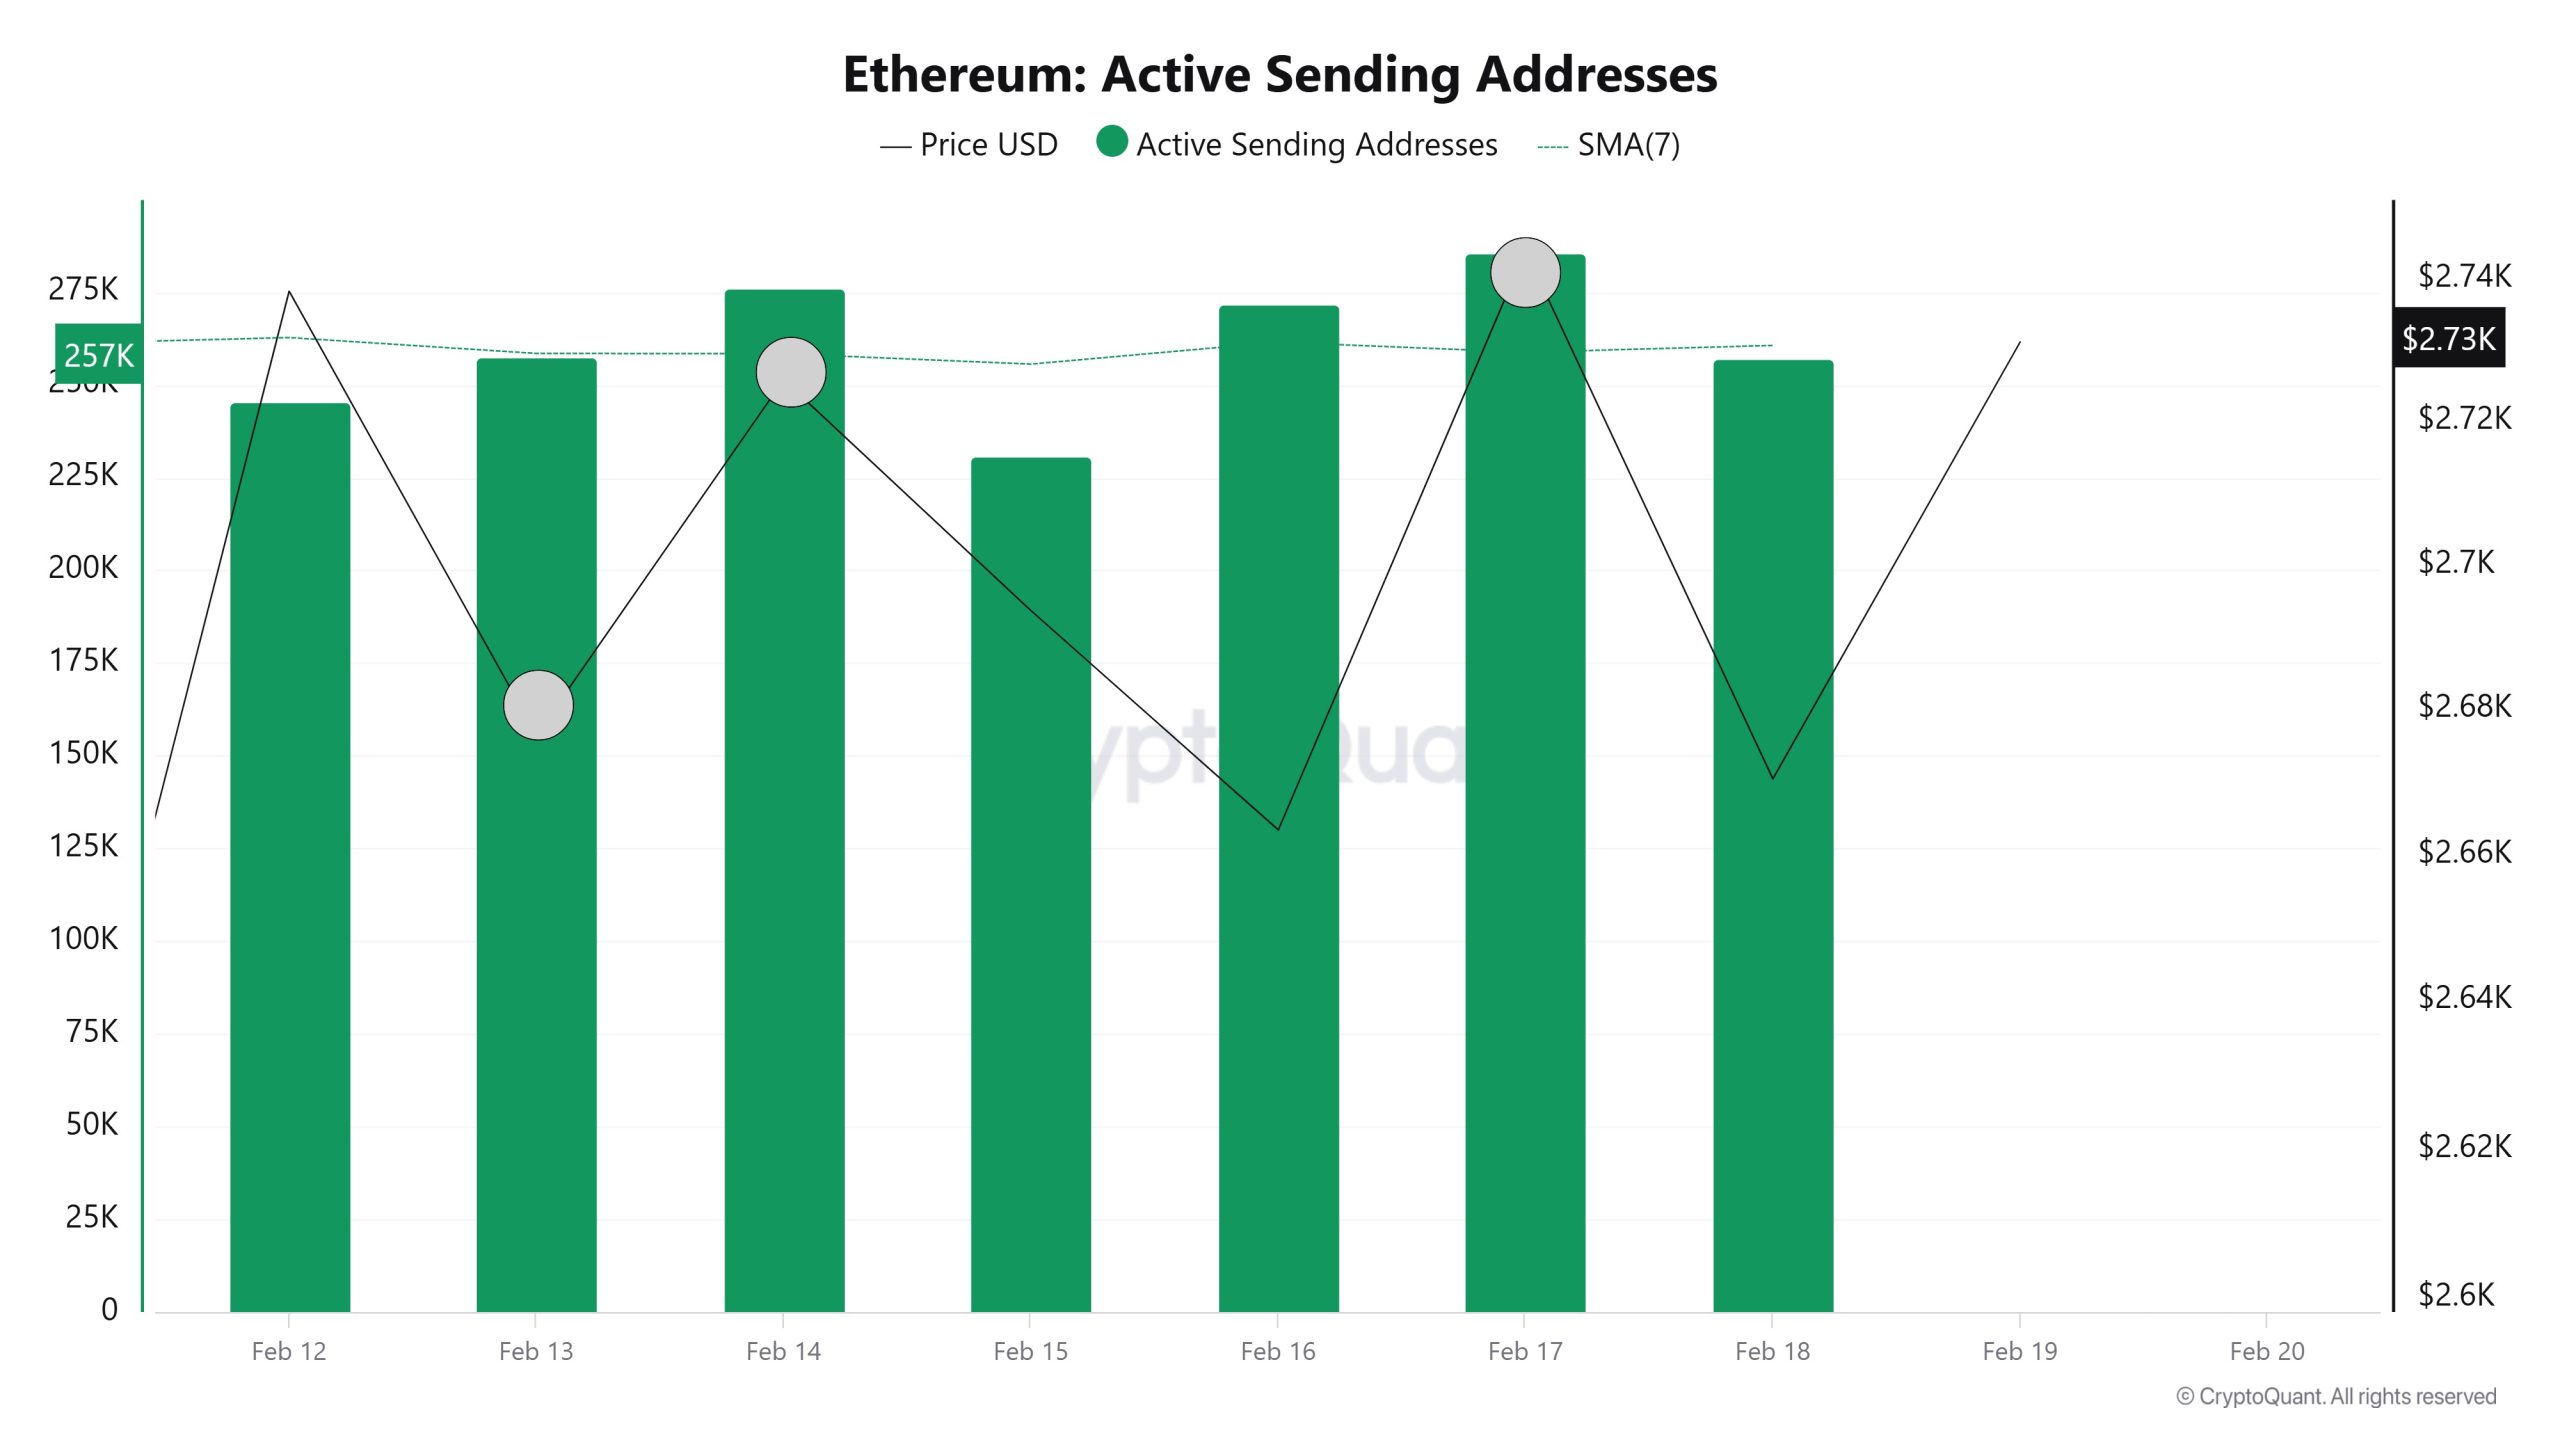
On the exits, there was a significant increase in active shipping addresses towards Şubat 13, along with the Black Line (price line). On the day of the price peak, active shipping addresses rose to 285,604 , indicating that buyers sold their positions as Ethereum stayed at 2,725 for a while. The average of 2,663 active addresses may indicate that the market is falling and investors are selling out of fear.
As a result, it is seen that purchases caused a slowdown in the price decline and the price fell.
Toplam Bahis Değeri
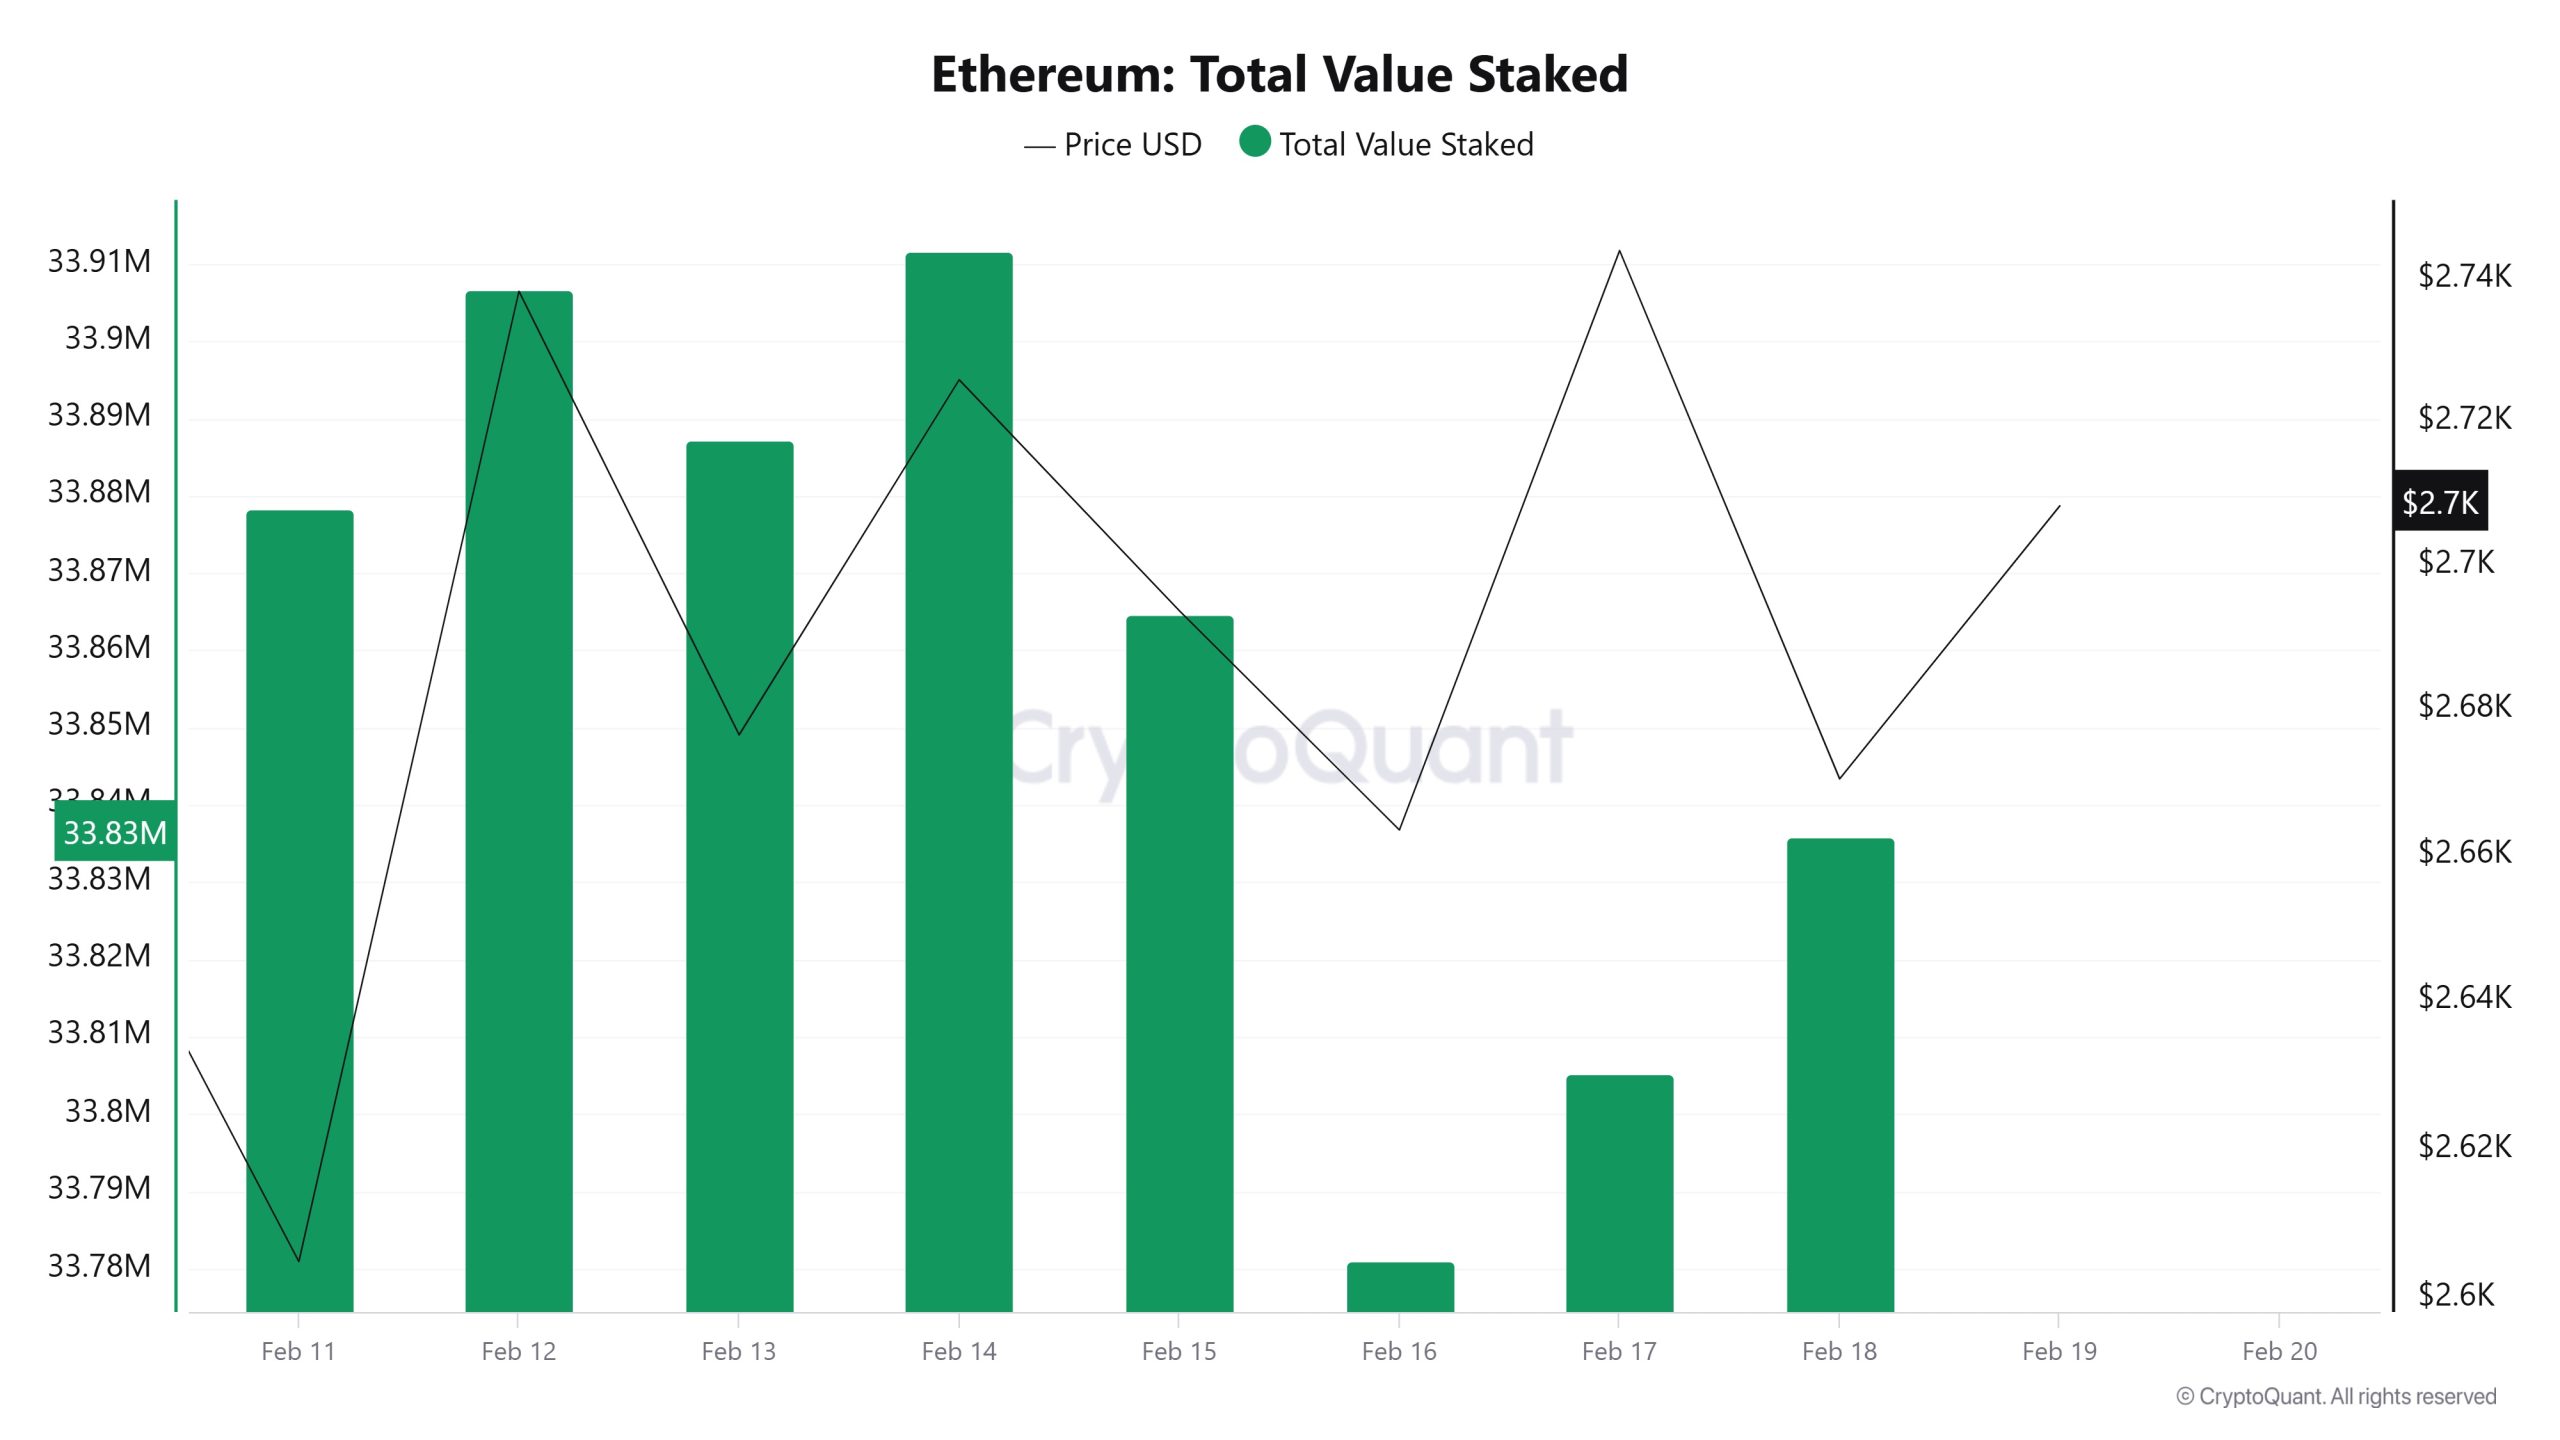
On Şubat 12, ETH price was 2,738 while Total Value Staked Ratio was 33,906. As of Şubat 18, the ETH price was down to 2,670 while the Total Value Staked Ratio was 33,835. Compared to last week, ETH price decreased by 2.48% and Total Value Staked Ratio decreased by 0.21%.
Staking Girişleri
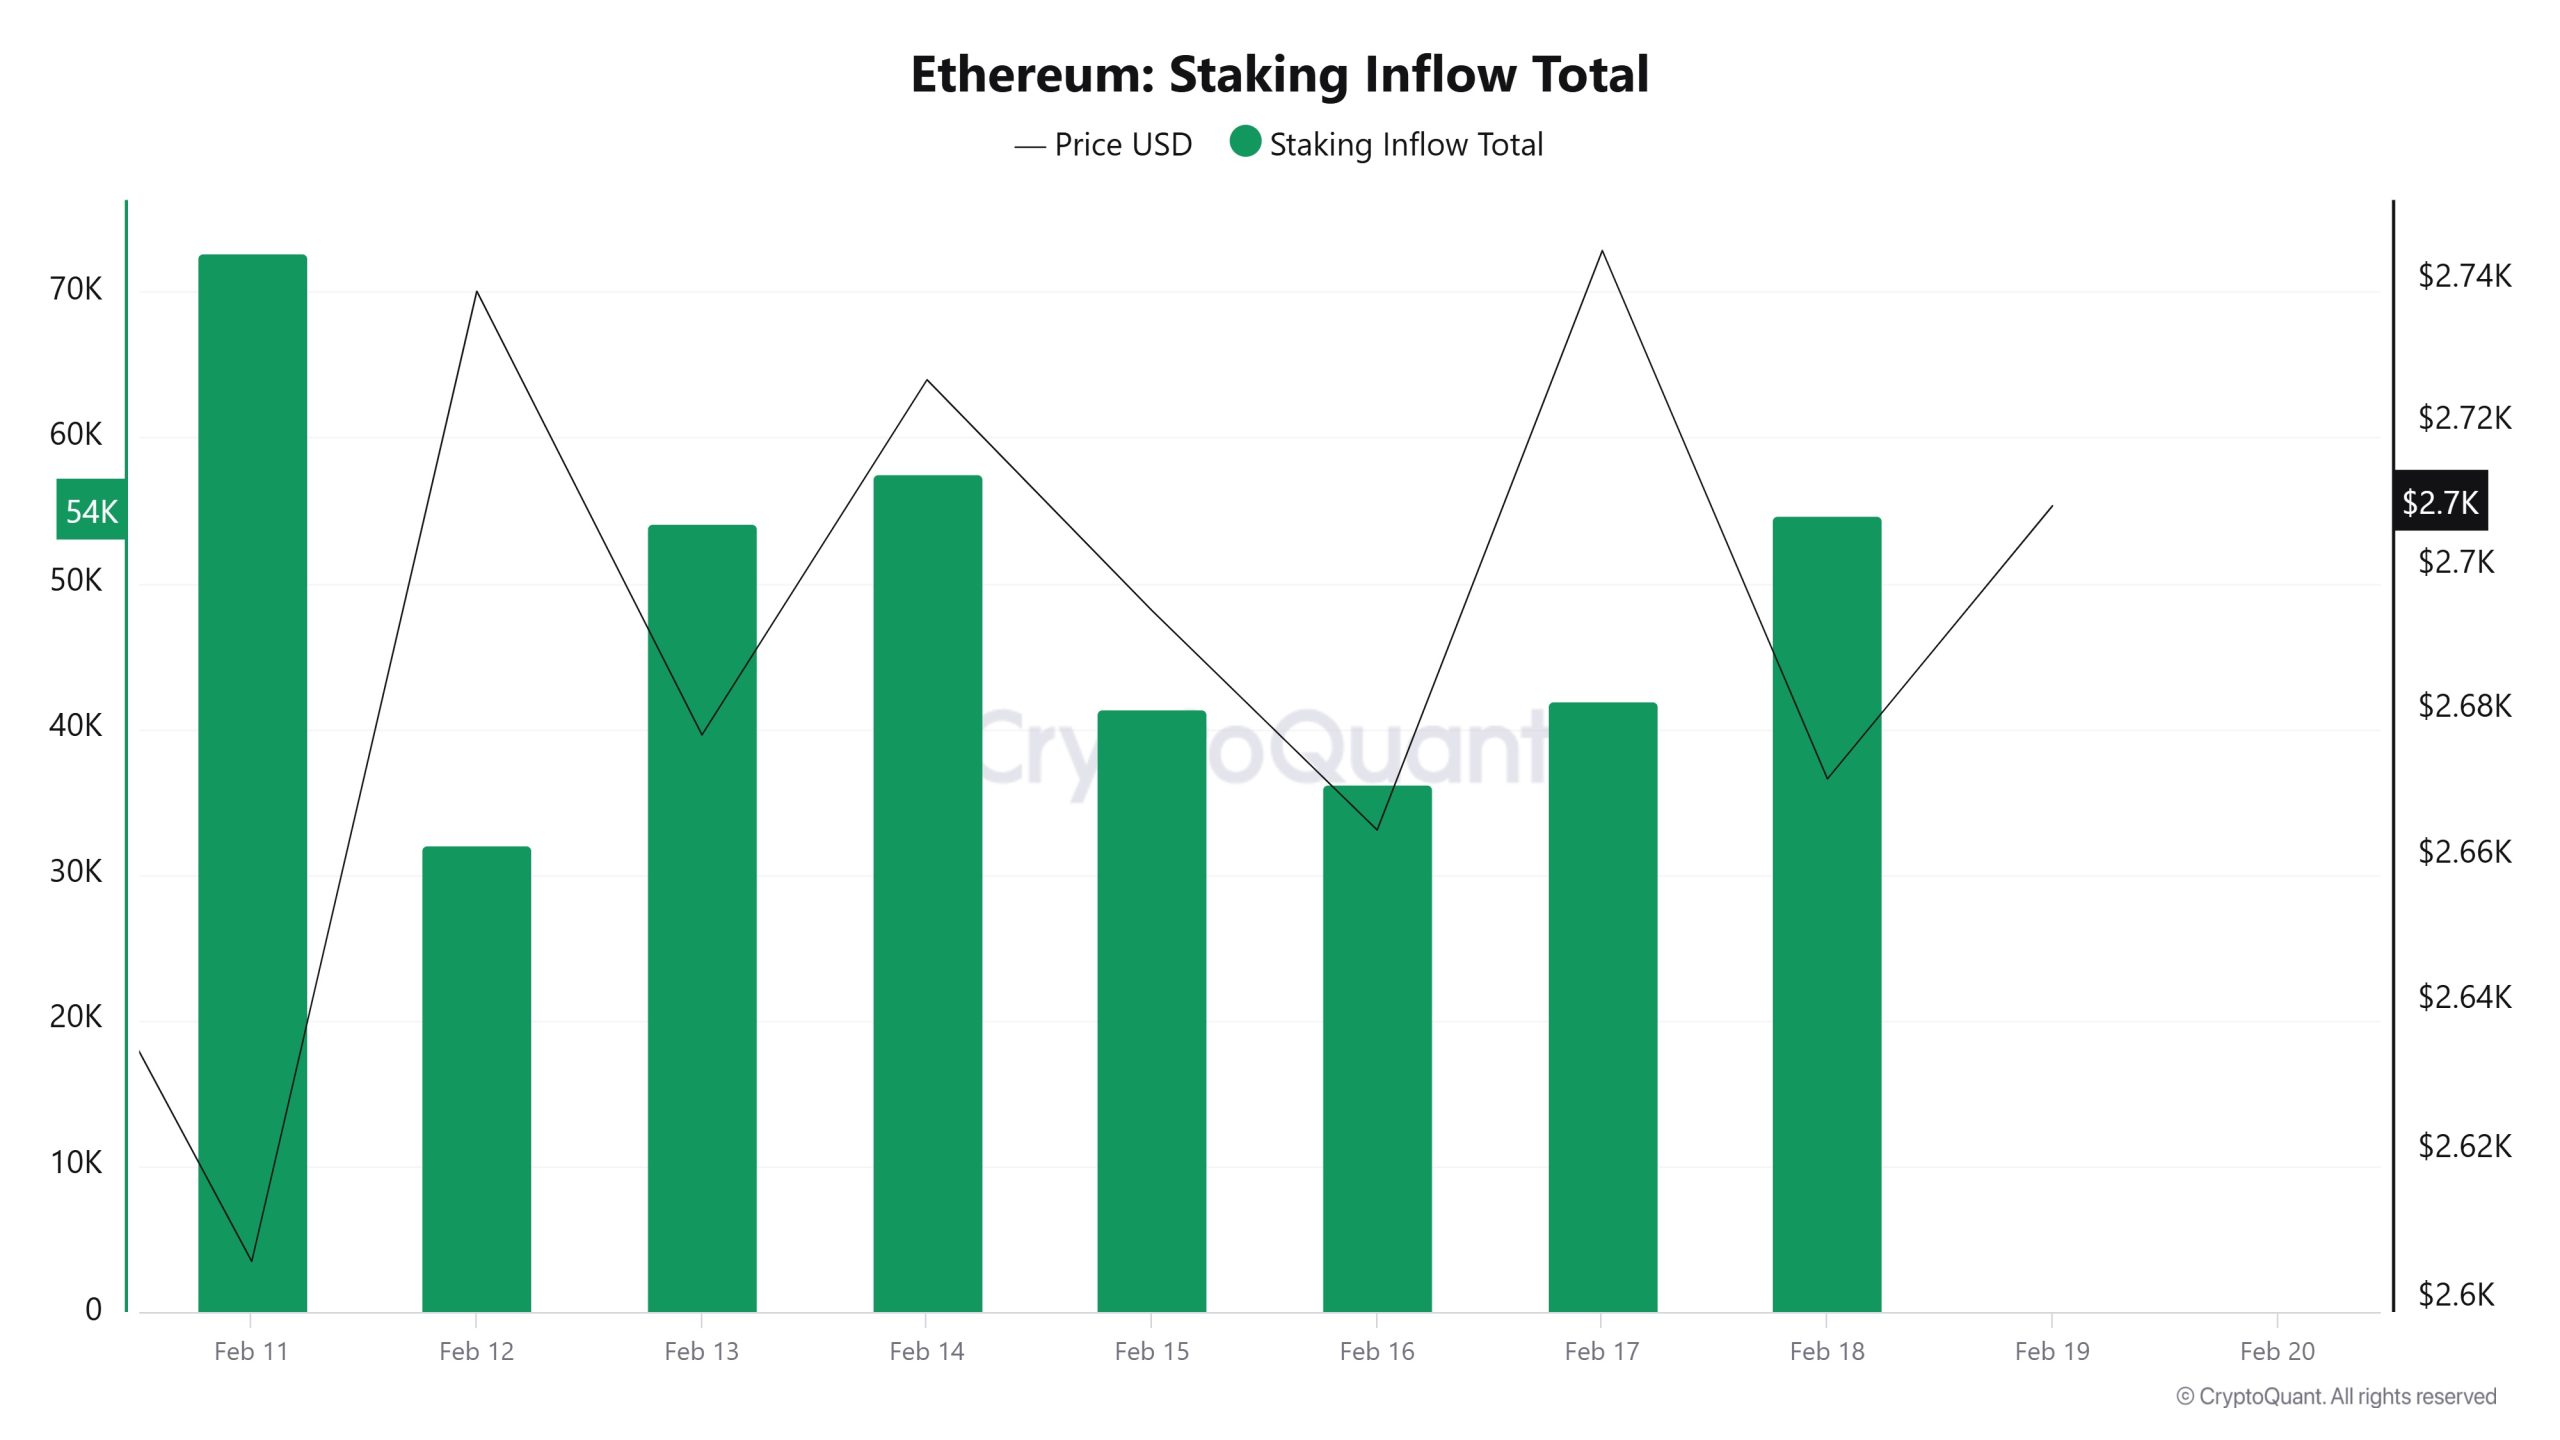
On Şubat 12, ETH price was at 2,738 while Staking Inflow Ratio was 32,059. As of Şubat 18, ETH price was down to 2,670 while Staking Inflow Ratio was 54,708. Compared to last week, ETH price decreased by 2.48% and Staking Inflow Ratio increased by 70.65%.
Türevler
Açık Faiz
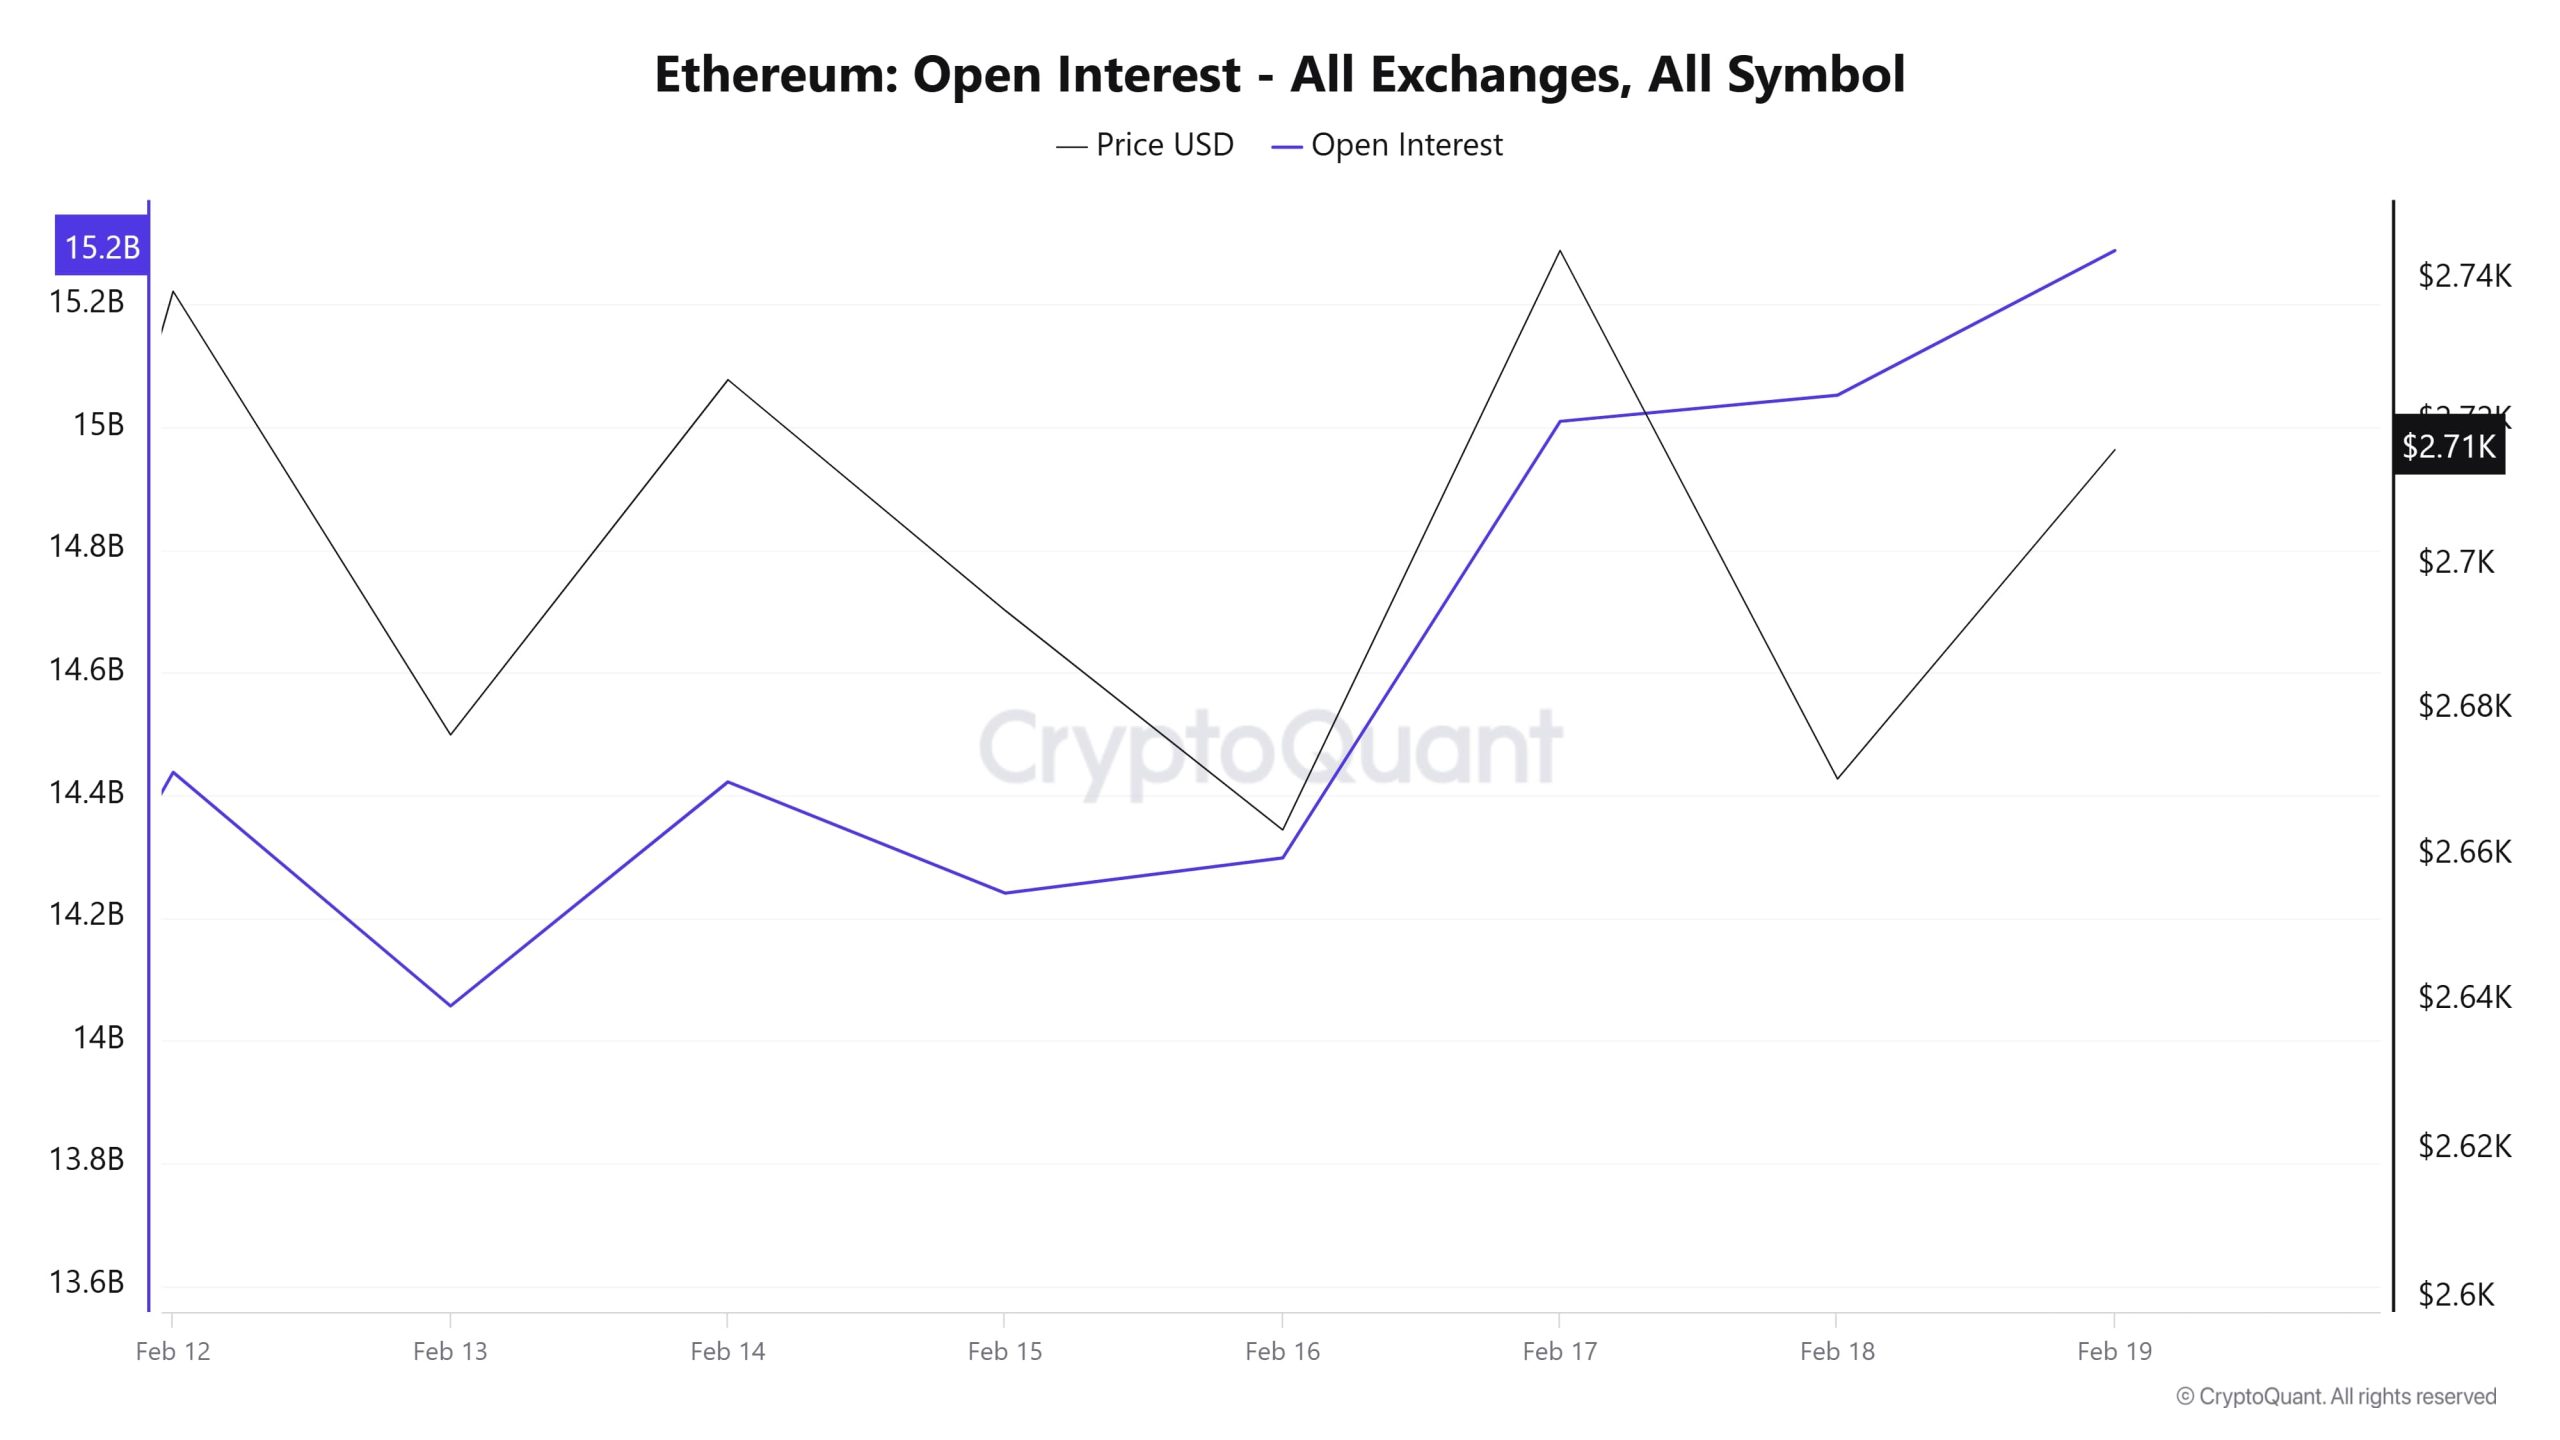
In Şubat, open positions start at $14.4 billion and after a short-lived decline, they fall to $14 billion on Şubat 13. As of Şubat 14, it started to rise again and reached USD 14.4 billion. On Şubat 15 and 16, open positions declined slightly, but started to recover after Şubat 16. In this process, open positions started to rise from USD 13.8 billion and reached USD 14.8 billion on Şubat 17. On Şubat 18, as the price declined, there was a slight decline in open positions, but as of Şubat 19, open positions increased again, reaching $15.2 billion. Parallel movements between ETH price and open positions are noteworthy.
Funding Rate
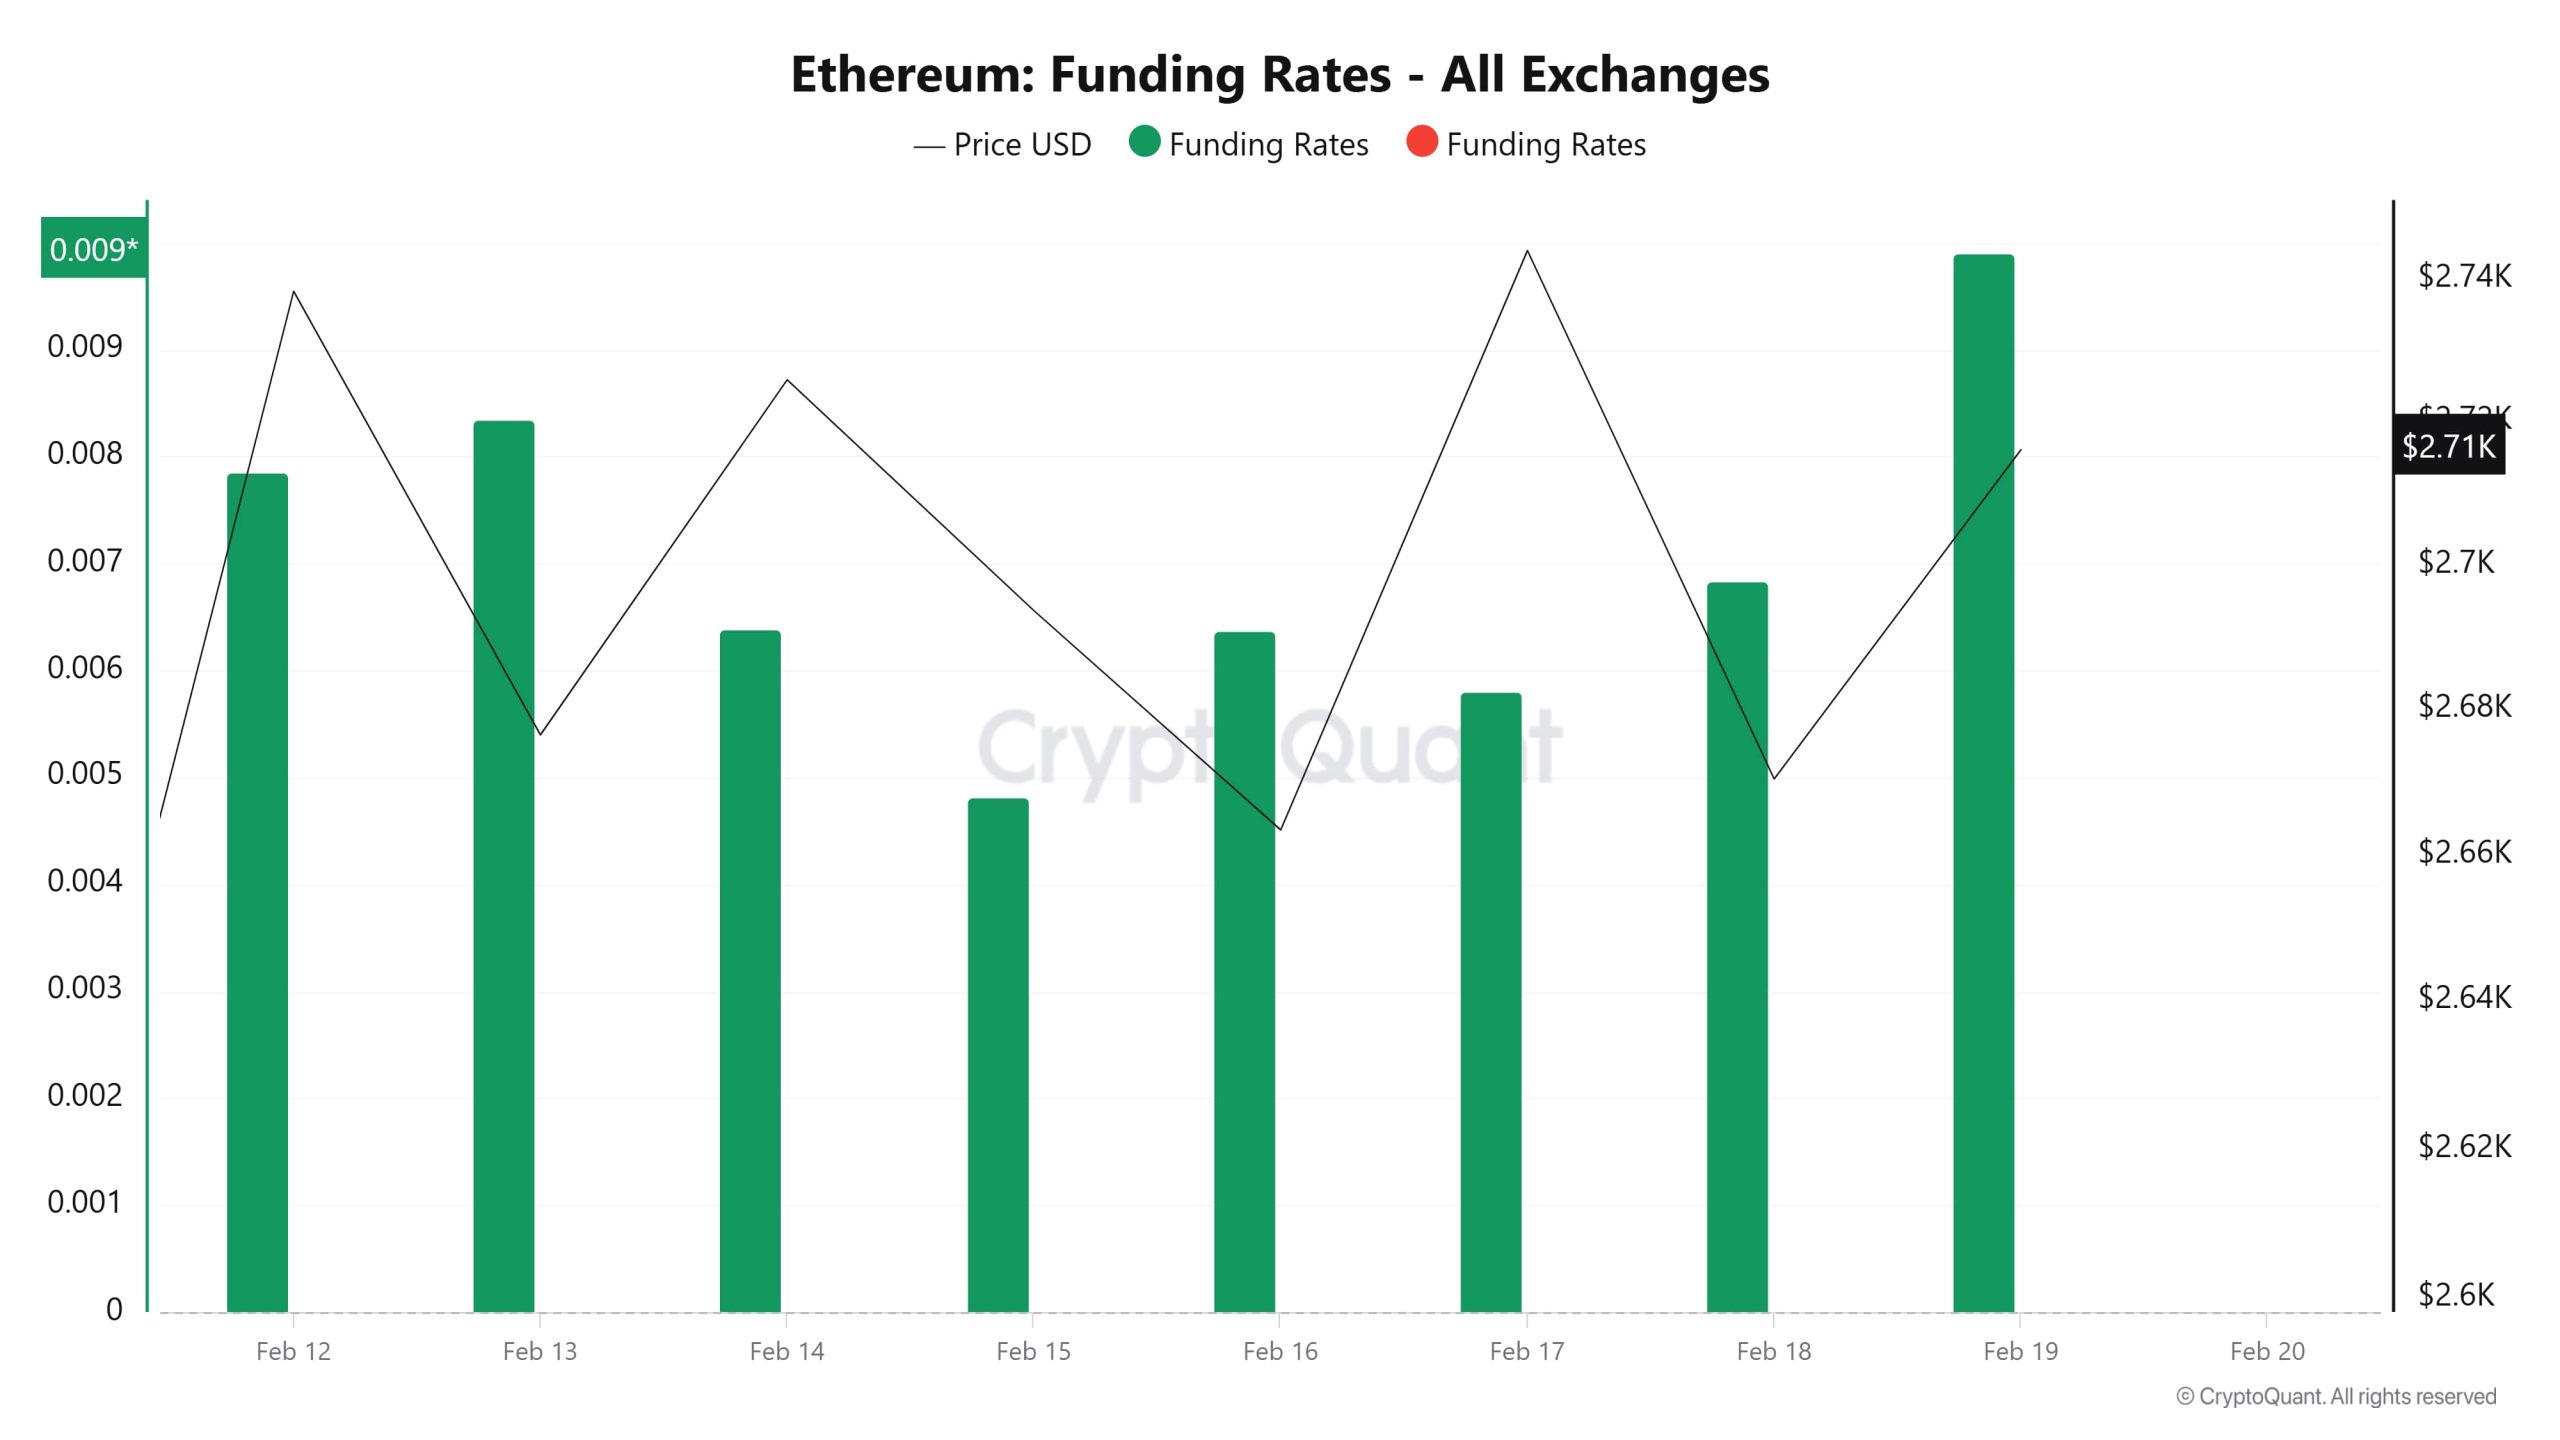
As of Şubat 12, the funding rate starts at 0.007 and reaches a high of 0.009 as prices rise. However, as of Şubat 13, the funding rate declined to 0.005. On Şubat 14 and 15, funding rates hovered at relatively low levels and then rose again to 0.006 on Şubat 16. On Şubat 17 and 18, funding rates fluctuated slightly, but remained generally flat. As of Şubat 19, there is a significant increase in funding rates, rising as high as 0.009.The relationship between ETH price and funding rates is remarkable . When price movements decline, funding rates also decline, but as the price recovers, funding rates also rise. This shows that the declines come with short positions.
Uzun ve Kısa Tasfiyeler
ETH, which has been moving in a relatively narrow range for 15 days, has led to the liquidation of a long position of $ 149 million and a short position of $ 115 million with the declines and rises it experienced last week.
| Tarih | Uzun Tutar (Milyon $) | Kısa Tutar (Milyon $) |
|---|---|---|
| Ocak 12 | 47.42 | 33.87 |
| Ocak 13 | 16.72 | 6.72 |
| Ocak 14 | 12.10 | 13.49 |
| Ocak 15 | 6.38 | 3.10 |
| Ocak 16 | 9.52 | 2.63 |
| Ocak 17 | 21.57 | 43.21 |
| Ocak 18 | 35.90 | 12.05 |
| Toplam | 149.61 | 115.07 |
Tedarik Dağıtımı
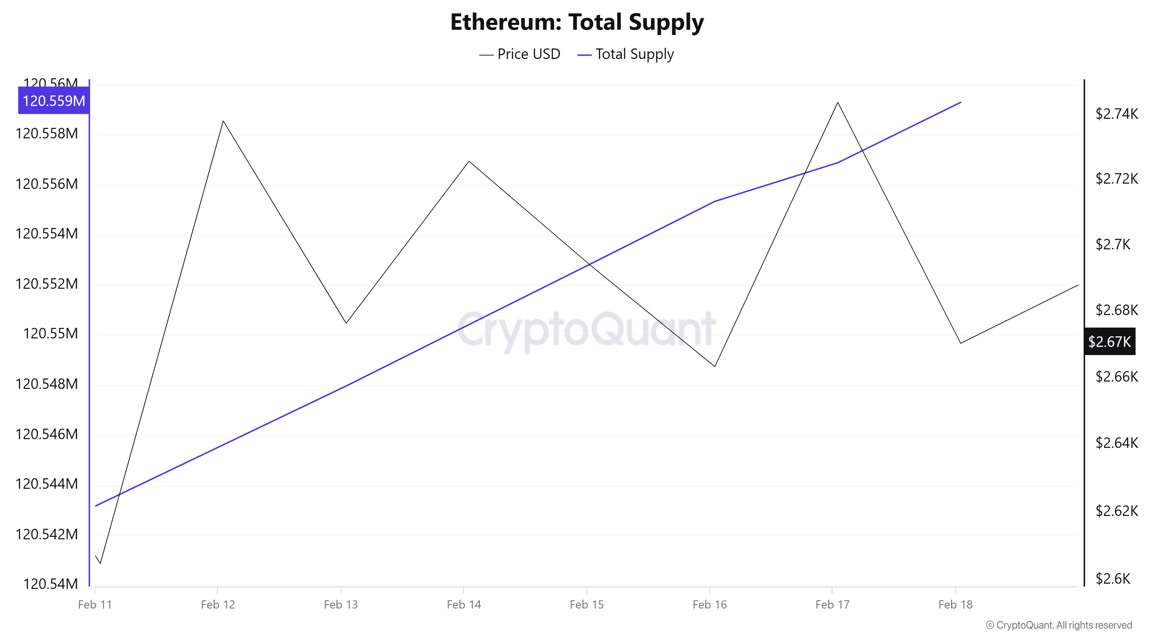
Total Supply: It reached 120,559,310 units, up about 0.01% from last week.
New Supply: The amount of ETH produced this week was 16,037.
Velocity: Velocity, which was 7.49 last week, was 7.51 as of Şubat 18.
| Cüzdan Kategorisi | 11.02.2025 | 18.02.2025 | Difference (Quantity) |
|---|---|---|---|
| 0 – 0.1 ETH | 5.22M | 5.22M | - |
| 0.1 – 10 ETH | 314.502K | 314.085K | -417 |
| 10 – 100 ETH | 42.054K | 42.153K | +99 |
| 100 – 10K ETH | 1.075K | 1.074K | -1 |
| 10K – 100K ETH | 91 | 92 | +1 |
In wallet sizes, there was a 417 decrease in the “0.1 – 10 ETH” category, while there was an increase of 99 in the “10 – 100 ETH” segment. There was an increase of 1 in the “10K – 100K ETH” category, which represents large investors.
Velocity rose to 7.51 as of Şubat 18, up from 7.49 last week. This indicates a slight increase in Ethereum’s circulation rate and a slight increase in market activity.
Döviz Rezervi
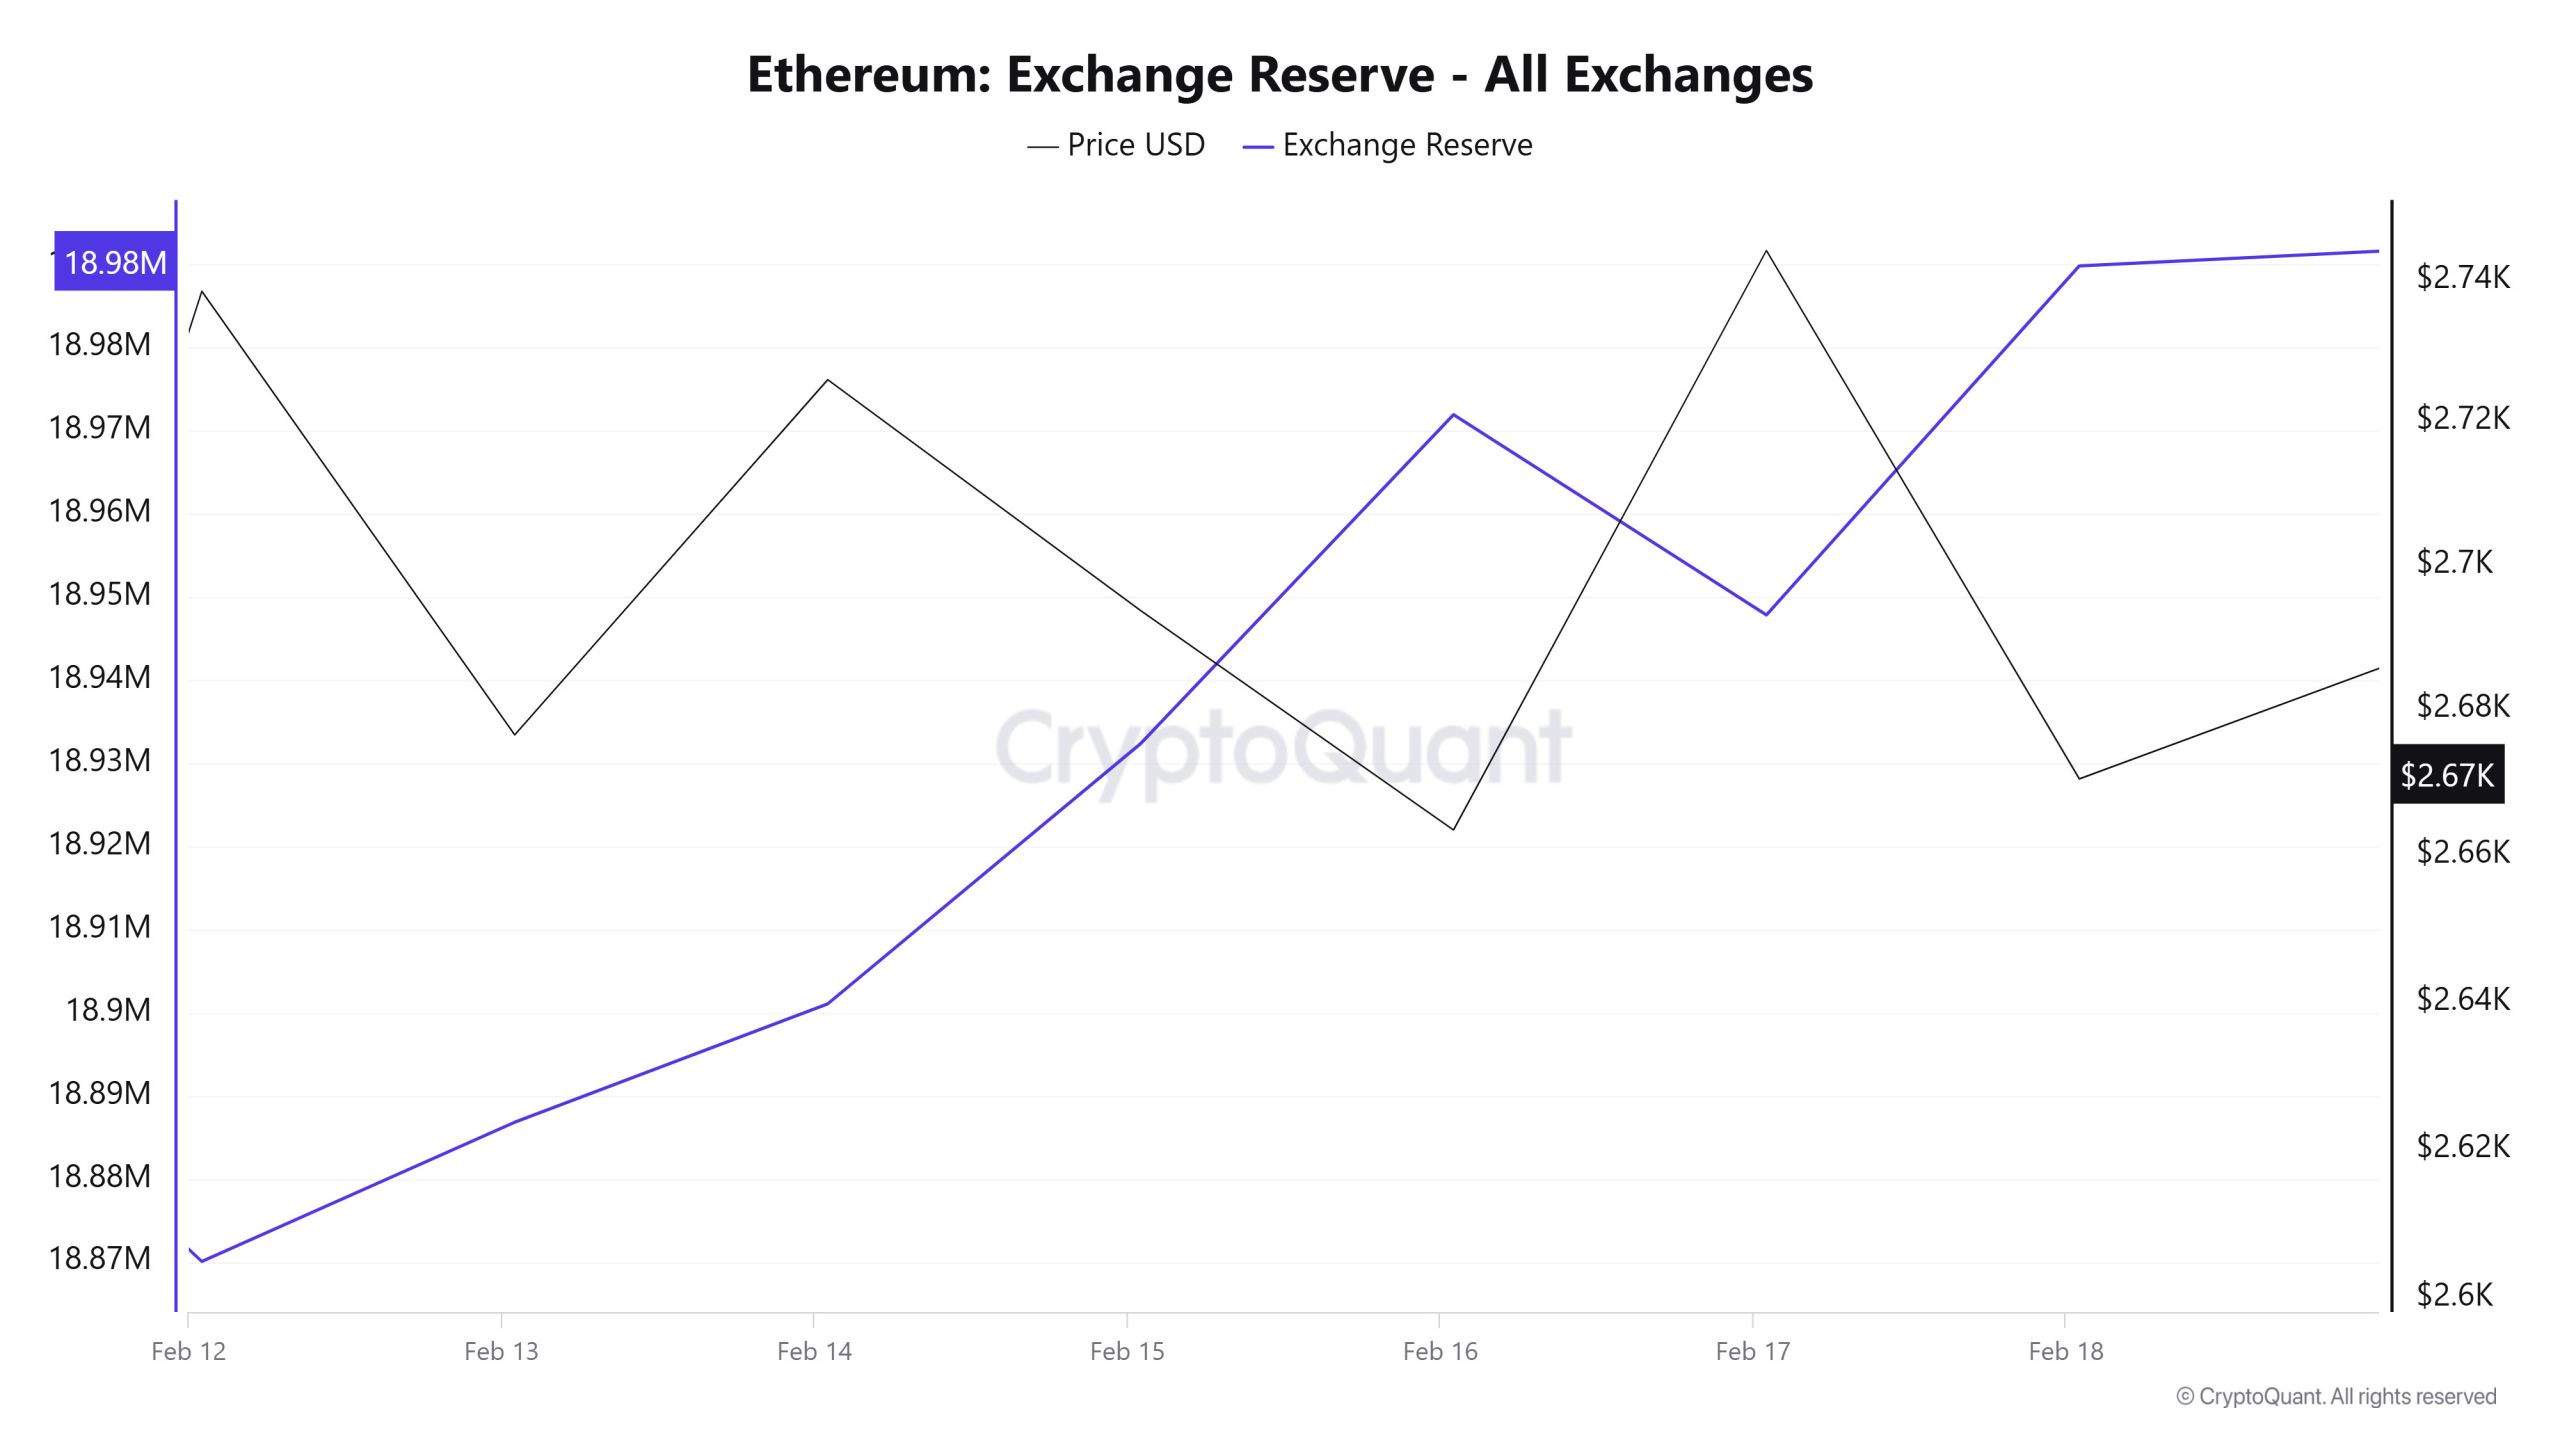
Between Şubat 12-18, 2025, Ethereum reserves on exchanges increased from 18,870,036 ETH to 18,989,815 ETH. During this period, there was a total net inflow of 119,779 ETH and the Ethereum reserves of exchanges increased by 0.63%. The Ethereum price decreased by approximately 2.5% during this period. On Şubat 12, 2025, Ethereum closed at $2,738, and on Şubat 18, 2025, it closed at $2,670.
| Tarih | 12-Feb | 13-Feb | 14-Feb | 15-Feb | 16-Feb | 17-Feb | 18-Feb |
|---|---|---|---|---|---|---|---|
| Exchange Inflow | 902,274 | 829,827 | 863,241 | 326,267 | 395,860 | 516,728 | 697,444 |
| Exchange Outflow | 937,320 | 813,074 | 849,016 | 294,955 | 356,275 | 540,831 | 655,438 |
| Exchange Netflow | -35,046 | 16,753 | 14,226 | 31,312 | 39,585 | -24,103 | 42,006 |
| Döviz Rezervi | 18,870,036 | 18,886,789 | 18,901,015 | 18,932,327 | 18,971,912 | 18,947,809 | 18,989,815 |
| ETH Price | 2,738 | 2,676 | 2,726 | 2,694 | 2,663 | 2,744 | 2,670 |
Net inflows to the stock markets suggest that investors may be inclined to sell. In the short term, selling pressure may continue on the price. In the long run, if net outflows from the exchanges start again, this may have a positive impact on the ETH price.
Ücretler ve Gelirler
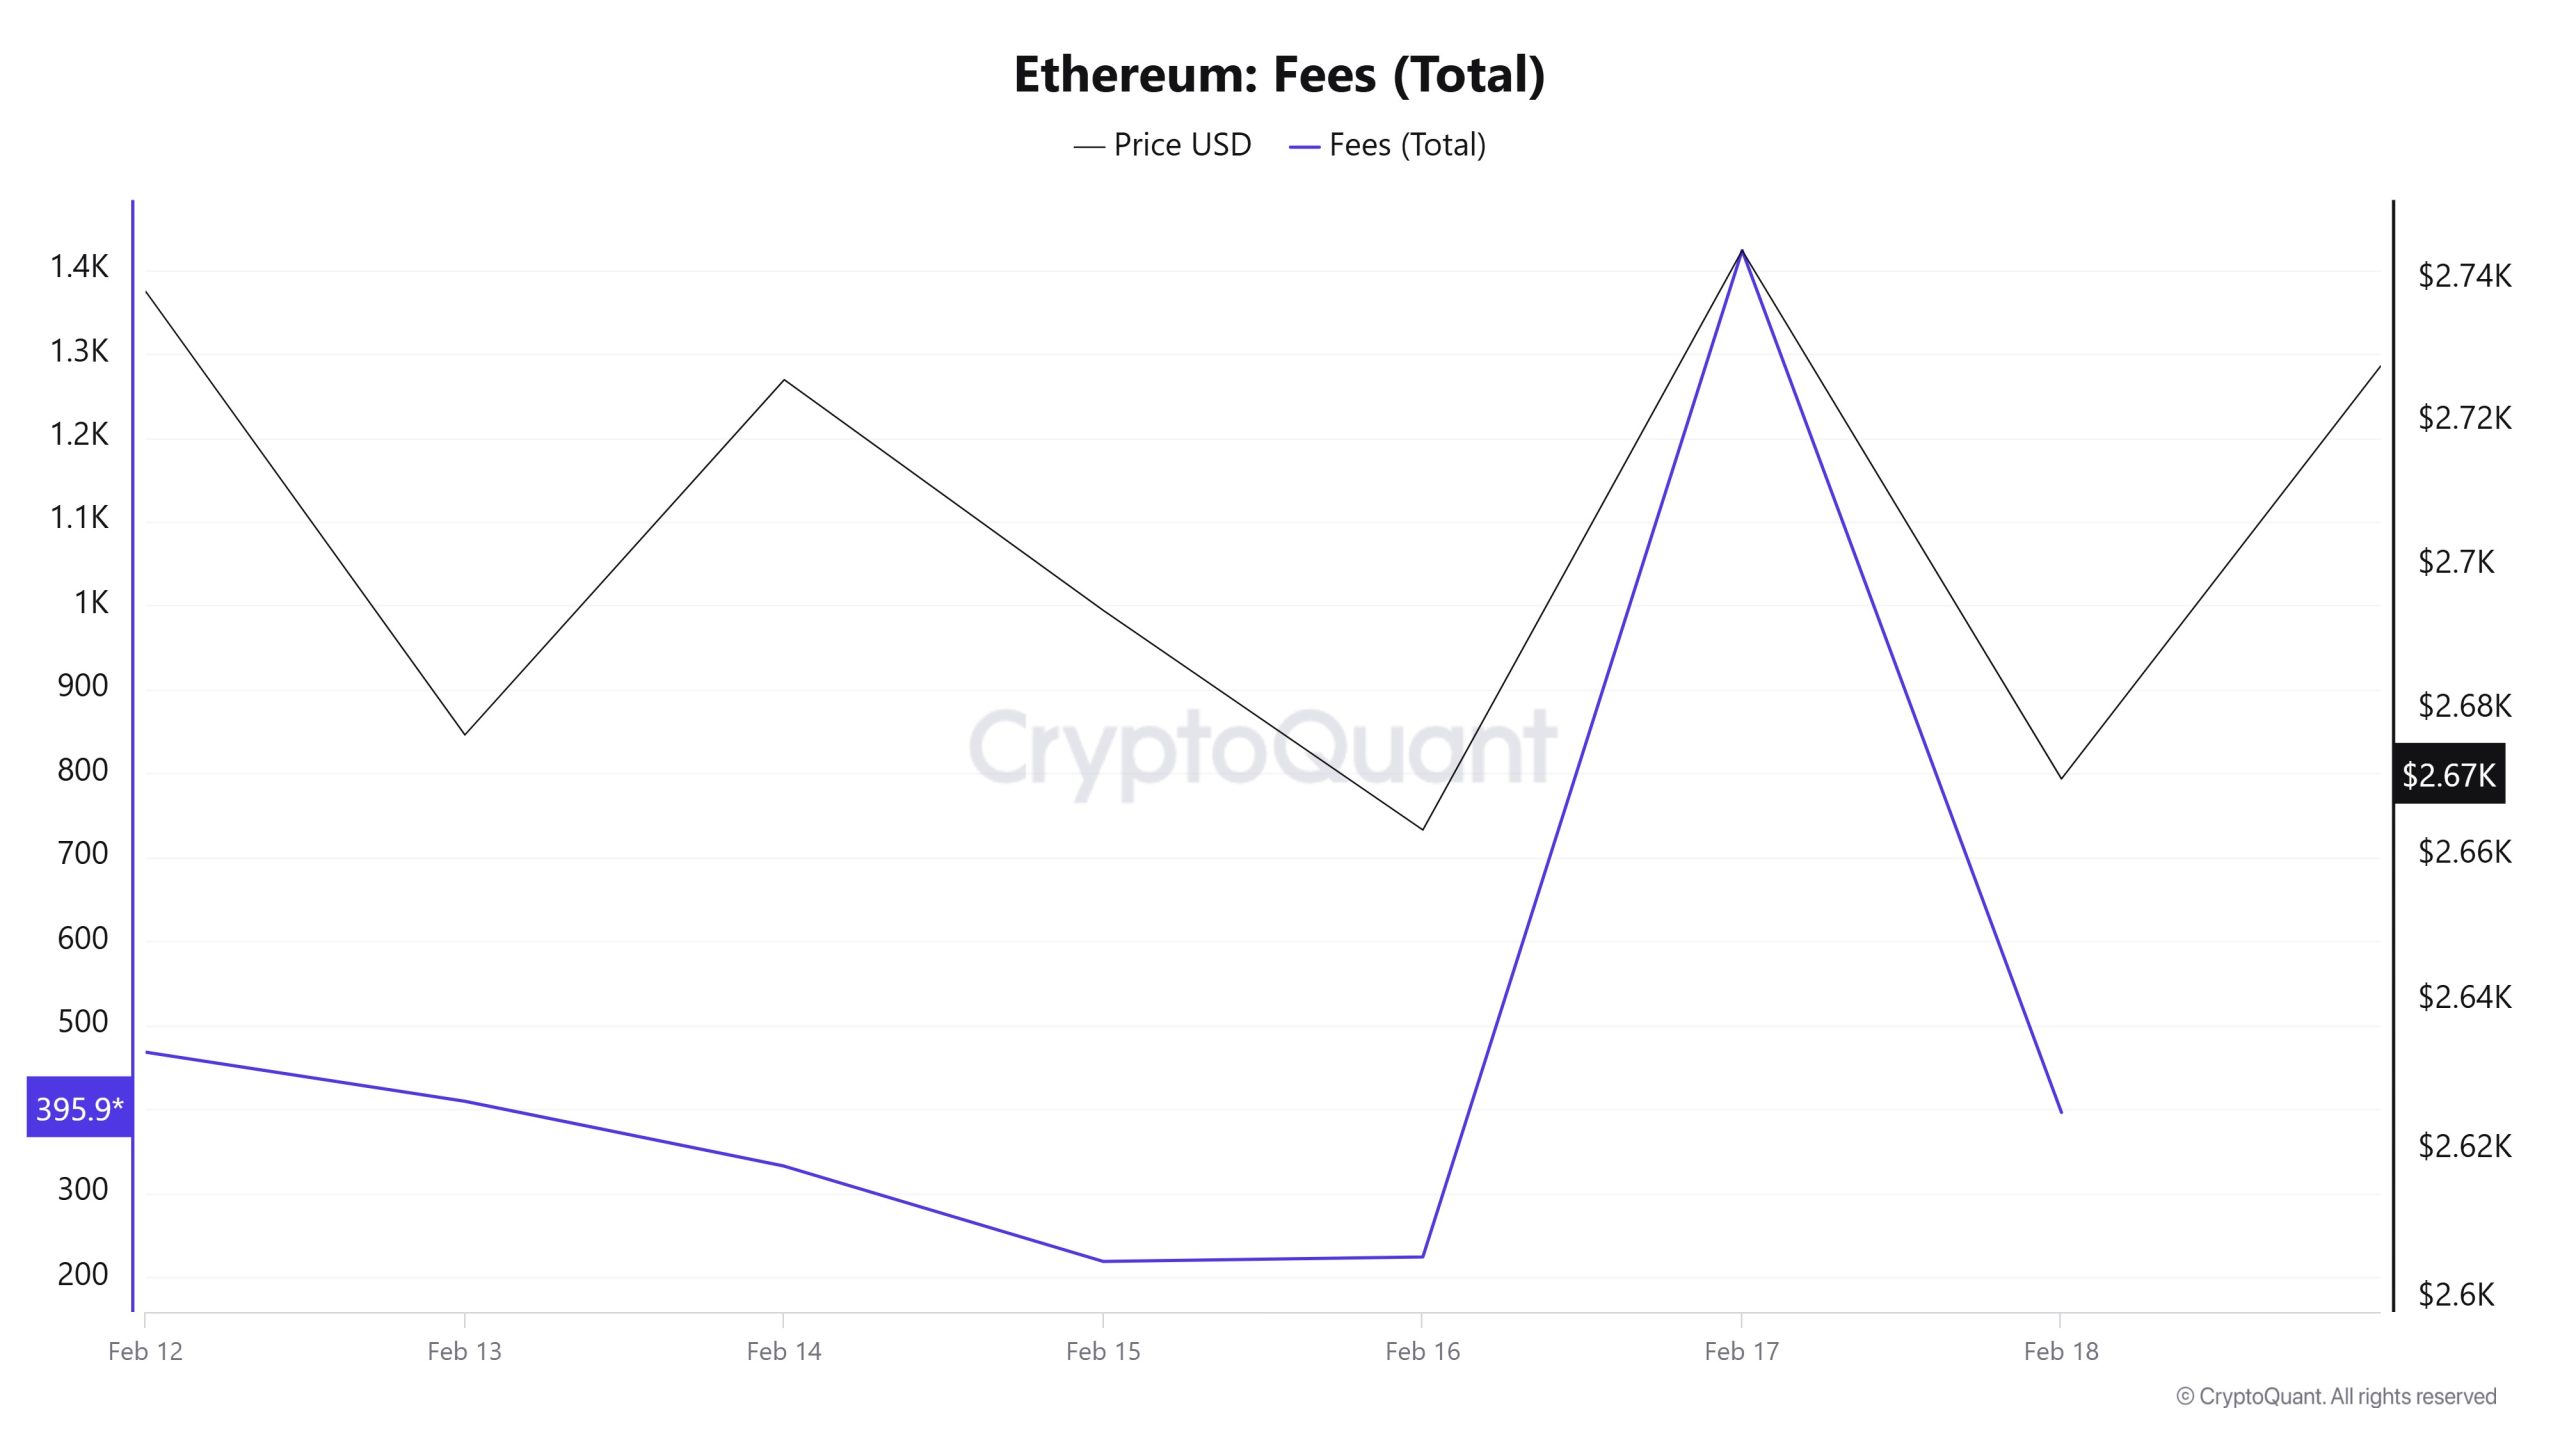
Between Şubat 12 and 18, when Ethereum Fees per Transaction (Mean) data was analyzed, it was seen that this value was at the level of 0.000366614833078185 on Şubat 12, the first day of the week. Until Şubat 16, the Fees per Transaction (Mean) value, which followed a slight downward trend until Şubat 16, rose to 0.001047855352764929 on Şubat 17, reaching the peak value of the week.
However, on Şubat 18, the last day of the weekly period, Fees per Transaction (Mean) declined and closed at 0.000301711019334307.
“ETH Fees (Total) Image to be Added”
Similarly, when Ethereum Fees (Total) data between Şubat 12-18 is analyzed, it is seen that this value was at 467.66671259369093 on Şubat 12, the first day of the week. Until Şubat 16, Fees (Total) followed a slight downward trend, reaching its highest value of the week on Şubat 17 at 1423,00538259577.
However, on Şubat 18, the last day of the weekly period, this value declined and closed at 395.9851529906008.
Blok Mayısısısınlı
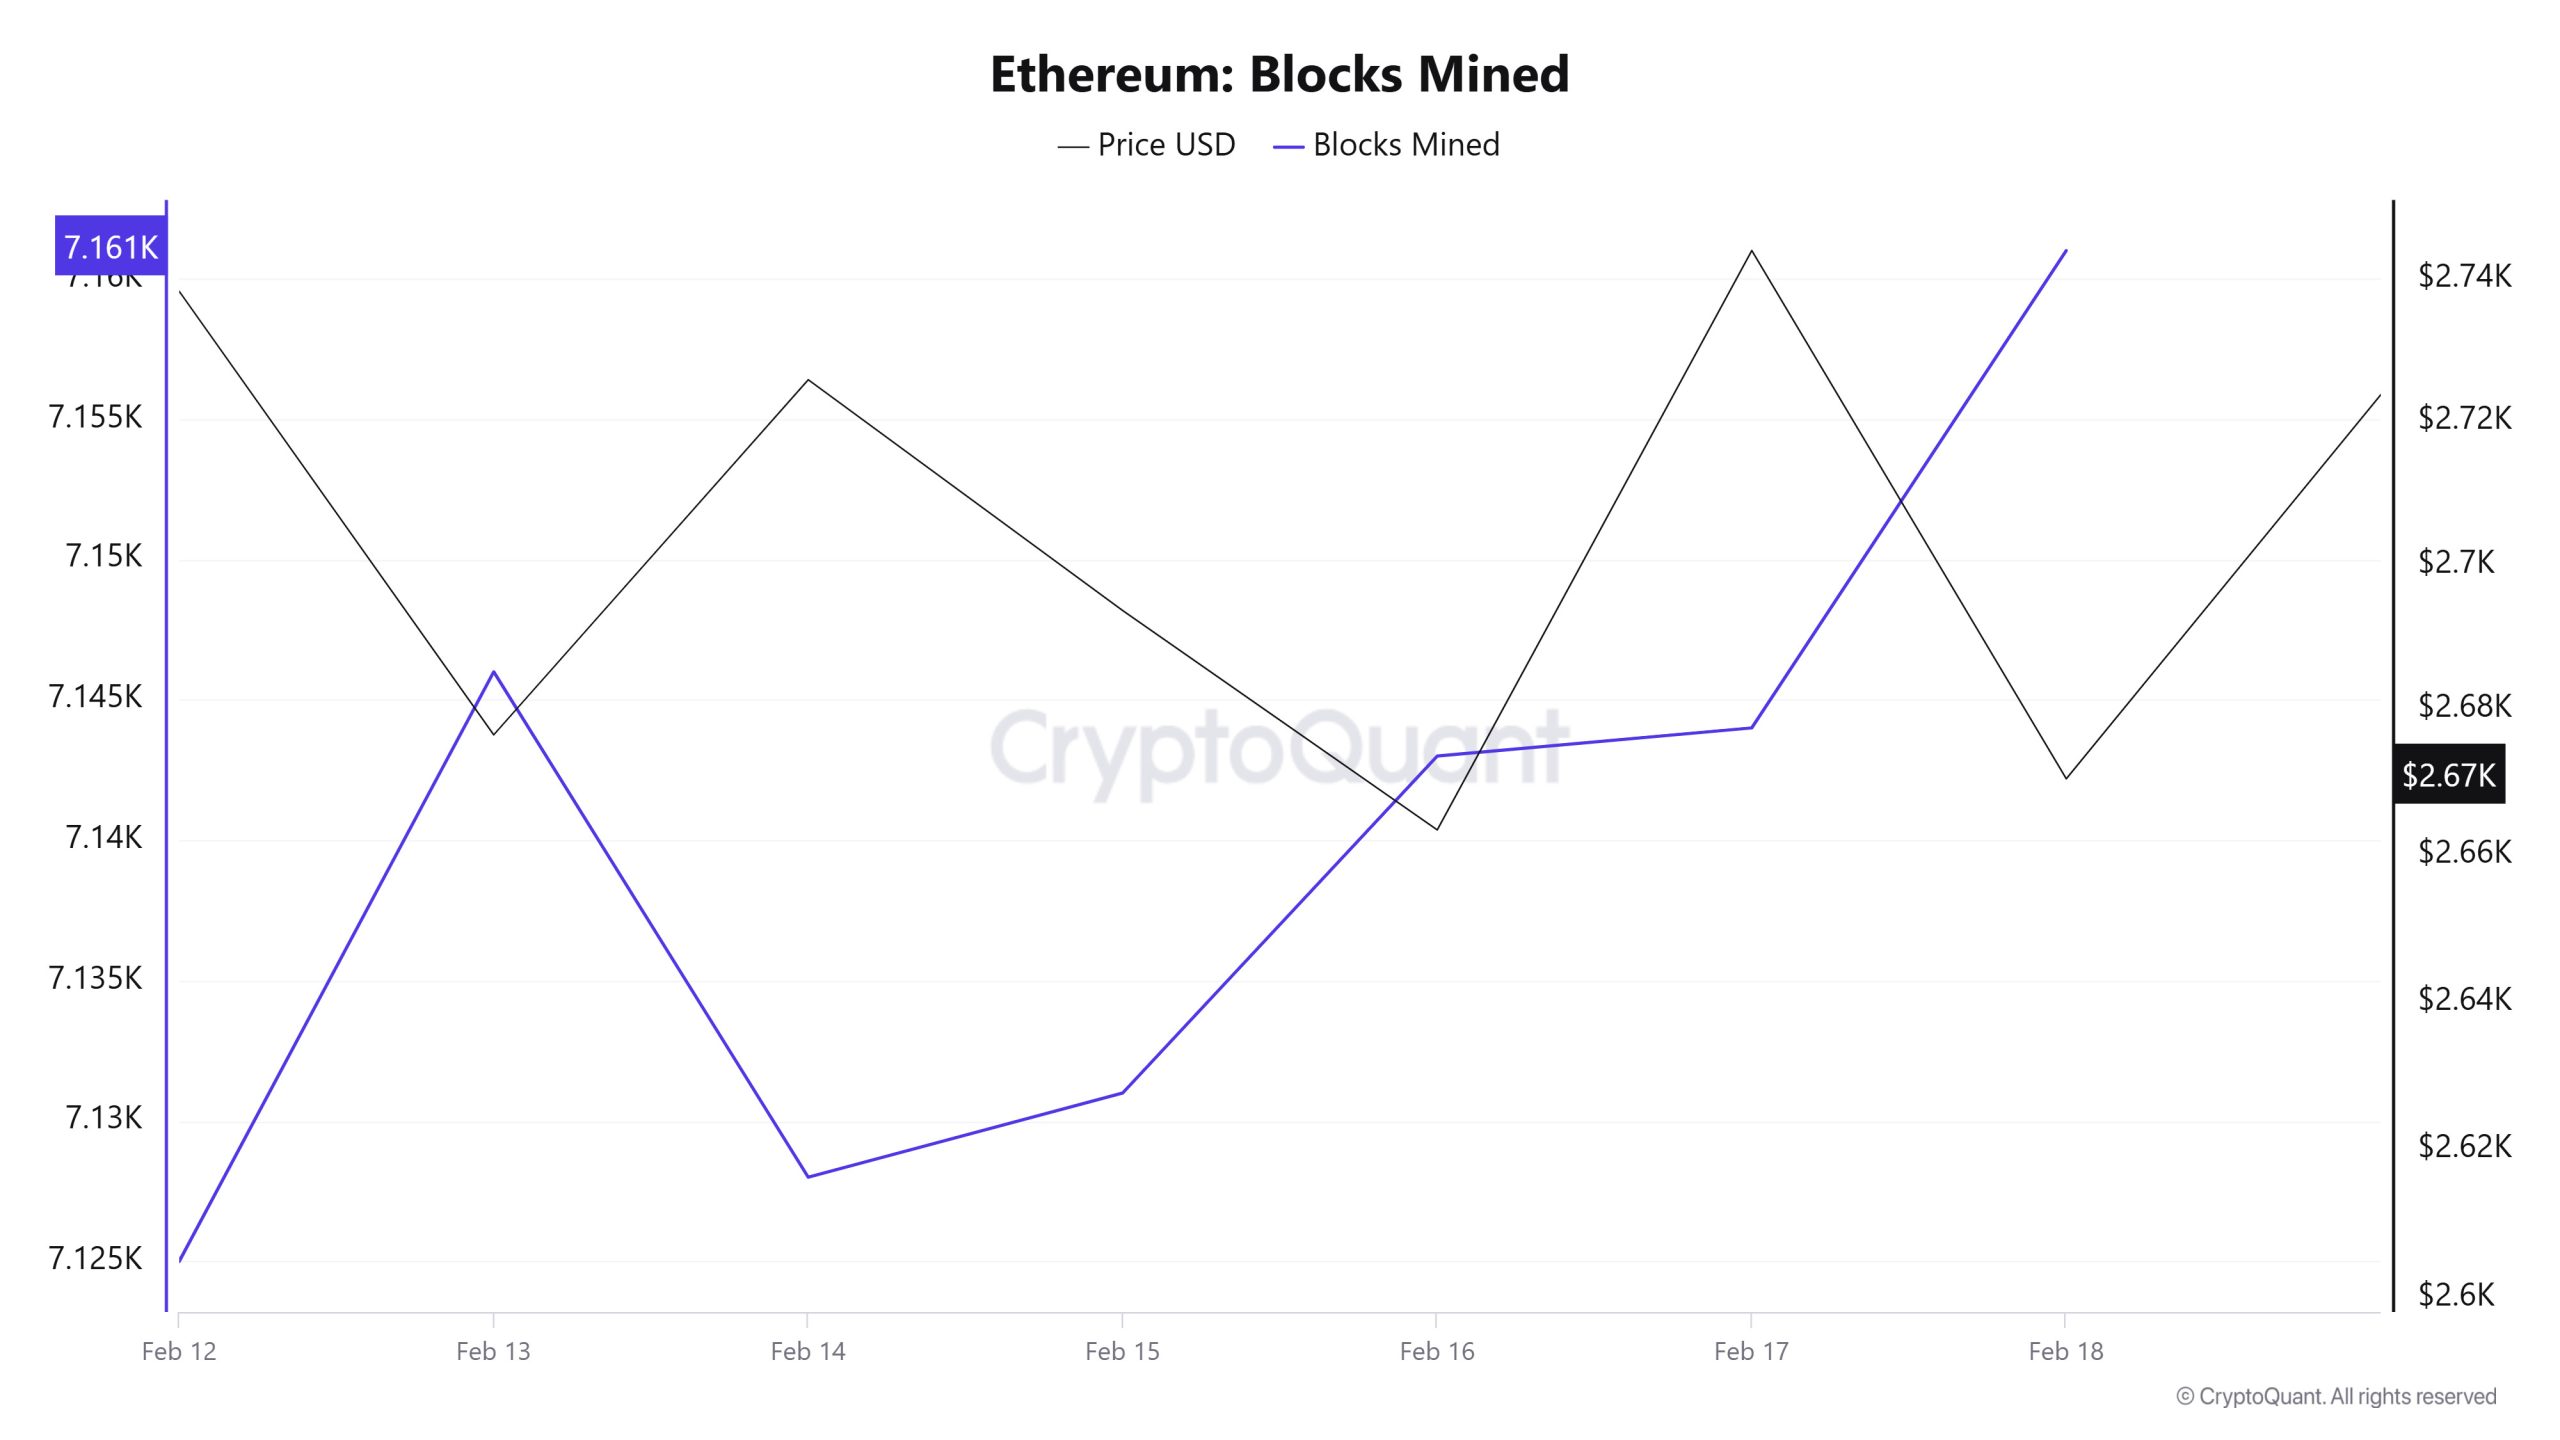
Between Şubat 12 and 18, when we examine the Ethereum Blocks Mined table, the number of blocks produced increased throughout the week. While 7,125 blocks were produced on Şubat 12, this number reached 7,161 blocks on Şubat 18. There was a negative correlation between Blocks Mined and Ethereum price during the week.
Blok Boyutu
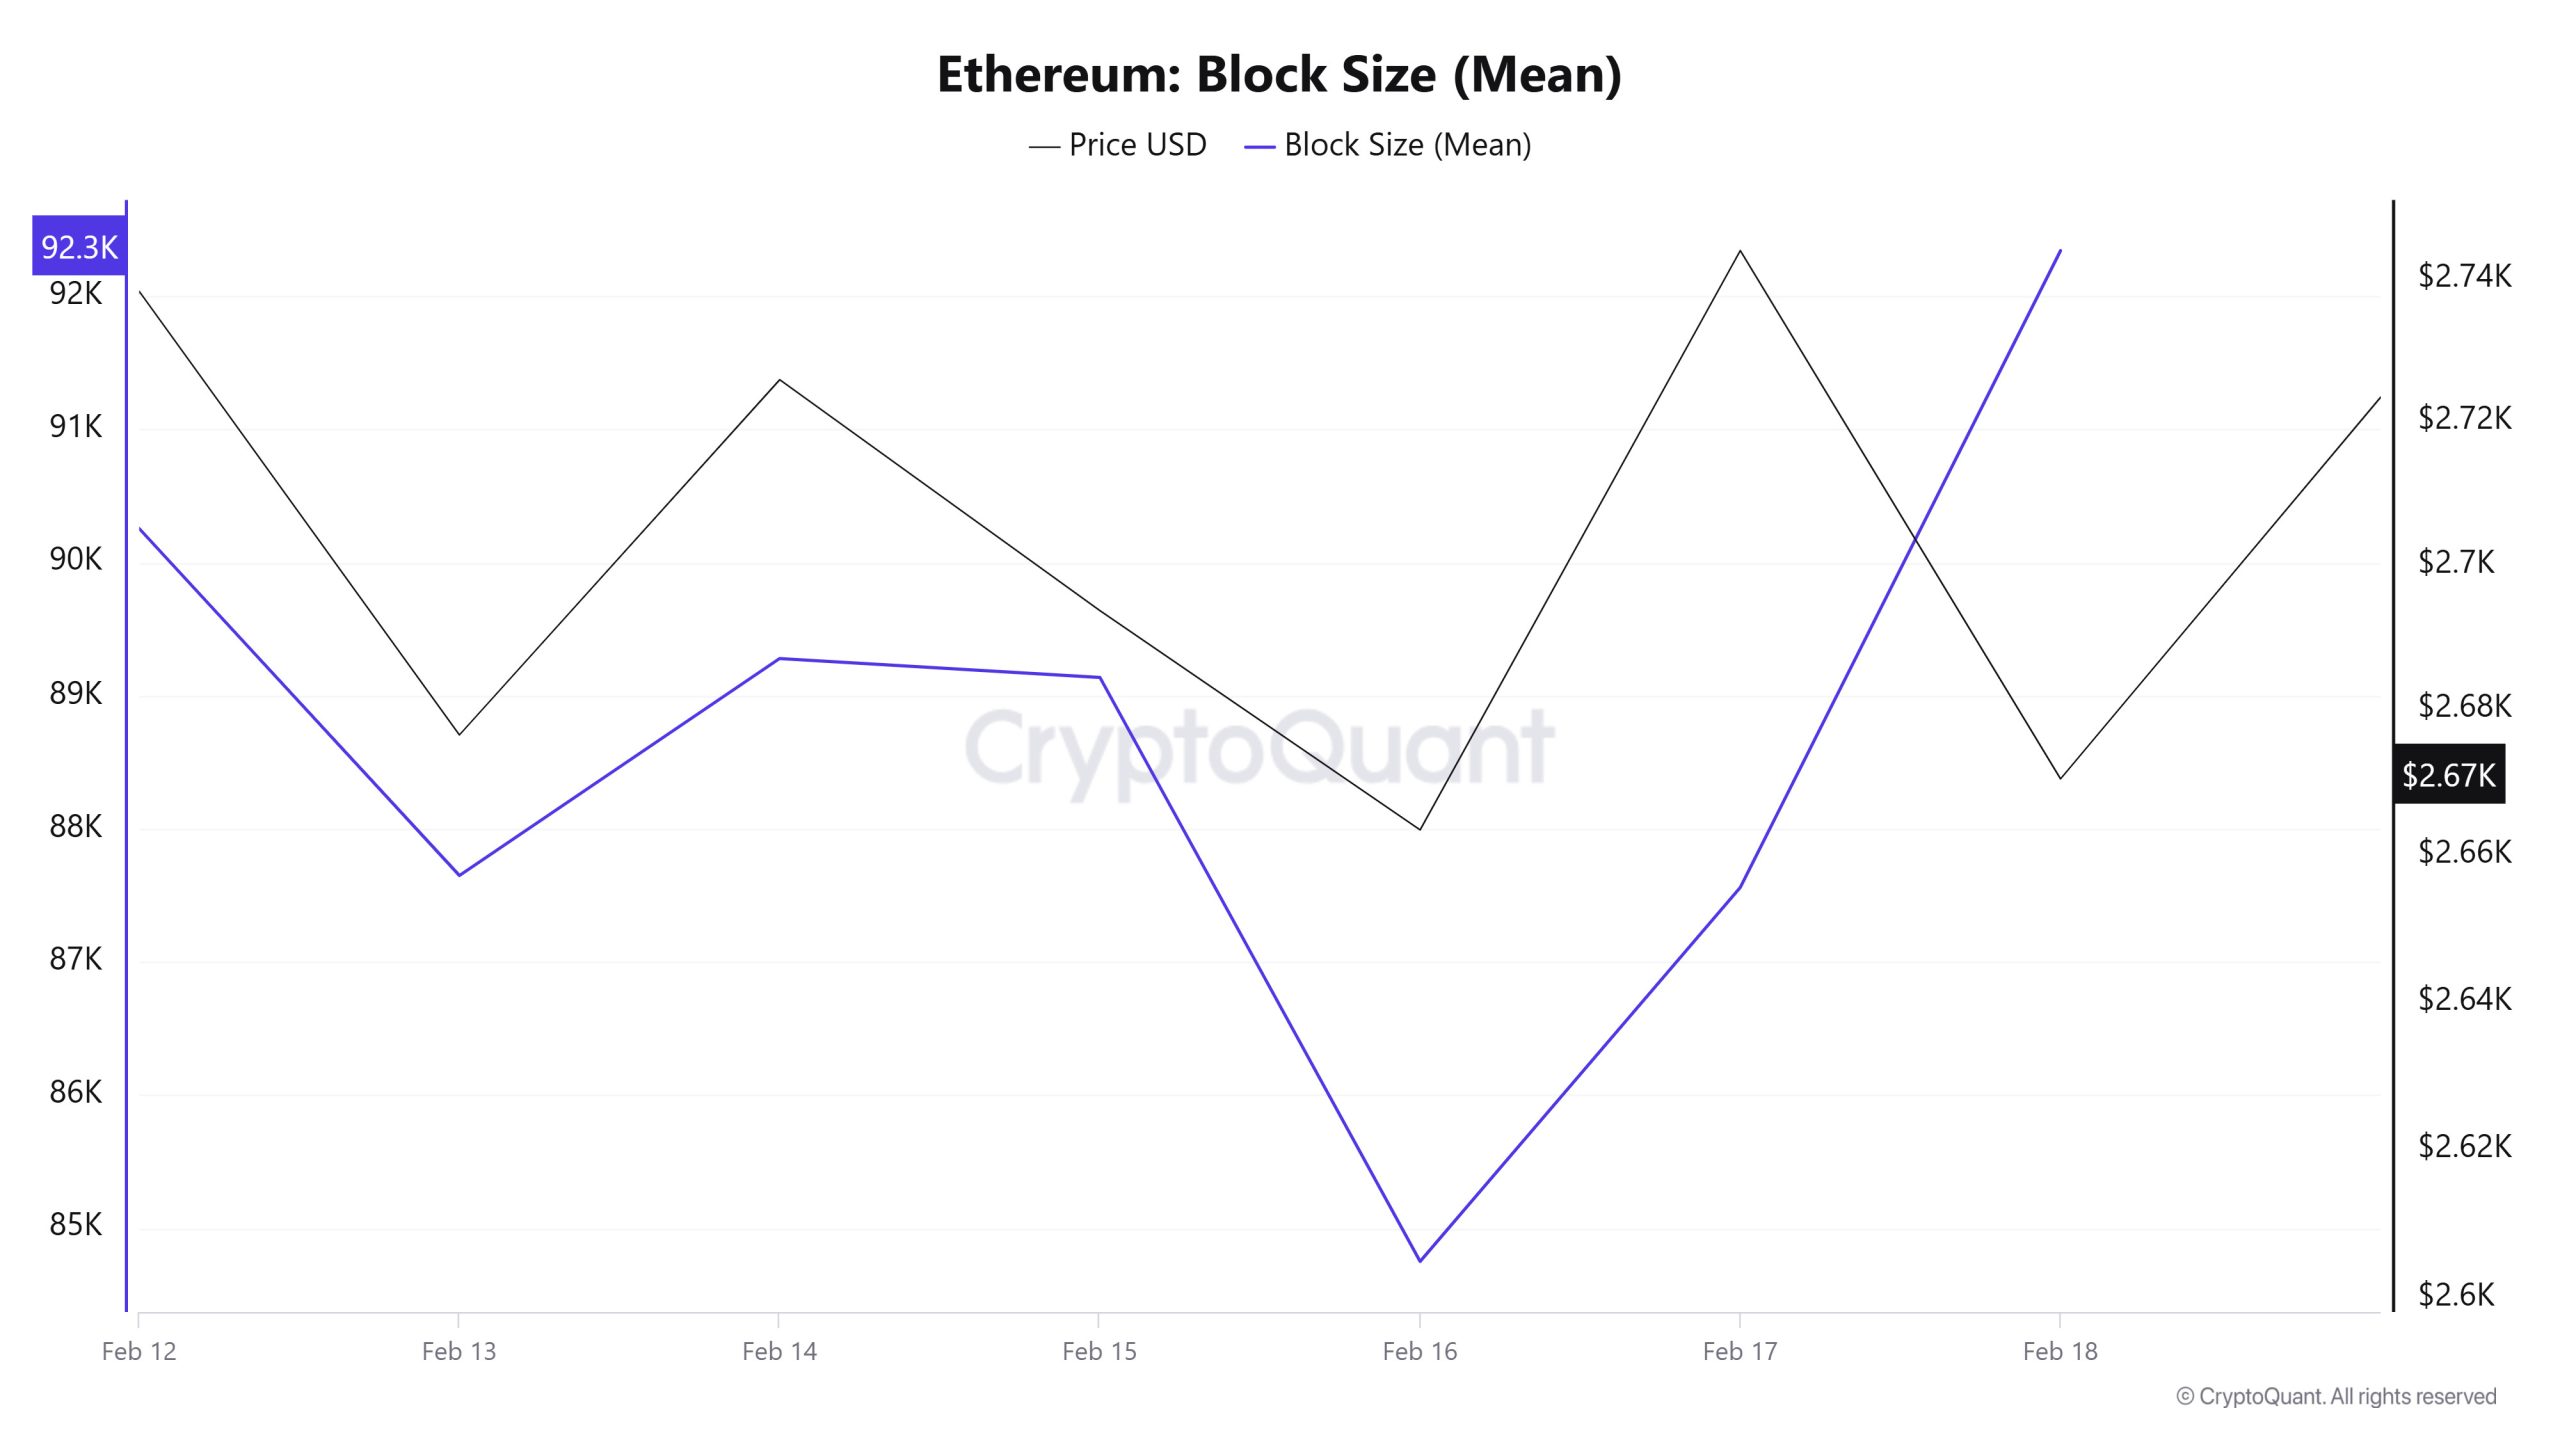
Between Şubat 12 and 18, when we examine the Ethereum Block Size table, after the decrease in block size towards the middle of the week, it increased towards the end of the week. From 90,256 bytes on Şubat 12, the block size reached 92,344 bytes on Şubat 18. There was a positive correlation between Block Size and Ethereum price during the week.
Blok Aralığı
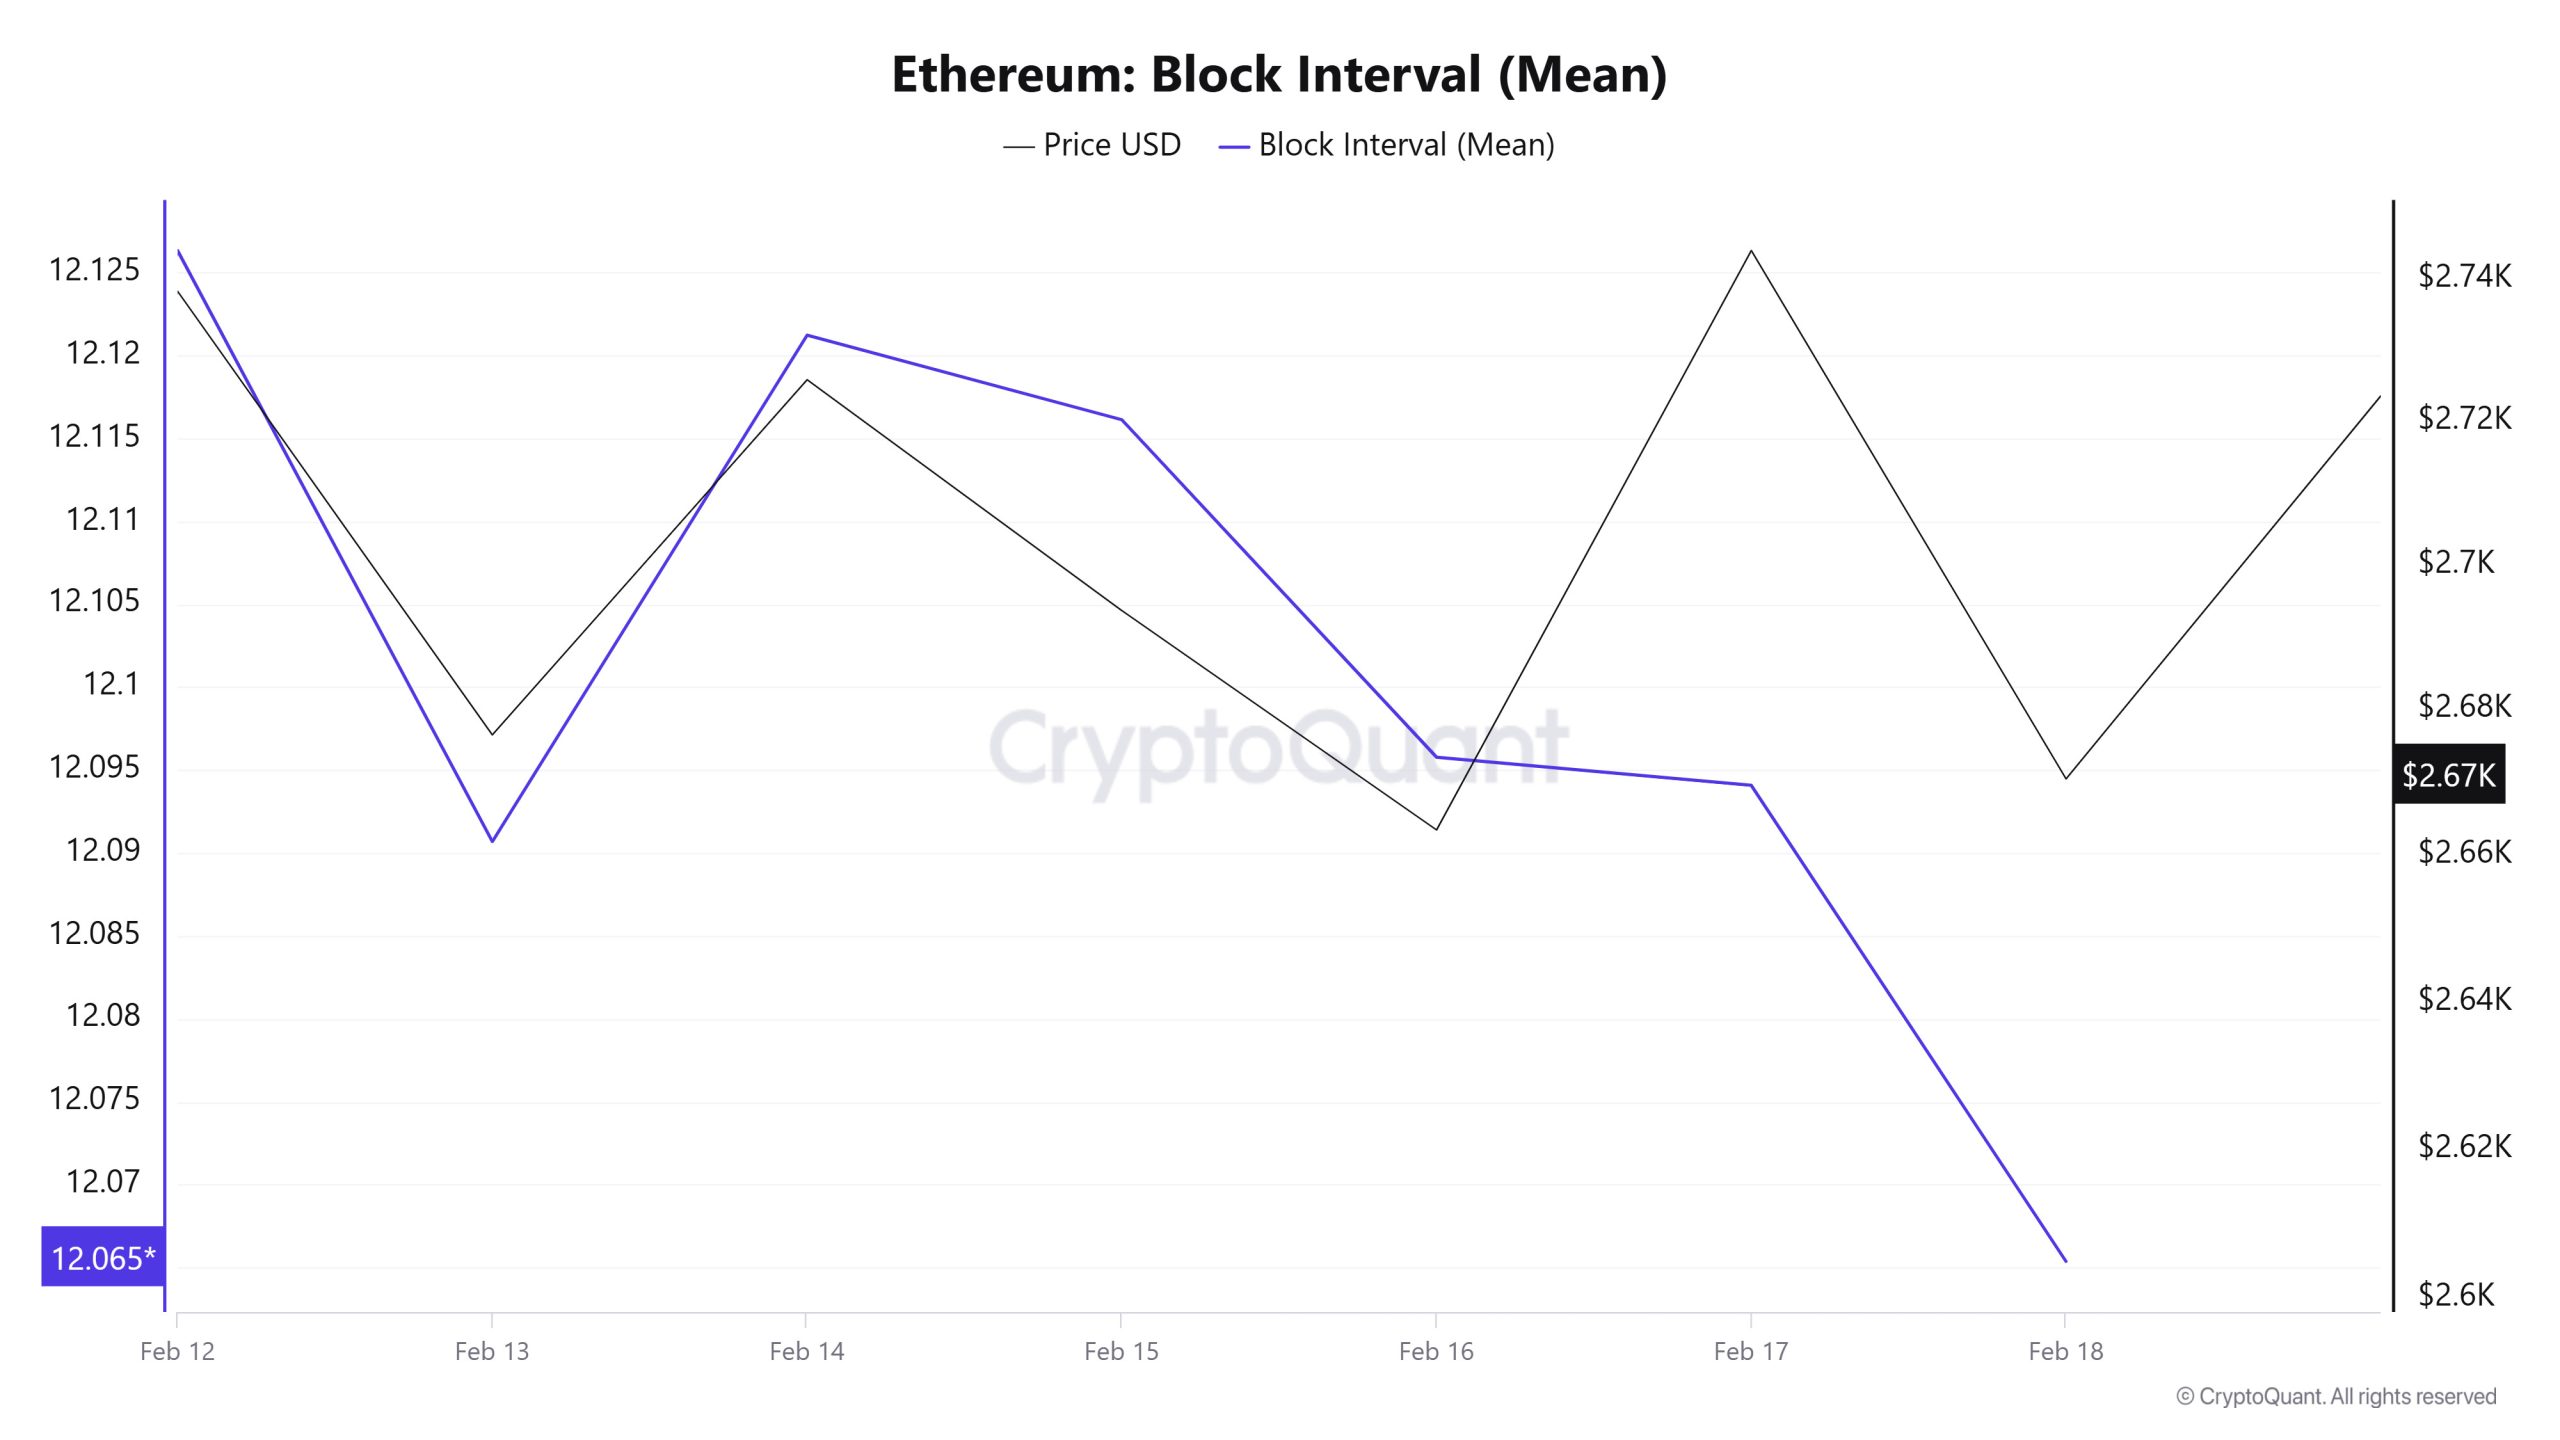
Between Şubat 12 and 18, when we examine the Ethereum Block Interval table, there was a decrease in the time between blocks throughout the week. On Şubat 12, the time between blocks was 12.12 seconds, which decreased to 12.06 seconds on Şubat 18. A positive correlation was observed between Block Interval and Ethereum price during the week.
Transaction
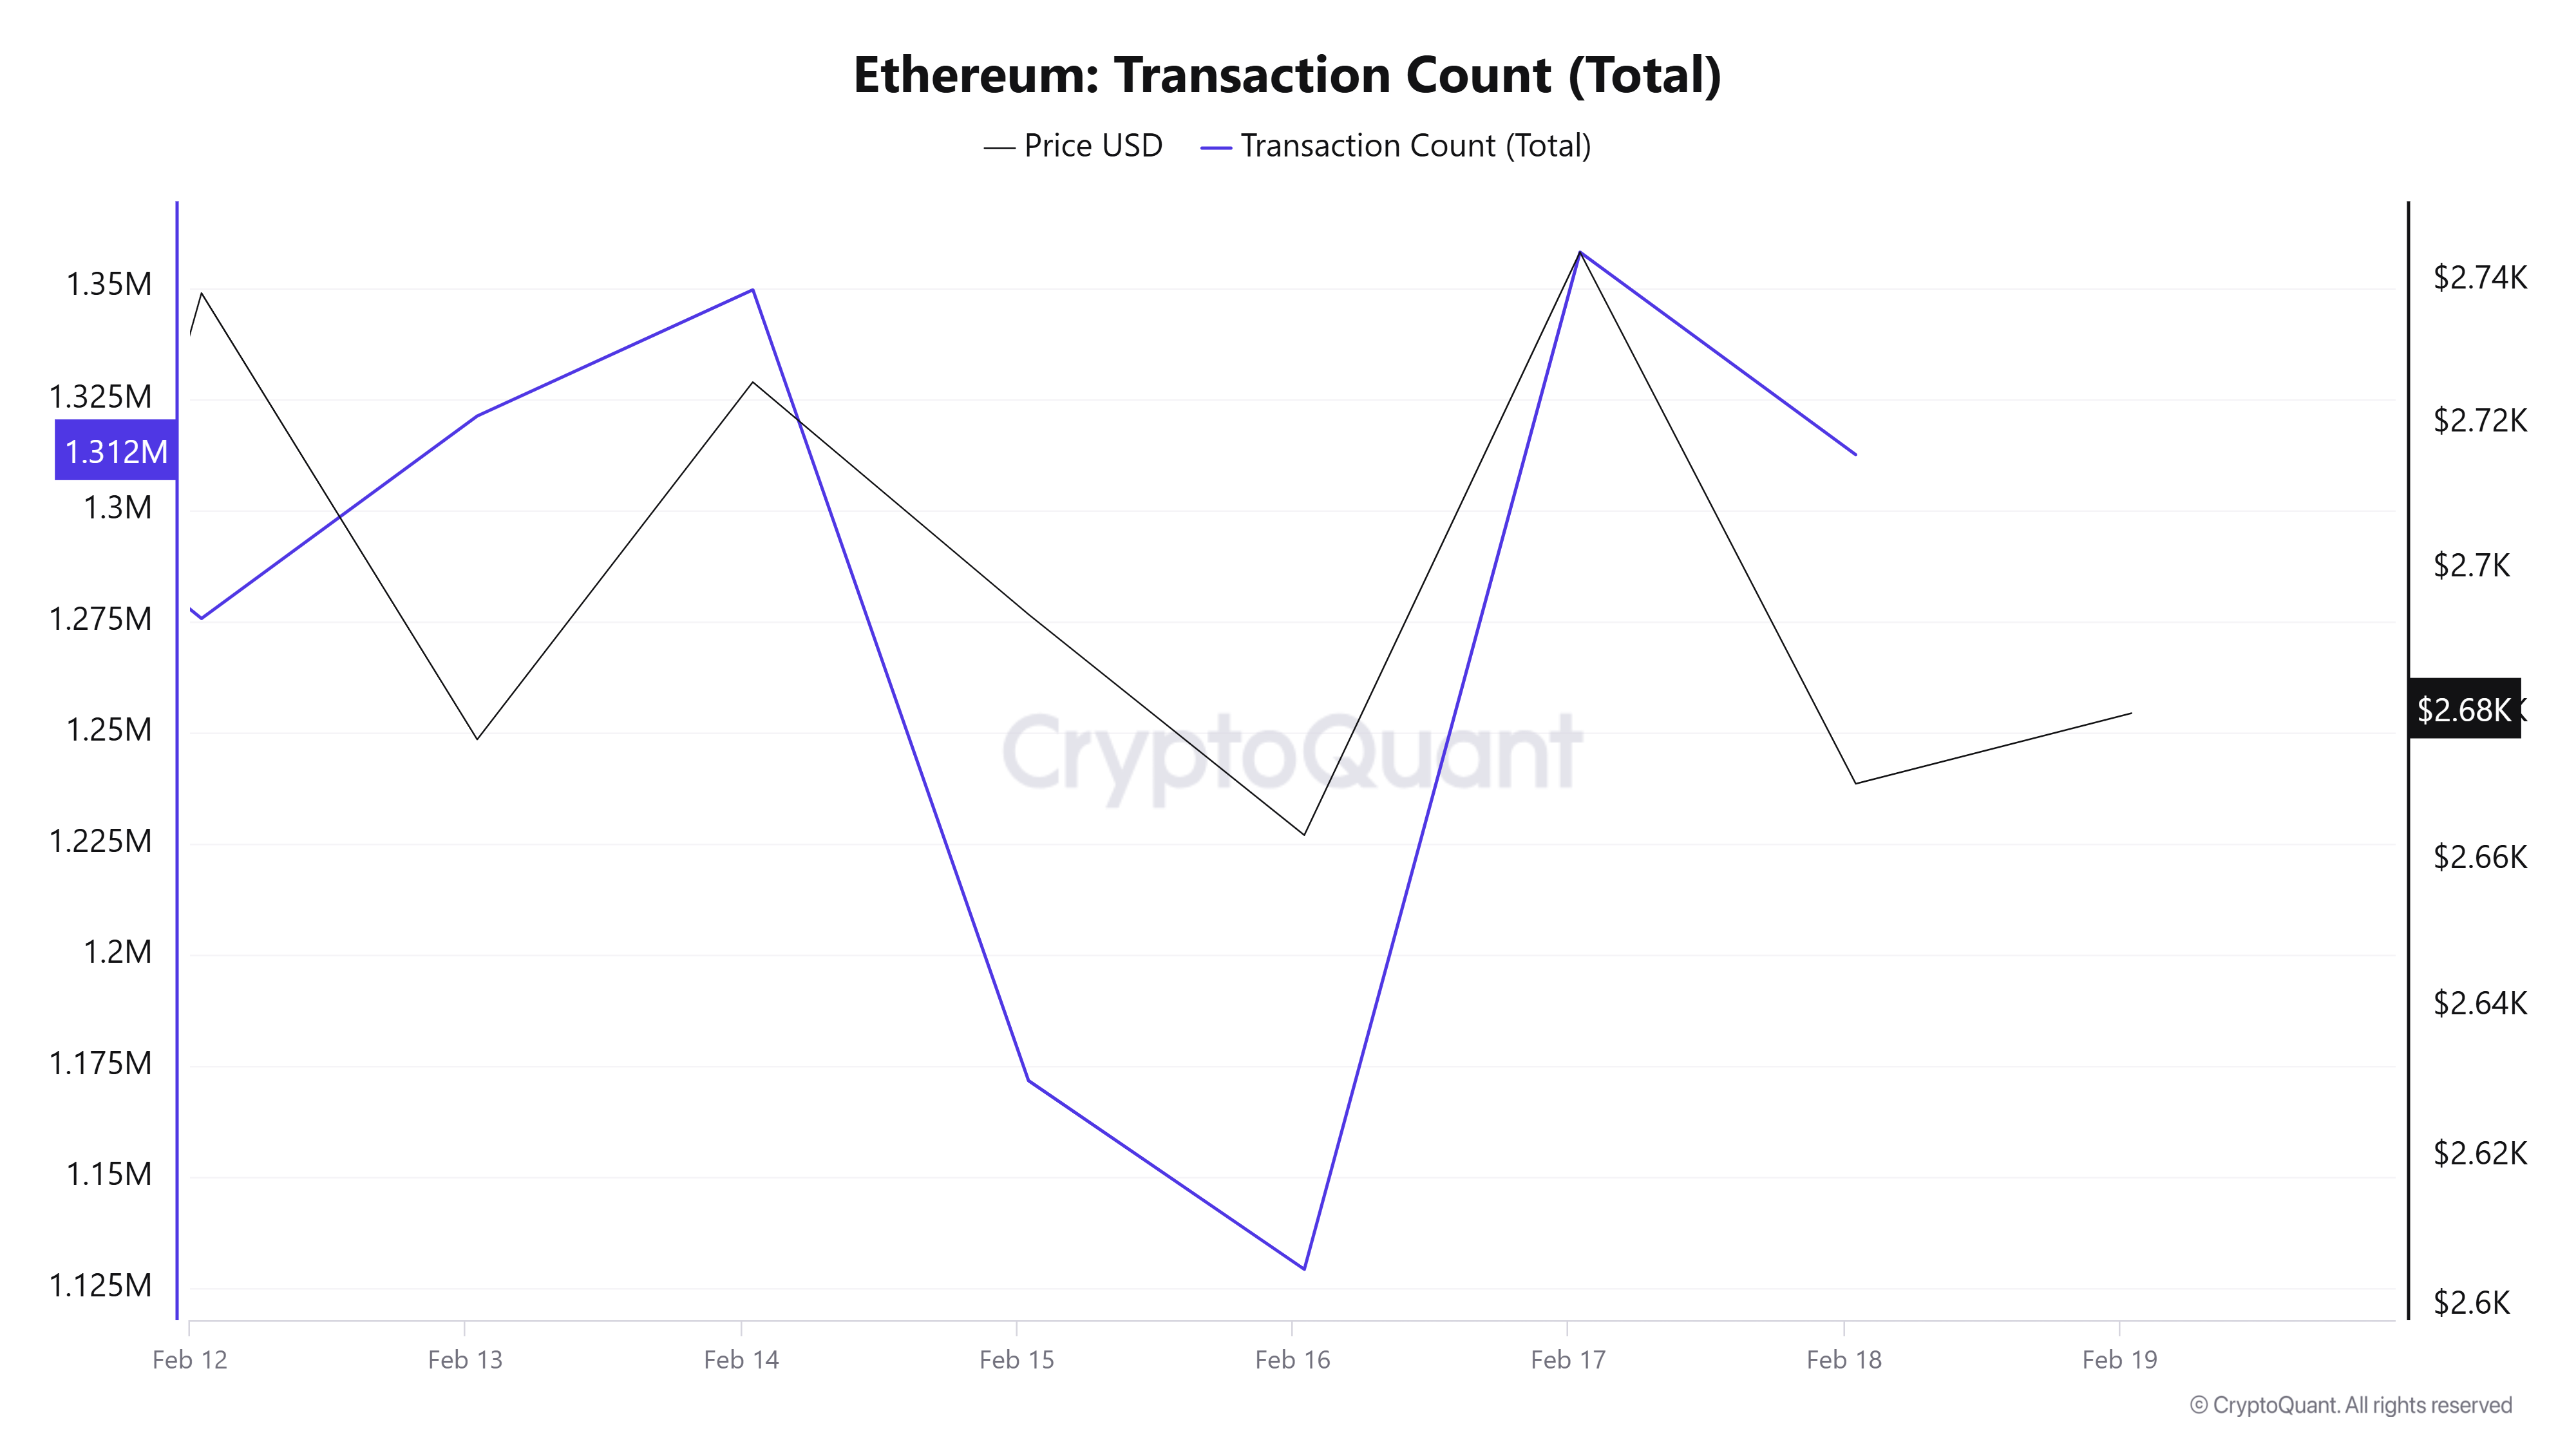
Transaction Count
Between Şubat 5-11, 8,947,017 trades were recorded, while in the following week, Şubat 12-18, the number dropped by 0.33% to 8,917,813. The lowest trading volume was 1,129,295 on Şubat 16, while the highest was 1,358,017 on Şubat 17. The lower number of trades on weekend days compared to weekdays can be attributed to institutional investors and lower trading activity on weekends. Moreover, the relationship between the number of trades in the network and the price appears to be positively correlated, as generally expected.
Tokens Transferred
While 13,661,318 units of Ethereum were transferred between Şubat 5-11, this amount decreased by 28.76% to 9,730,277 between Şubat 12-18. The least amount of Ethereum transferred was 737,014 on Şubat 15, while the most Ethereum transferred in a single day was 1,836,154 on Şubat 14. The smallest amount of Ethereum transferred and the smallest number of transactions also coincide with the volume-less market data that routinely occurs on weekends.
While there was a slight decrease in the number of transactions this week compared to last week, the total amount of Ethereum transferred was much lower, indicating that the average transfer size, or the amount of Ethereum per transaction, has decreased. This may indicate that investors are trading in smaller chunks or that institutional investors are less involved in the market.
Tahmini Kaldıraç Oranı
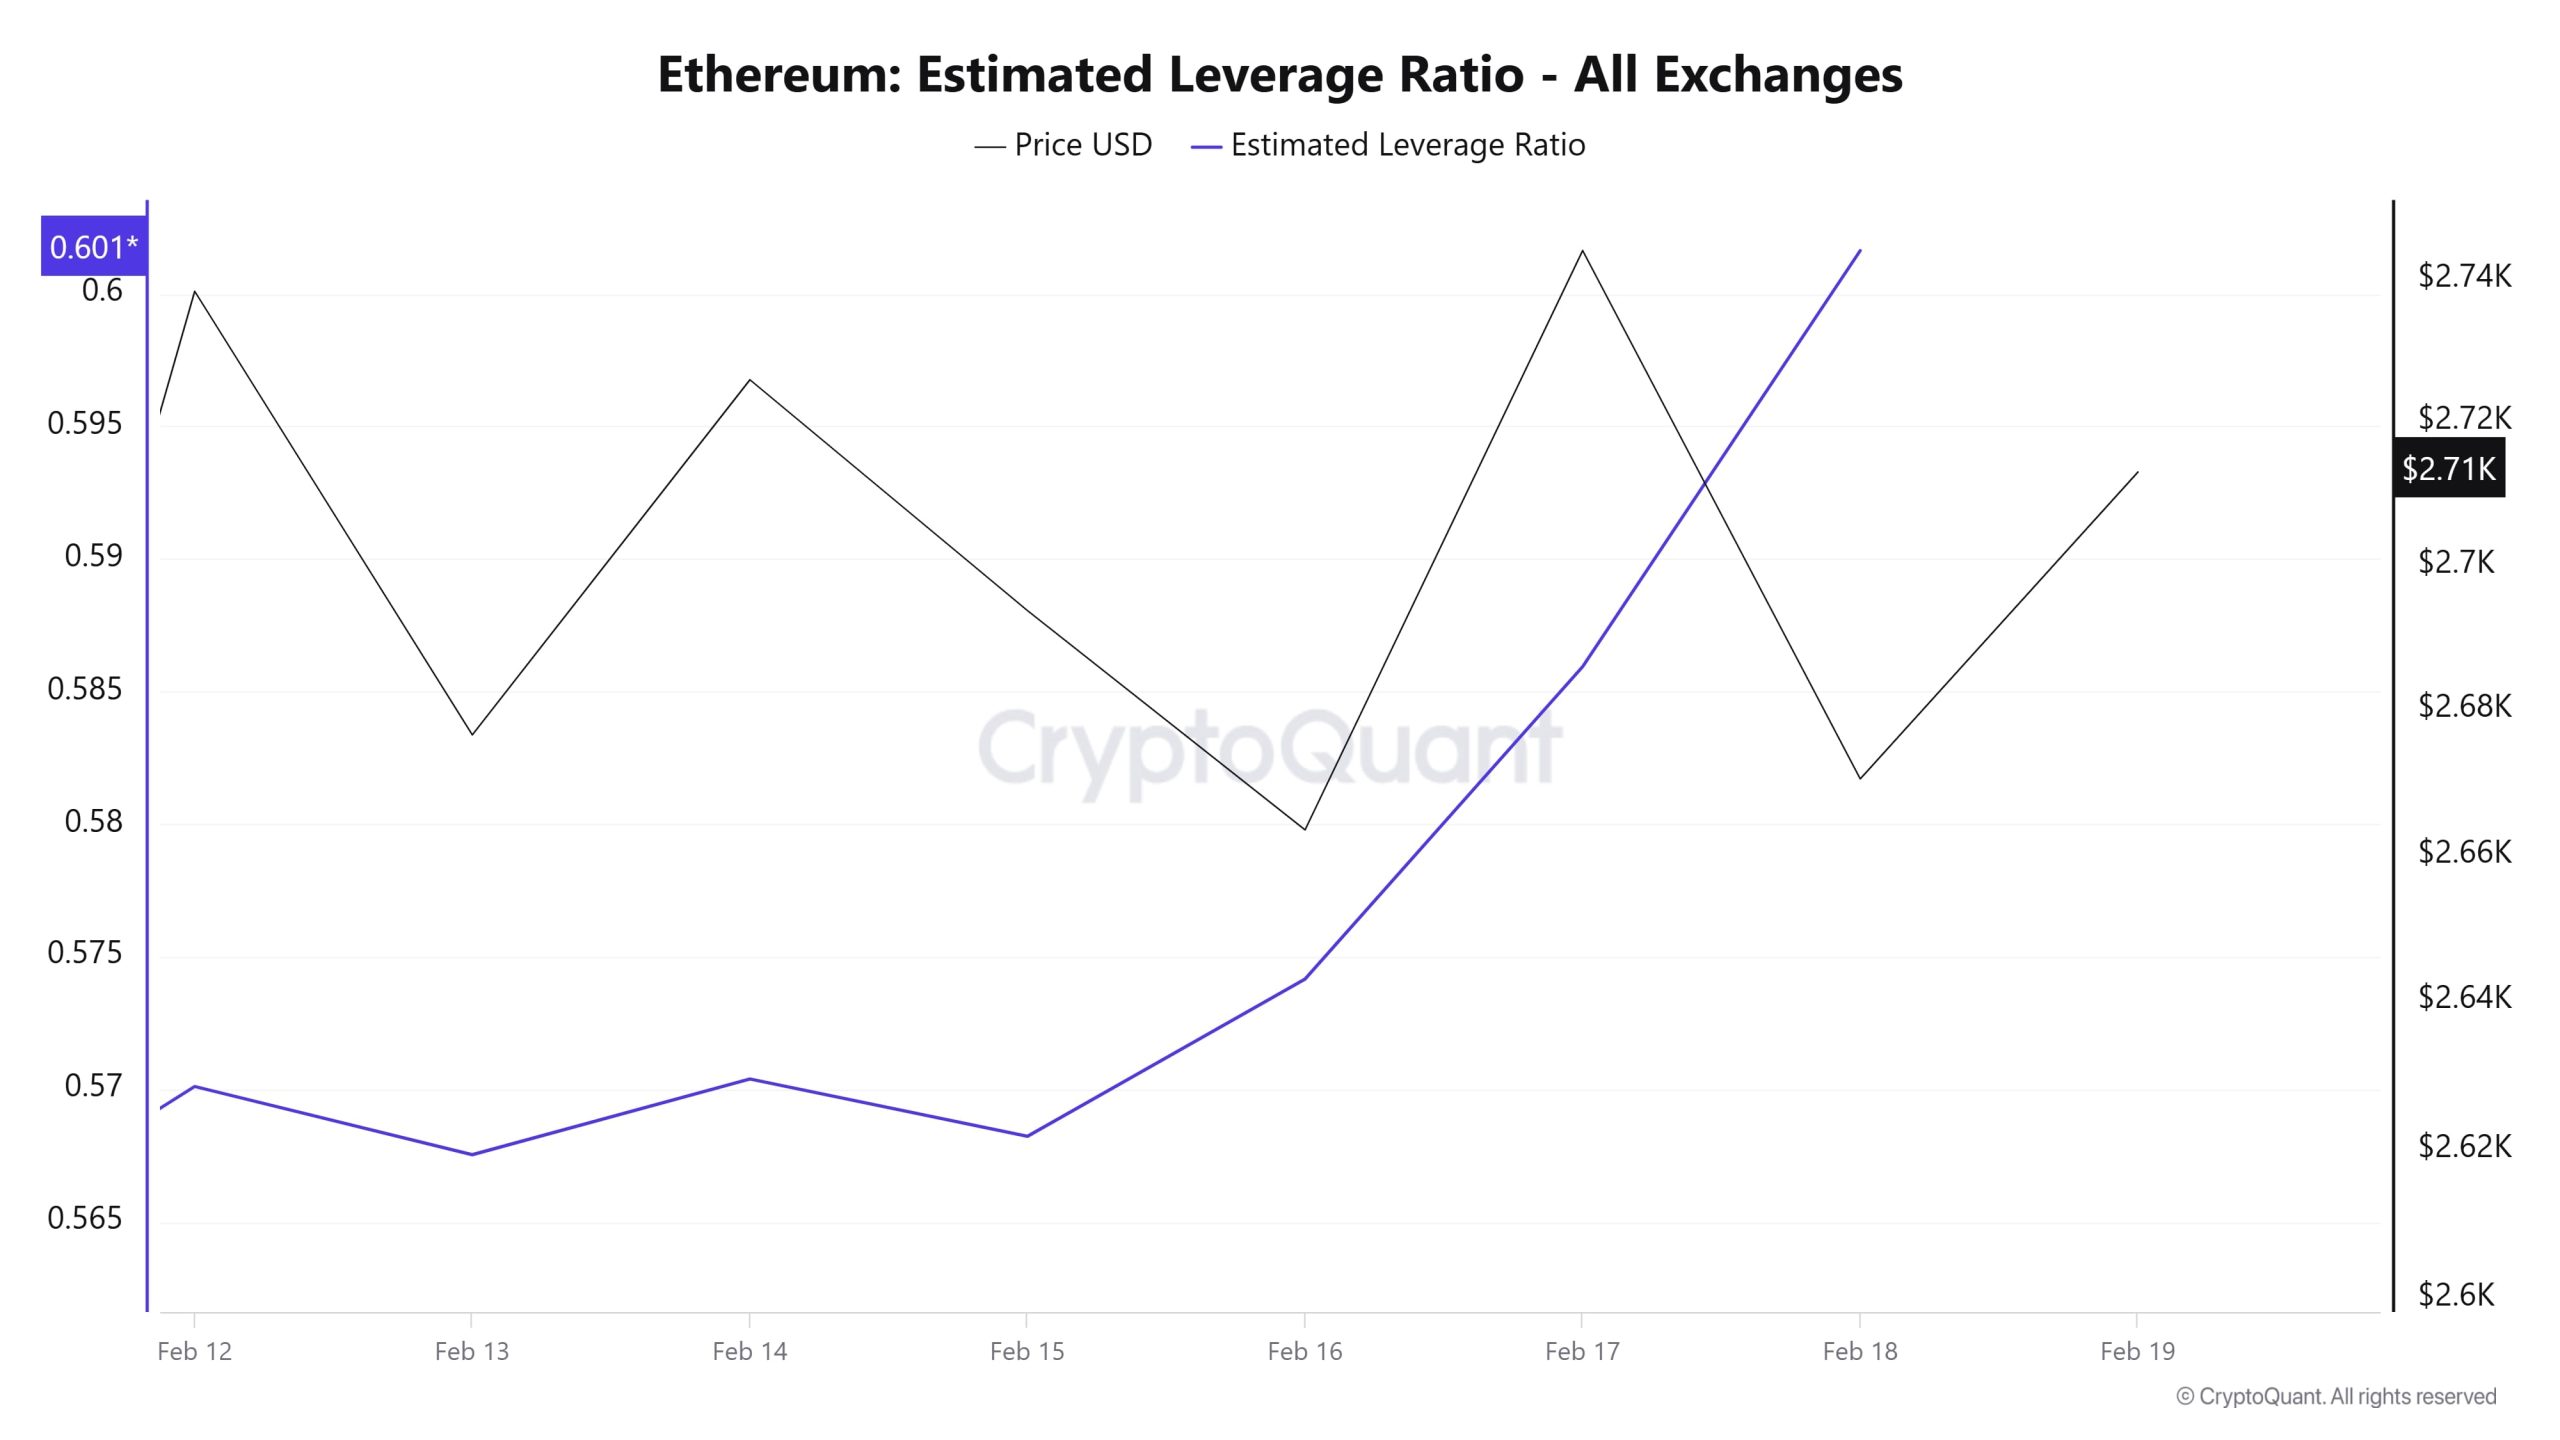
The rapid price drop in early Şubat had halted ELR’s uptrend. However, the metric has started to rise in the last 7 days. From 0.570 at the beginning of the period, the ELR is currently at a high of 0.601. A higher ELR means that participants are willing to assume more risk and usually indicates bullish conditions or expectations. It should be noted that these rises can also be caused by a decrease in reserves. When we look at Ethereum reserves, there were 18.8 million reserves at the beginning of the process and continued to increase towards the end of the process. Today, the number of reserves increased to approximately 19.28 million. At the same time, Ethereum’s Open Interest has increased from $ 21.27 billion to $ 23.55 billion in the last few days, revealing the reason for the metric’s rise. This coincides with a corresponding jump in the asset’s price from $2,400 to $2,711. This increase in open interest, as well as the increase in leverage, supports the view that investors have become more optimistic about Ethereum’s price movements. As a result, despite the increase in reserves, the increase in the ELR metric is bullish. If the price breaks the $3000 threshold, leveraged trades could increase as participants regain confidence. Another bullish sign is the large movement of ETH off exchanges, which indicates accumulation. While this is a positive signal and may not reverse the bearish trend in the short term, the metric is bullish in the medium term.
YASAL BİLDİRİM
Bu dokümanda yer alan yatırım bilgi, yorum ve tavsiyeleri yatırım danışmanlığı hizmeti niteliği taşımamaktadır. Yatırım danışmanlığı hizmeti, yetkili kuruluşlar tarafından kişilerin risk ve getiri tercihleri dikkate alınarak kişiye özel olarak verilir. Bu dokümanda yer alan yorum ve tavsiyeler genel niteliktedir. Bu tavsiyeler mali durumunuz ile risk ve getiri tercihlerinize uygun olmayabilir. Bu nedenle, sadece bu dokümanda yer alan bilgilere dayanarak yatırım kararı vermeniz beklentilerinize uygun sonuçlar doğurmayabilir.
NOTE: All data used in Ethereum onchain analysis is based on Cryptoqaunt.
