Breakdowns
MRVR
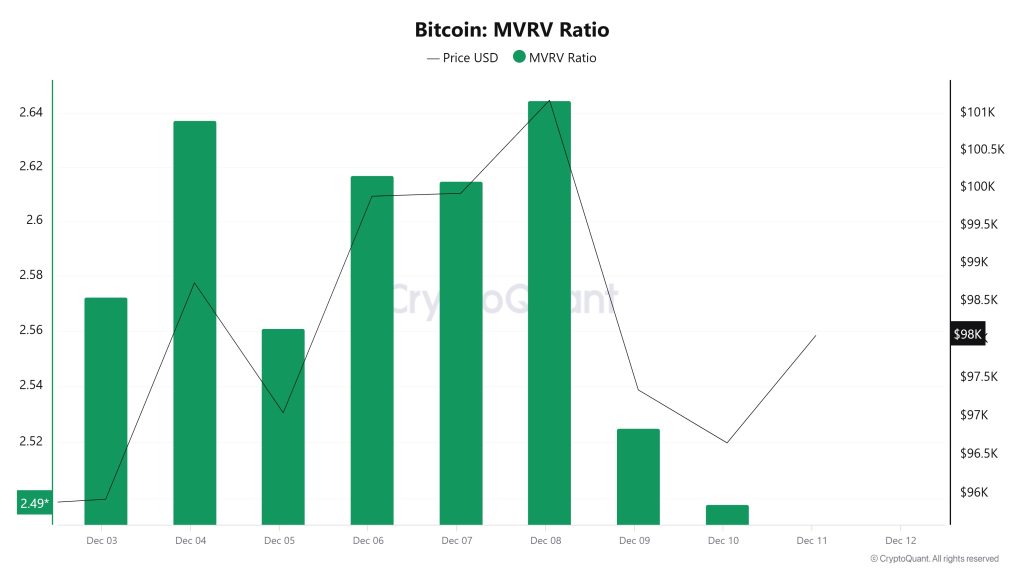
On Aralık 3, the Bitcoin price was at 95,931 and the MVRV Ratio was 2.57. As of Aralık 10, the price increased to 96,654 while the MVRV Ratio decreased to 2.49. During this period, Bitcoin price increased by 0.75% while MVRV Ratio decreased by 3.11%.
The fact that the price increase was accompanied by a decline in the MVRV ratio may indicate that some of the investors took profits and that the price increase may have been capitalized on by some of the market participants. However, the fact that the price continued to rise despite the MVRV decline may indicate that the market has not yet reached the overvaluation level and investors are limiting selling pressure.
Realized Price
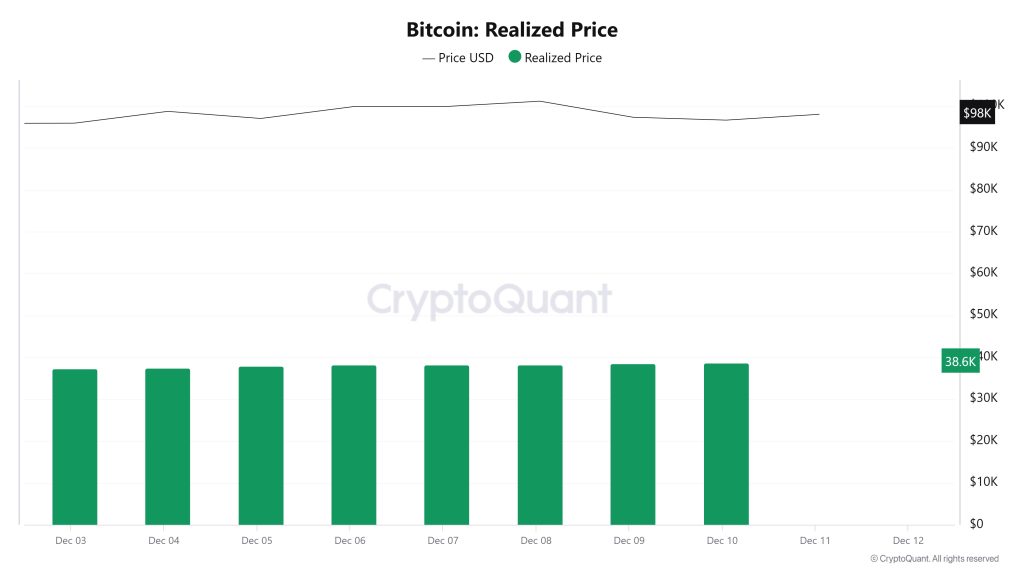
On Aralık 3, the Bitcoin price was 95,931 and the Realized Price was 37,294. As of Aralık 10, the Bitcoin price was at 96,654 and the Realized Price was at 38,694. During this period, the price increased by 0.75%, while the Realized Price rose by 3.75%.The higher Realized Price compared to the price increase may indicate that new demand entered the market during this period and existing investors largely held their positions. This may suggest that there is a long-term confidence in the market and that a healthy market foundation can be established.
Spent Output Profit Ratio (SOPR)
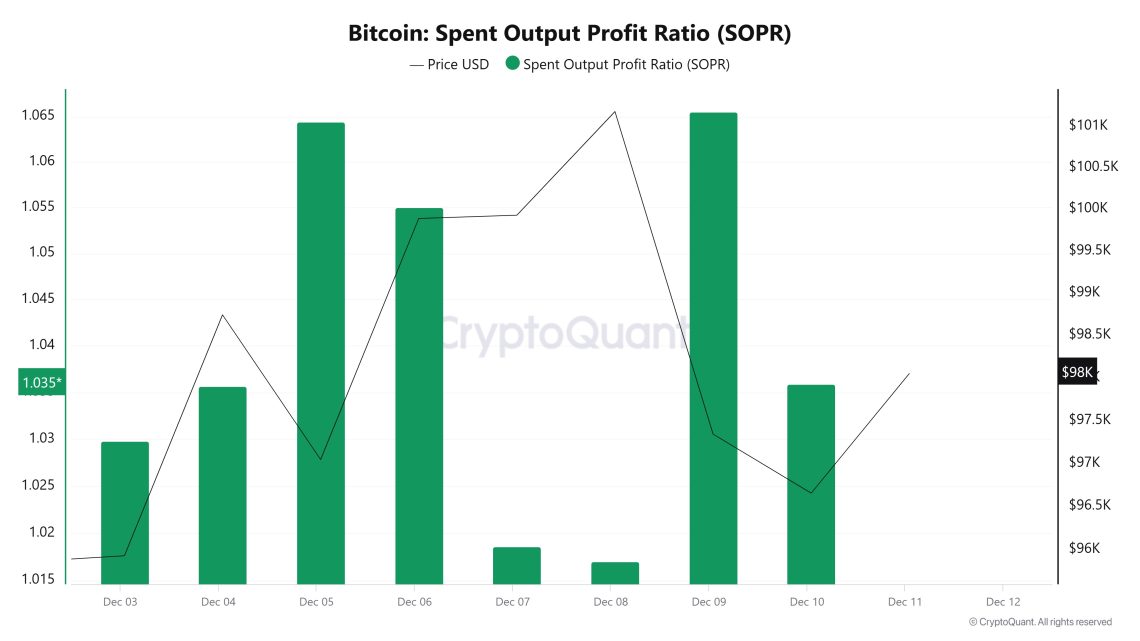
On Aralık 3, the Bitcoin price was at 95,931 and the SOPR metric was 1.02. As of Aralık 10, the Bitcoin price was at 96,654 and the SOPR metric was at 1.03. During this period, the price increased by 0.75%, while the SOPR metric rose by 0.98%.The increase in the SOPR value may indicate that market participants continue to make profitable sales. However, the fact that the SOPR is still above 1 may indicate that the market is generally in a profitable state and investor sentiment remains positive.
Türevler
Açık Faiz
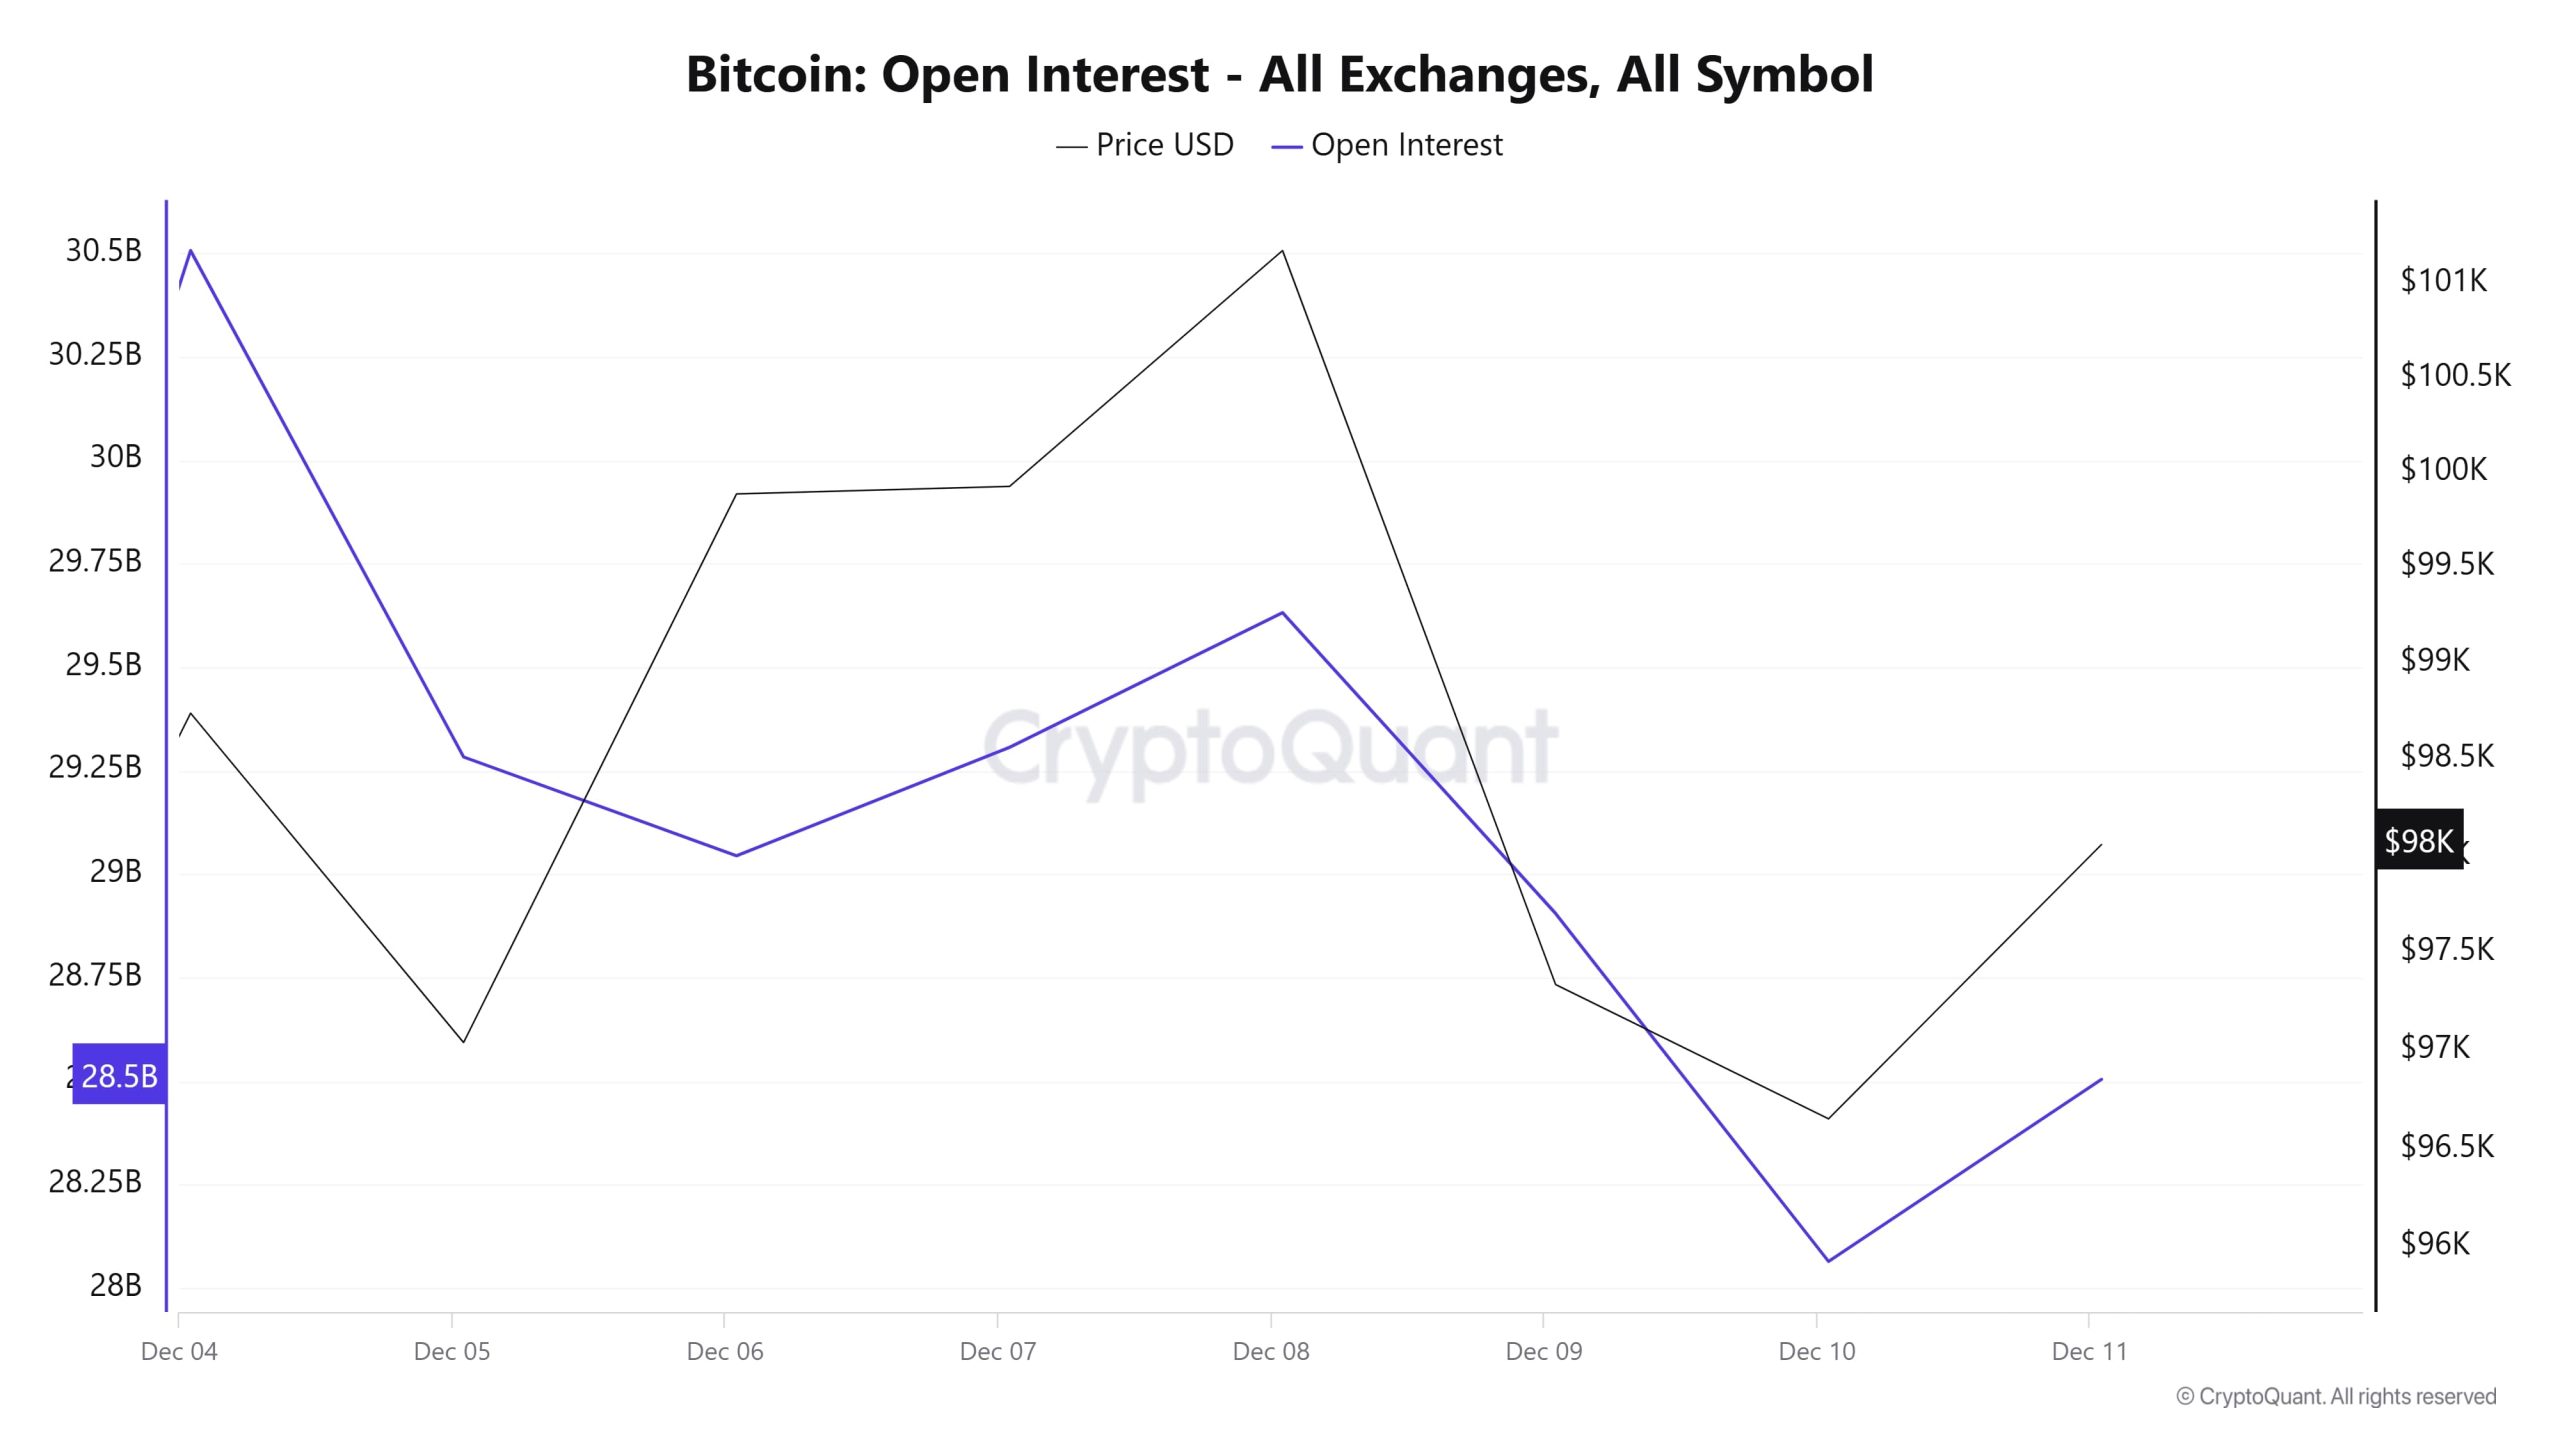
The fluctuations in Open Interest (OI) and Bitcoin price during the week have been quite remarkable. At the start of the week, OI stood at USD 30.5 billion. However, within a few days, this value dropped sharply to USD 28.5 billion. This suggests that the market has entered a period of strong liquidation or indecision in the first place. The Bitcoin price, on the other hand, was volatile throughout the week. On certain days, the price moved in line with the OI, while at other times it followed a different trend. This carries important clues about the market’s risk appetite and participants’ sentiment.
Normally OI and price have a strong correlation with each other. But there are some notable divergences here. On Aralık 7-8, while the OI increased, the price did not recover at the same pace. This may indicate that investors have different expectations about the market direction. At the same time, such divergences usually result in increased volatility. Therefore, it is important to be prepared for price volatility, especially during such periods. The simultaneous decline on Aralık 9-11 is a more obvious sign of risk. Market participants either closed their positions or experienced high levels of liquidation. The fact that the price did not recover in such a period suggests that the market may face more selling pressure in the short term.
Fonlama Oranı
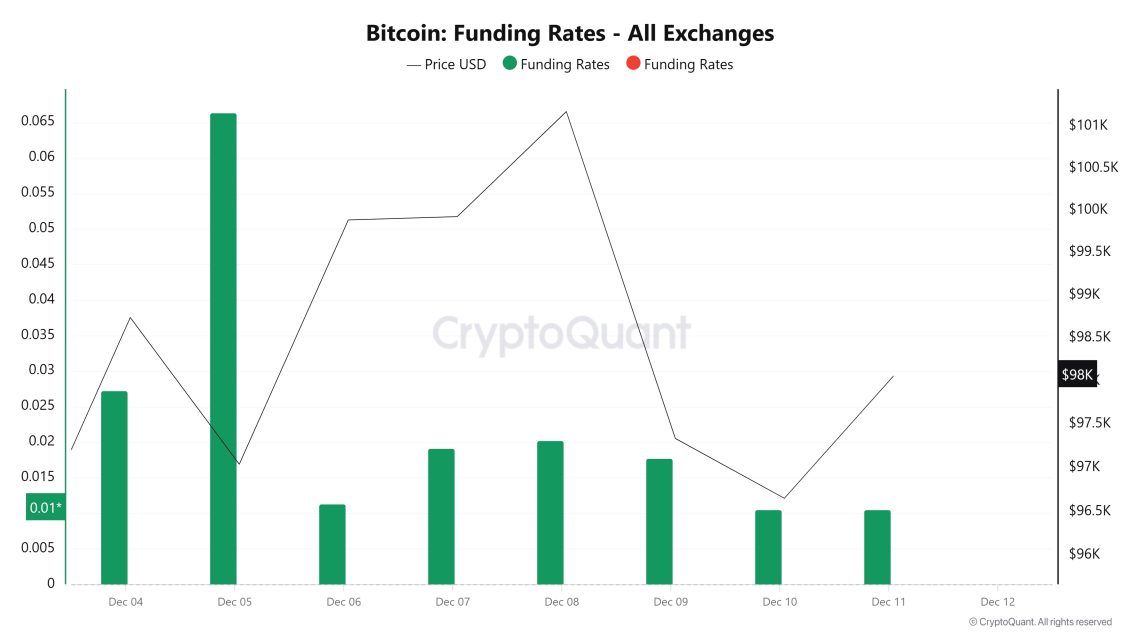
In the chart, we see the movements between Bitcoin price (black line) and funding rate (green bars) between Aralık 4-12. The following key trends are noticeable during this period. Initially, the Funding Rate is quite positive (around 0.065%) and the price increases during this period. However, in the following days, the funding rate decreases to a more stable level (0.01%-0.03%). The relationship between price and funding rate plays an important role in understanding market sentiment. In particular, a simultaneous rise in price and funding rate indicates that the market is supported by more long positions.
“Funding Rate Image to be Added”
Uzun ve Kısa Tasfiyeler
If we examine the Liquidations Map; the 102,000 – 104,500 band stands out as the region with the highest liquidation accumulation in the market. These levels can be considered as areas where price movements tend to attract liquidity. On the lower side, around $93,800 stands out as a strong support point. With the volatility experienced in the previous days, high liquidation amounts in the long and short direction stand out in the market. The reduction of open positions, especially with long liquidations, may lead the price to enter an upward period again in the coming weeks.
| Tarih | Uzun Tutar (Milyon $) | Kısa Tutar (Milyon $) |
|---|---|---|
| Aralık 05 | 67.2 | 33.89 |
| Aralık 06 | 5.6 | 19.24 |
| Aralık 07 | 3.19 | 2.13 |
| Aralık 08 | 4.93 | 7.35 |
| Aralık 09 | 56.96 | 15.35 |
| Aralık 10 | 13.44 | 9.29 |
| Toplam | 151.32 | 87.25 |
Tedarik Dağıtımı
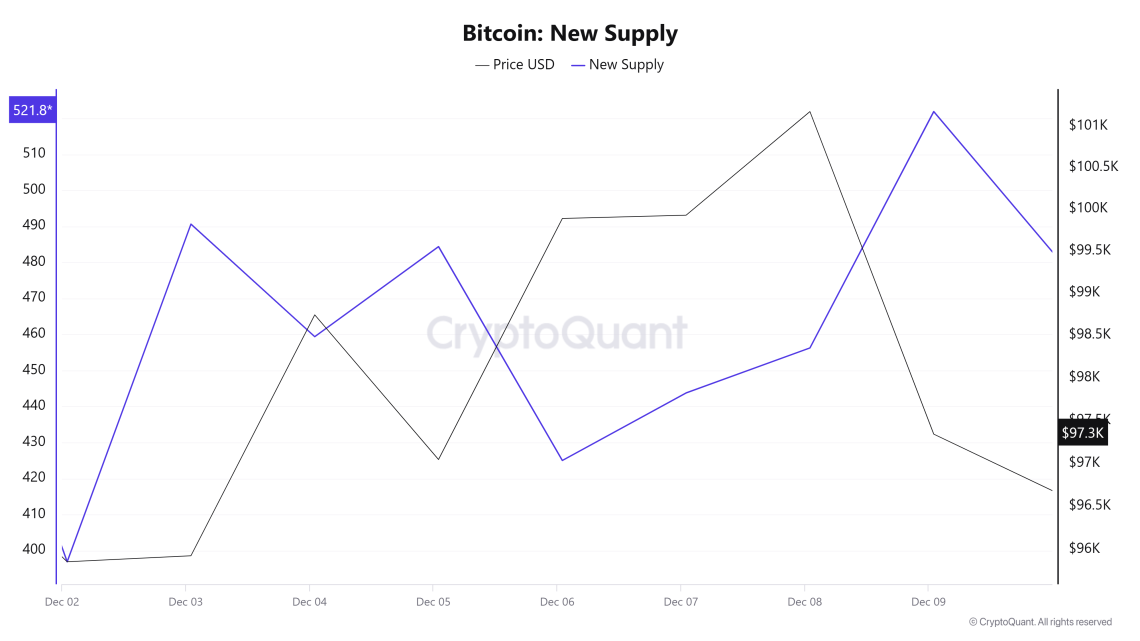
Total Supply: It reached 19,793,799 units, up about 0.0141% compared to last week.
New Supply: Production was 3,281 this week, up from 3,075 in the previous week.
Velocity: There was a small decline in the data compared to last week.
| Cüzdan Kategorisi | 03.11.2024 | 09.12.2024 | Change | Analiz |
|---|---|---|---|---|
| < 0.1 BTC | 1.617% | 1.609% | -0.008% | There was a slight decline among small investors, and micro investor interest may have waned. |
| 0.1 – 1 BTC | 5.453% | 5.437% | -0.016% | Individual investors showed sensitivity to market volatility and experienced a small decline. |
| 1 – 100 BTC | 32.355% | 32.318% | -0.037% | Medium-sized investors experienced a small decline. |
| 100 – 1k BTC | 21.786% | 22.02% | 0.234% | Large investors showed a remarkable increase during this period. |
| 1k – 100k BTC | 35.514% | 35.341% | -0.173% | Whales and funds may have adjusted portfolios. |
| > 100k BTC | 3.274% | 3.274% | 0.000% | The ratio between institutions and large funds remained stable, and this category remained stable. |
Genel Değerlendirme
The increase in supply and the slight decline in velocity compared to last week indicate that investors see Bitcoin as a value investment and adopt a custody strategy. In wallet breakdowns, small and medium-sized investors were negatively affected by market fluctuations, while the proportion of large investors increased and the proportion of institutional investors increased, indicating that expectations about Bitcoin price are positive.
Döviz Rezervi
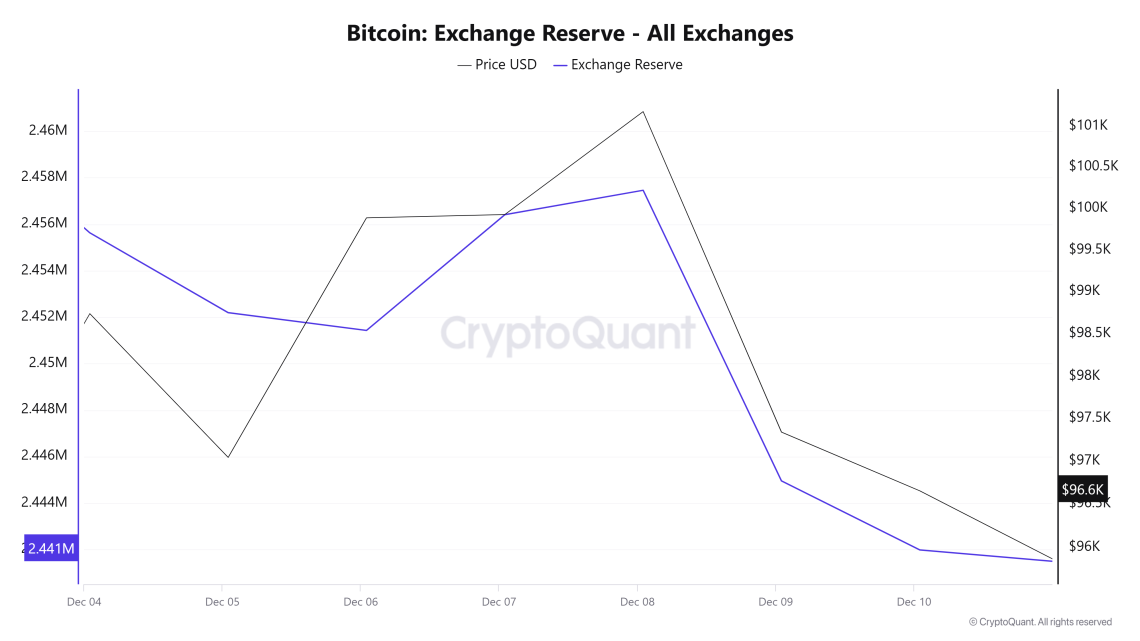
Between Aralık 4 and Aralık 10, 2024, 18,863.67 Bitcoins exited the exchanges. During this period, the Bitcoin reserve of the exchanges decreased by approximately 0.7%. Bitcoin price was volatile during this period. After Bitcoin rose to $ 101,000, it fell to $ 94,000 with the sales that came after. As Bitcoin rose to $101,000, exchanges’ Bitcoin reserves increased. This was interpreted by the market as investors transferring Bitcoin to exchanges to make profit realization and whales manipulating the market to lower the price. As the Bitcoin price fell to $94,000, exchange reserves also declined.
| Tarih | Aralık 4 | Aralık 5 | Aralık 6 | Aralık 7 | Aralık 8 | Aralık 9 | Aralık 10 |
|---|---|---|---|---|---|---|---|
| Exchange Inflow | 55,268.40 | 83,711 | 71,071.80 | 22,196.62 | 14,065 | 53,085 | 44,647 |
| Exchange Outflow | 60,486.66 | 87,146 | 71,836.66 | 17,215.25 | 13,015 | 65,592 | 47,616 |
| Exchange Netflow | -5,218.26 | -3,435 | -764.86 | 4,981.37 | 1,049.93 | -12,507 | -2,969 |
| Döviz Rezervi | 2,455,629 | 2,452,100 | 2,451,429 | 2,456,410 | 2,457,460 | 2,444,900 | 2,441,900 |
| BTC Price ($) | 98,741.98 | 97,043 | 99,888.88 | 99,928.36 | 101,177 | 97,340 | 96,654 |
The high volatility in the market as Bitcoin reserves continue to decline has been interpreted by market analysts as a result of strategic moves and price speculation by large investors. While large investors moving their Bitcoins to cold wallets shows the long-term upside potential of the Bitcoin price, the decrease in exchange reserves may cause high volatility on the market in the short term.
Ücretler ve Gelirler
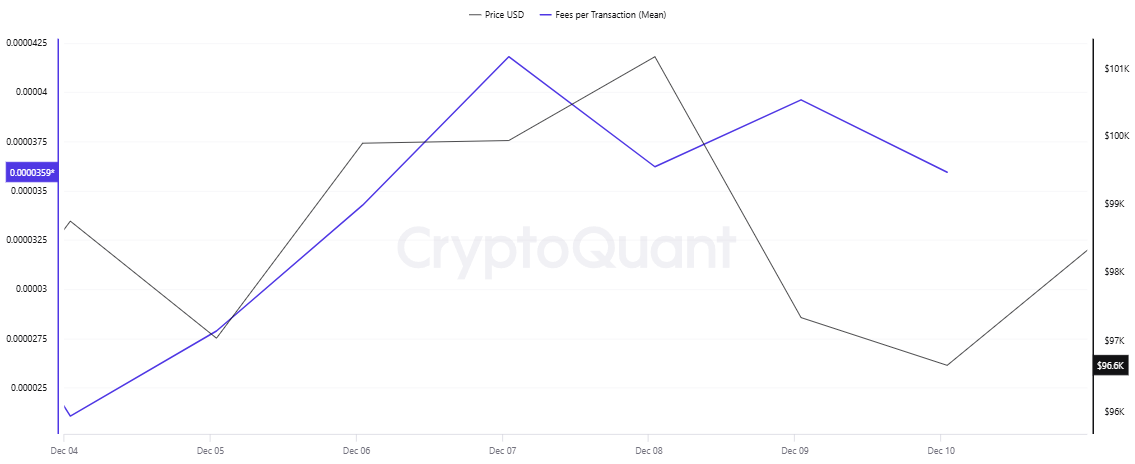
When the Bitcoin Fees per Transaction (Mean) data between Aralık 04- 10 are analyzed, Fees (Mean), which was 0.00002356 on 04, accelerated after the extremely volatile movements seen in the Bitcoin price on Aralık 05 (lowest level of $ 90,500, highest level of $ 104,088) and reached the peak of the week with the level of 0.00004181 on Aralık 07. Despite the relatively quieter Bitcoin price action in the following days, Fees (Mean) was realized at 0.00003594 on Aralık 10, , the last day of the weekly period.
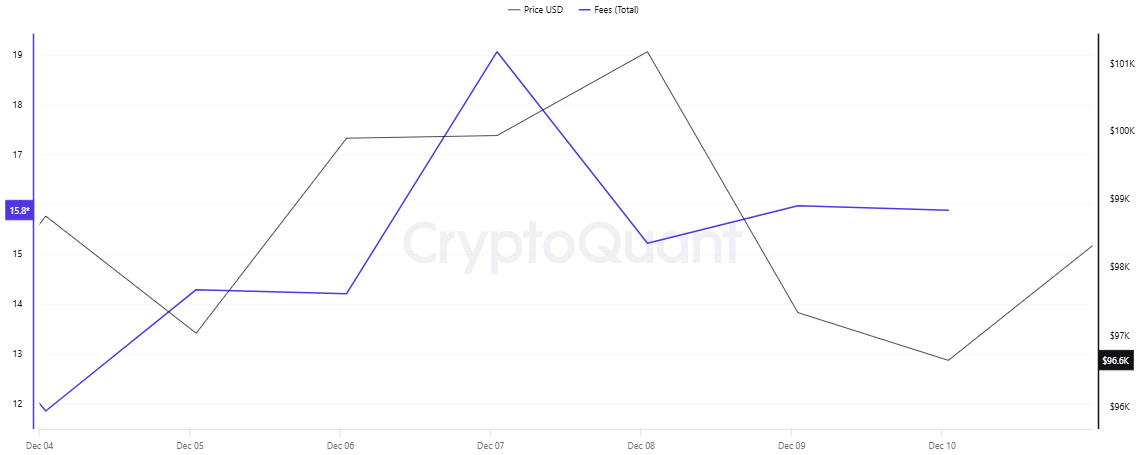
Similarly, when Bitcoin: Fees (Total) data between Aralık 04 and 10, Fees (Total), which increased with the Bitcoin price movement on Aralık 05, reached a peak level of 19.06458146 on Aralık 07. Although some retracement was observed after the peak, Fees (Total) was realized at 15.8789993 on Aralık 10, the last day of the weekly period.
Miner Flows
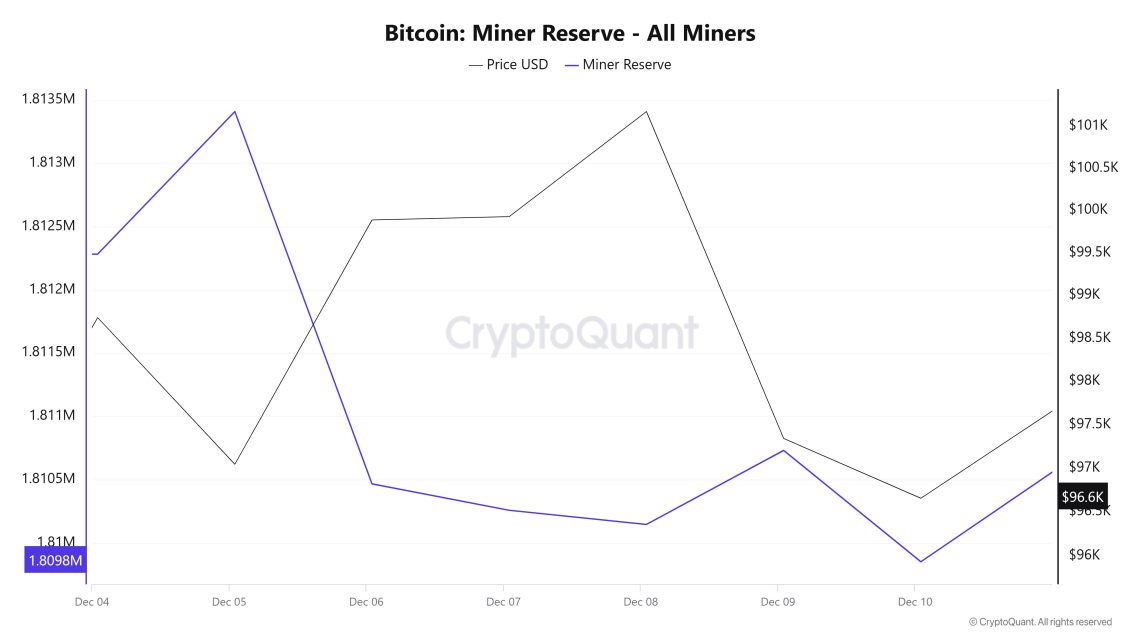
As can be seen in the Miner Reserve table, the number of Bitcoins in miners’ wallets increased at the beginning of the week and then decreased slightly. At the beginning of the week, miner reserve and Bitcoin price had a negative correlation, but the correlation turned positive on the last day.
Miner Inflow, Outflow and Netflow
From Aralık 4 to Aralık 10, 65,842 Bitcoins exited miners’ wallets and 63,409 Bitcoins entered miners’ wallets between the same dates. Miner netflow for this week was – 2,433 Bitcoin. On Aralık 4, the Bitcoin price was $98,741, while on Aralık 10 it was $96,654.
During the week, the net flow (Miner Netflow) was generally negative as Bitcoin inflow into miner wallets (Miner Inflow) was less than Bitcoin outflow from miner wallets (Miner Outflow).
If the recent positive correlation between miner reserve and Bitcoin price does not continue in the coming week, increased inflows to miner wallets may create selling pressure in the market, and possible increases in miner netflow may cause the Bitcoin price to fall.
| Tarih | Aralık 4 | Aralık 5 | Aralık 6 | Aralık 7 | Aralık 8 | Aralık 9 | Aralık 10 |
|---|---|---|---|---|---|---|---|
| Miner Inflow | 8,080.9 | 11,373.80 | 3,739.1 | 6,437.83 | 10,045.40 | 15,339 | 8,392.56 |
| Miner Outflow | 8,961.4 | 10,788.79 | 3,850.8 | 6,646.47 | 12,989.16 | 14,212 | 8,394.11 |
| Miner Netflow | -880.5 | 585.01 | -111.65 | -208.64 | -2,943.8 | 1,127.2 | 1.5451 |
Transaction
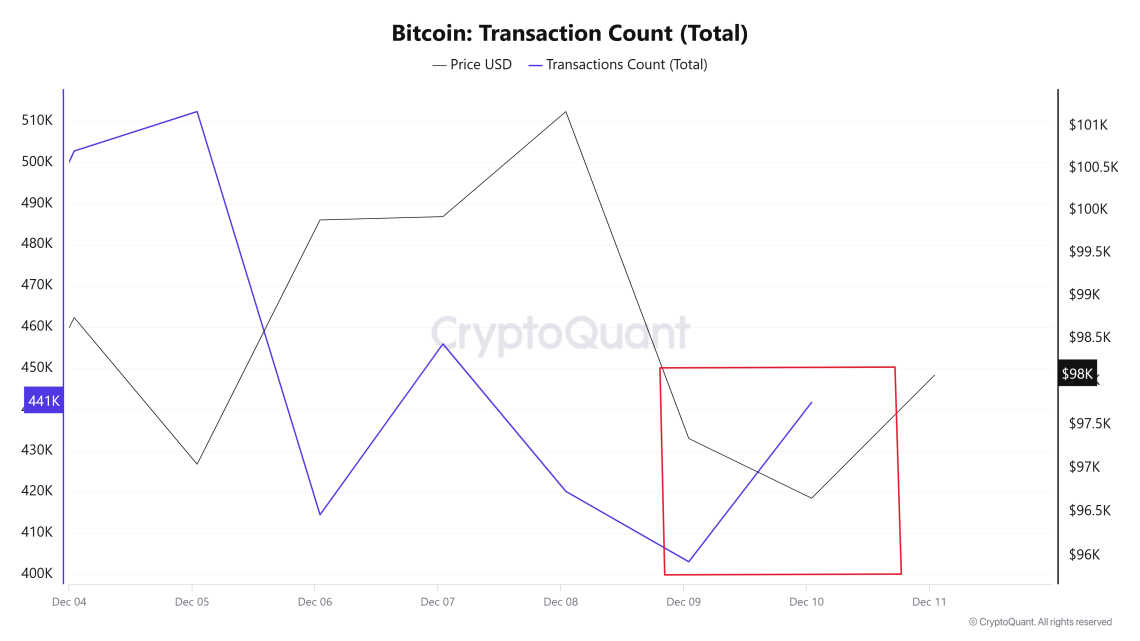
Transaction Count
When Bitcoin transfers between Aralık 4-10 are analyzed, it is observed that there is a decrease in the number of transfers on the Bitcoin network in the days after Aralık 5. While this decrease positively affected the Bitcoin price on Aralık 5-9, the increase in transfers on Aralık 10 shows an inverse correlation with the price. This Aralık 10th inverse correlation (highlighted by the red square in the chart) indicates that the news flow about “Microsoft’s Bitcoin Investment Decision” was a temporary pullback and was not supported on the onchain.
When the number of transfers as well as the total number of bitcoins carried by these transfers are analyzed, it is observed that the number of bitcoins transferred decreased every day between Aralık 5-8 compared to the previous day. Especially on Aralık 7-8, it is noteworthy that the “Number of Bitcoins Transferred/Number of Transactions” ratio bottomed out with a significant decrease. This suggests that the number of transfers carrying large amounts of Bitcoin decreased on weekends and that most of the large transfers were made by institutional investors rather than individual whales.
Tokens Transferred Mean
The average number of bitcoins per transfer between Aralık 4-10 ranged between 1 and 2.8. While the average number of bitcoins transferred on Aralık 7-8 was observed to be at the lowest levels of the week, the average number of transfers during the week was more than 2 times higher than the weekend, indicating that more voluminous transfers took place during the week.
Whale Activities
CryptoQuant analyst Darkfost highlighted recent Bitcoin whale activity in relation to certain price levels. He noted that market whales, i.e. investors with more than 1,000 BTC, have been steadily increasing their BTC holdings when prices fall between $95,000-99,000. Darkfost’s observation reported that Bitcoin whales bought 20,000 BTC worth over $2 billion after the asset suffered a sudden collapse on Cuma.
Interestingly, the CryptoQuant analyst notes that BTC whales showed a similar pattern of accumulation when the asset traded in the $55,000-70,000 range for more than eight months before embarking on its latest bull run in Kasım. Therefore, the $95,000-99,000 surge in whale assets could turn this price range into a strong support zone supporting another price rally in the short to medium term.
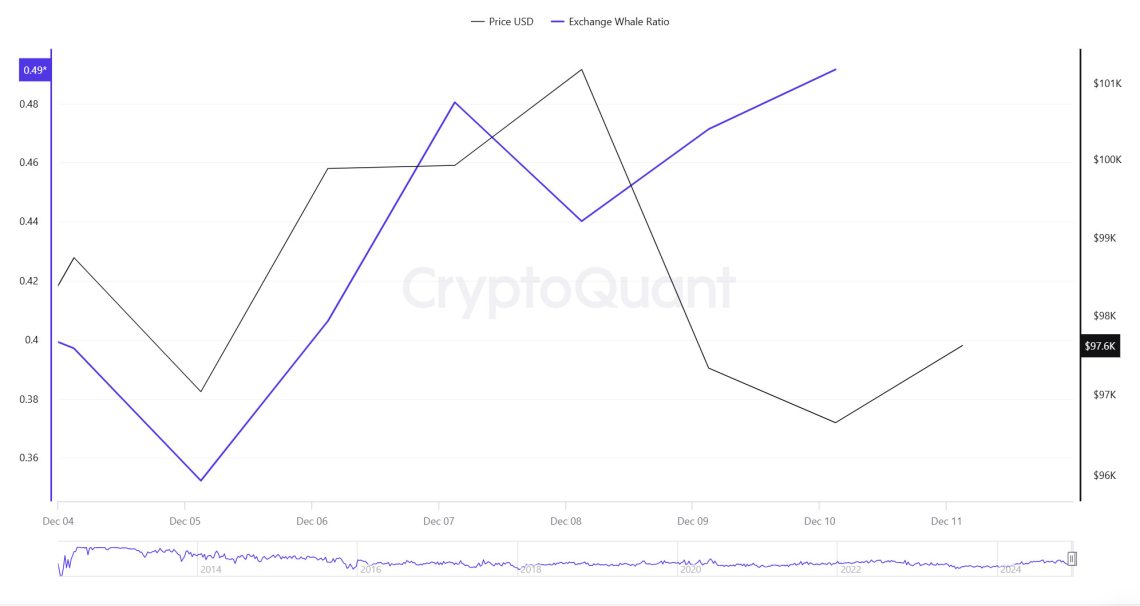
Cryptoquant Data
When we look at the ratio of 1-week whale movements on central exchanges, it is seen at a rate of 0.49. When this ratio is above 0.35, it usually means that whales want to dispose of BTC. The ratio of 0.49 means that the BTC price is bearish. At the same time, when we look at the total BTC transfer, we see that 6,073,540 BTC moved, an increase of about 50% compared to last week. Finally, Bitcoin whales currently hold 12 million BTC. This is a strong bullish signal of growing interest and market confidence.
Active Addresses
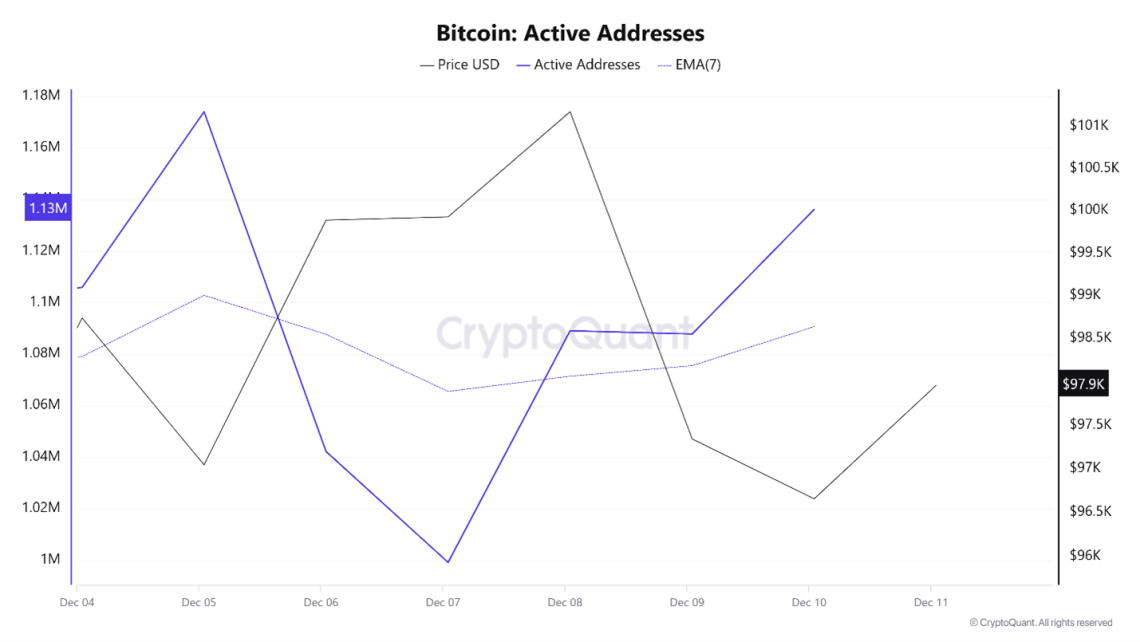
This week, $1,174,000 in active addresses entered exchanges between Aralık 4 and Aralık 6, 2024. During this period, Bitcoin rose from $94,000 to $104,000. With the increase in active addresses, it supported Bitcoin purchases of trading and ready-to-trade addresses. The correlation with the Bitcoin active address EMA (7) reached 1,102,837 this week. This triggered the rise of the Bitcoin price to the $100,000 levels. In the chart below, inflows are accelerating at the intersection of the 7-day EMA and the price of the number of active addresses.
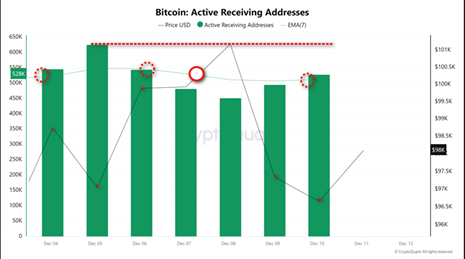
The outflows began between Aralık 5 and Aralık 9, with active shipping addresses rising as high as 839,230. The rise in active shipping addresses showed that the Bitcoin price started to fall from $104,000 to $98,000.
The EMA (7) for active shipping addresses rose to 821,532, signaling that outflows are likely to continue. The fact that active address outflows reached 874,047 in the decline of Bitcoin prices may indicate that there may be some profit selling according to this onchain data and the decline in Bitcoin price will continue.
YASAL BİLDİRİM
Bu dokümanda yer alan yatırım bilgi, yorum ve tavsiyeleri yatırım danışmanlığı hizmeti niteliği taşımamaktadır. Yatırım danışmanlığı hizmeti, yetkili kuruluşlar tarafından kişilerin risk ve getiri tercihleri dikkate alınarak kişiye özel olarak verilir. Bu dokümanda yer alan yorum ve tavsiyeler genel niteliktedir. Bu tavsiyeler mali durumunuz ile risk ve getiri tercihlerinize uygun olmayabilir. Bu nedenle, sadece bu dokümanda yer alan bilgilere dayanarak yatırım kararı vermeniz beklentilerinize uygun sonuçlar doğurmayabilir.
NOTE: All data used in Bitcoin onchain analysis is based on Cryptoqaunt.