
BTC/USDT
Looking at the key developments, we see that institutional investors’ interest in Bitcoin reached a record high in the second quarter of 2025. During this period, a total of 159,107 BTC was added to company balance sheets, marking the highest quarterly institutional BTC accumulation on record. Additionally, the minting of 1 billion USDT on the Tron network within a single day stands out as a significant development that could boost market liquidity.
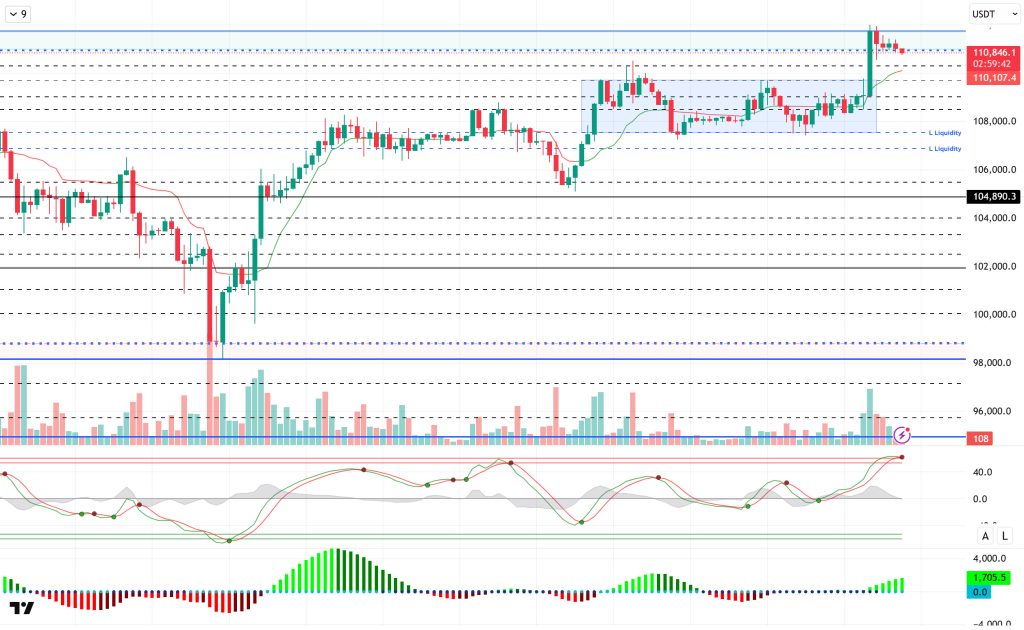
Looking at the technical picture, the BTC price tested the all-time high of 112,000 during the day before retreating just below the 111,000 level. Based on the price structure, the current movement may be following a flag formation pattern.
Technical indicators, Wave Trend (WT) may signal a trend reversal in the overbought zone along with the latest uptrend. The Squeeze Momentum (SM) indicator’s histogram has moved into the positive zone, continuing to provide momentum support, while no signs of weakening have yet emerged. The Kaufman moving average has risen to the 110,100 level and is tracking in parallel with price movements.
Looking at liquidity data, a short-term accumulation of buy positions at the 110,000 level is observed, while a strong accumulation of buy positions at the 106,600 level continues over a broader time frame.
In summary, while fundamental developments continue to act as catalysts for pricing, a new development may be needed for the uptrend to gain momentum after this stage. Technically, after short-term upward movement support, weakness may be seen, and if liquidity data indicates that upward price movements are driven by liquidity purchases, liquidity purchases may be made at levels where buy positions are located. In the continuation of the upward movement, closes above the 111,000 level will serve as a reference for us in terms of ATH, while in the event of potential selling pressure, we will monitor the 110,000 support level and the nearest liquidity zone.
Supports 110,000 – 109,000 – 108,500
Resistances 111,000 – 112,000 – 115,000
ETH/USDT
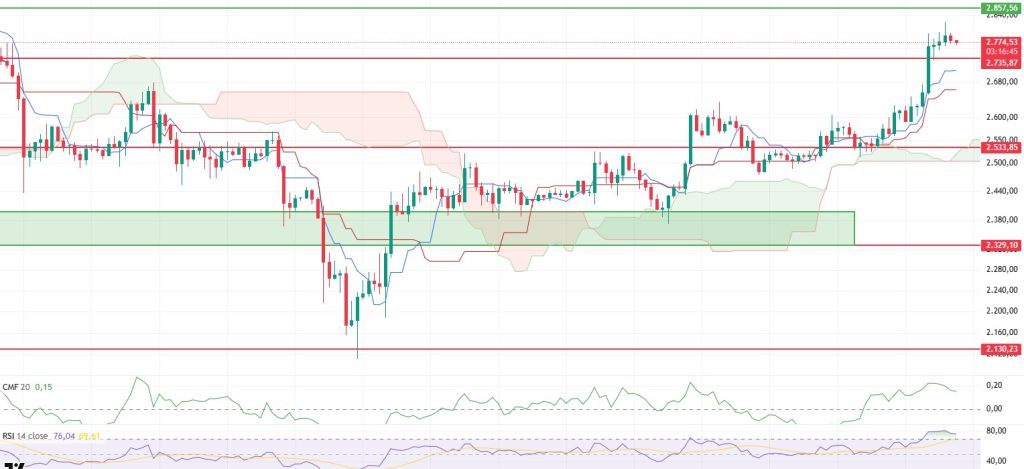
The price of Ethereum remained flat during the day, managing to stay at around $2,770. During this flat movement, some technical indicators showed limited pullbacks. It can be said that the market experienced a slight slowdown due to profit-taking by short-term buyers.
Although the Chaikin Money Flow (CMF) indicator remains in positive territory, it has begun to show a slight downward trend. This indicates that overall interest in the market continues, but liquidity outflows have increased to a limited extent following the recent rally, suggesting that investors are moving toward partial profit-taking. Although the indicator has not yet crossed into negative territory, such minor fluctuations support the notion that the market is in a state of equilibrium.
The Relative Strength Index (RSI) began to show a downward trend after entering the overbought zone yesterday. This reversal in the RSI indicates that the price needs a short-term correction and that the sustainability of current levels is being tested. In this context, the weakening signal in the RSI suggests that a potential pullback is technically justified.
When examining the Ichimoku indicator, it can be seen that the price continues to remain above both the kijun and tenkan levels, while the kumo cloud also remains horizontal. This structure indicates that the market is searching for a new direction and has entered a short-term consolidation phase. However, the fact that the price remains above all these levels supports the overall upward trend and suggests that momentum has not yet been completely lost.
In conclusion, it is possible that the ETH price may retreat to the $2,735 level in the short term. This correction can be considered a healthy consolidation. However, as long as the price does not remain below this level, the overall trend is expected to remain positive, and upward movements may gain momentum again in the coming period.
Supports 2,735 – 2,533 – 2,329
Resistances 2,857 – 3,062 – 3,246
XRP/USDT
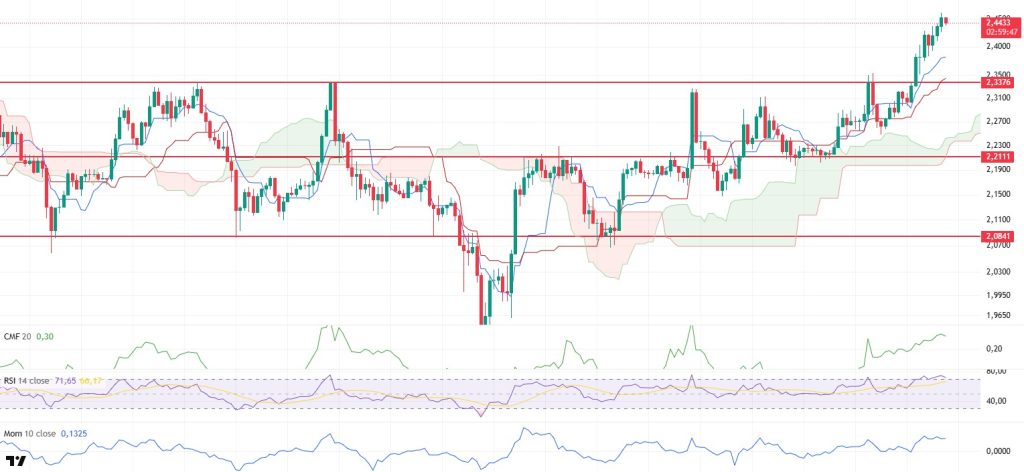
The XRP price showed a slightly bullish outlook during the day and managed to rise above the $2.44 level. When evaluated in conjunction with technical indicators that are not signaling overbought conditions, this rise suggests that the current movement is on a healthy footing and has the potential to continue.
The Relative Strength Index (RSI) indicator continues to move sideways despite being close to the overbought zone. This horizontal appearance in the RSI indicates that the market has not yet shown signs of correction and that the upward trend is continuing in a controlled manner. The momentum indicator also moving in a similar directionless and horizontal manner alongside the RSI suggests that the price is in a short-term balancing phase and is gathering strength to determine a new direction.
The Chaikin Money Flow (CMF) indicator remains in positive territory, signaling continued demand for XRP and that liquidity flows within the market are still favoring buyers. The CMF’s upward trend is an important factor strengthening the structural support behind the uptrend, particularly in the short to medium term.
On the Ichimoku indicator, the overall structure appears to be maintaining its positive outlook. The price continuing to move above the cloud indicates that the upward trend is technically confirmed, while the cloud continuing to expand upward can be interpreted as a signal increasing the likelihood of a sudden and strong rise in the short term. In particular, the price remaining above the tenkan and kijun levels indicates that the market is maintaining its direction.
In the overall assessment, it seems likely that XRP will continue its upward movement in the evening hours, maintaining the positive structure of the technical indicators. However, the $2.33 level is a critical support level in the event of a possible pullback. Any declines to this level are expected to be a healthy correction from a technical perspective and not disrupt the overall trend structure.
Supports 2.3376 – 2.2111 – 2.0841
Resistances 2.5900 – 2.8347 – 3.1497
SOL/USDT
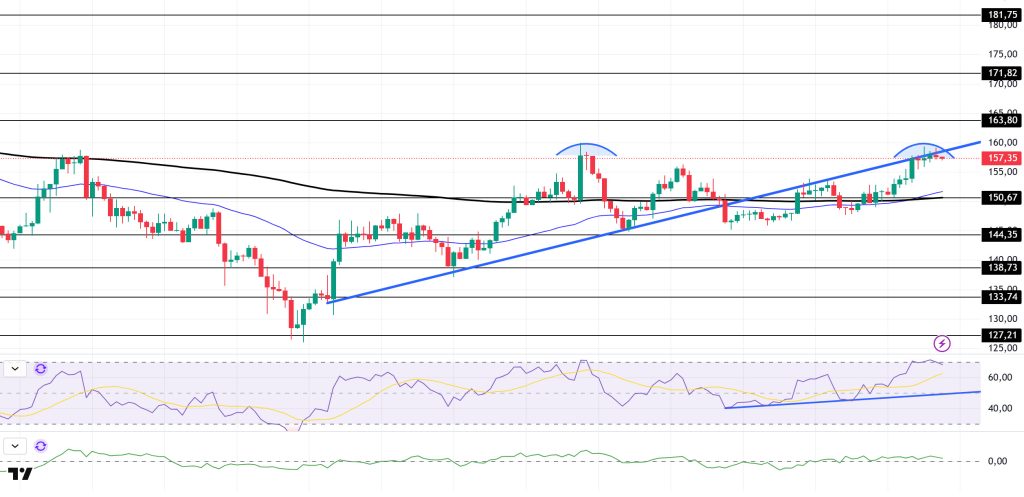
SOL price is trading sideways during the day. The asset is currently testing the resistance level of the uptrend that began on June 23. If it breaks above this level, the $163.80 level should be monitored as a strong resistance level. At the same time, the double top formation that has formed could cause a decline.
On the 4-hour chart, the 50 EMA (Blue Line) has started to move above the 200 EMA (Black Line). This indicates that an upward trend may be starting in the medium term. At the same time, the price being above both moving averages shows that the market is currently trending upward in the short term. Chaikin Money Flow (CMF-20) remained in positive territory; however, a decrease in money inflows could push CMF into negative territory. The Relative Strength Index (RSI-14) remained in positive territory and is in the overbought zone. This could trigger profit-taking. Additionally, it remains above the upward trend that began on July 4. In the event of an upward movement driven by macroeconomic data or positive news related to the Solana ecosystem, the $163.80 level emerges as a strong resistance point. If this level is broken to the upside, further upward movement is expected. In the event of a pullback due to adverse developments or profit-taking, the $150.67 level could be tested. A decline to these support levels could see an increase in buying momentum, potentially presenting a buying opportunity.
Supports 150.67 – 144.35 – 138.73
Resistances 163.80 – 171.82 – 181.75
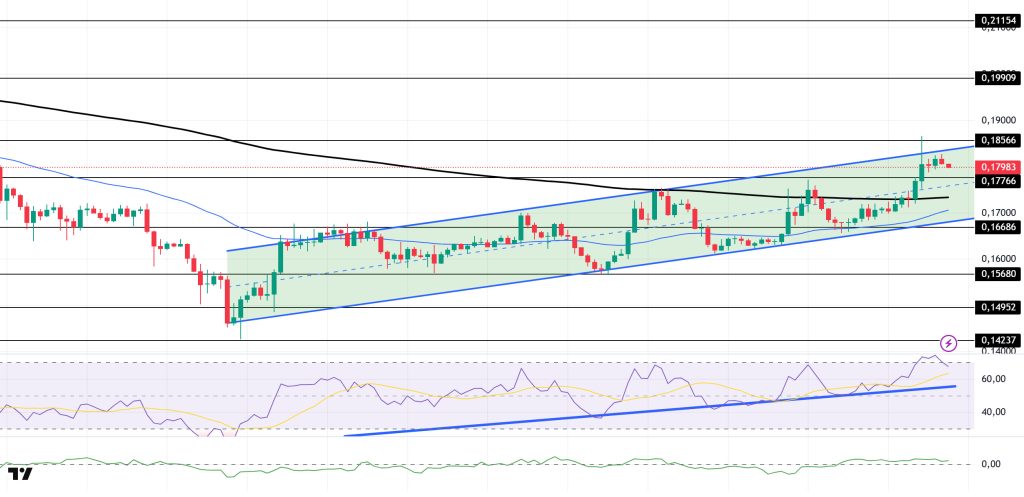
DOGE/USDT
DOGE price continued its upward trend. The asset managed to stay above the 50 EMA (Blue Line) moving average and broke above the 200 EMA (Black Line) moving average, testing the ceiling level of the upward trend that began on June 22 and experiencing a pullback. If the pullback continues, the 200 EMA moving average could be tested as support. If the asset closes above the rising trend, the $0.18566 level could be monitored.
On the 4-hour chart, the 50 EMA (Blue Line) remains below the 200 EMA (Black Line). This indicates that the asset is in a downtrend in the medium term. The price being above both moving averages signals that the asset is in an uptrend in the short term. Chaikin Money Flow (CMF-20) remains in positive territory. Additionally, negative cash inflows could push the CMF into the negative zone. The Relative Strength Index (RSI-14) is in the overbought zone and continues to remain above the upward trend that began on June 22, supported by that trend. Being in the overbought zone may trigger profit-taking. In the event of upward movements driven by political developments, macroeconomic data, or positive news flow within the DOGE ecosystem, the $0.18566 level emerges as a strong resistance zone. In the opposite scenario or in the event of negative news flow, the 0.16686 dollar level could be triggered. A decline to these levels could increase momentum and potentially initiate a new upward wave.
Support 0.17766 – 0.16686 – 0.15680
Resistance levels 0.18566 – 0.19909 – 0.21154
Legal Notice
The investment information, comments and recommendations contained herein do not constitute investment advice. Investment advisory services are provided individually by authorized institutions taking into account the risk and return preferences of individuals. The comments and recommendations contained herein are of a general nature. These recommendations may not be suitable for your financial situation and risk and return preferences. Therefore, making an investment decision based solely on the information contained herein may not produce results in line with your expectations.